Application of a Class of Trading Ideas in the Design of Quantitative Strategy for Bitcoin Futures
Publisher: BuyBit Inc. & Paiclub Capital
Author: Su Wenjie
Abstract: This paper designs two quantitative trading strategies related to Bitcoin futures. The difference lies in whether the trading ideas described in the article are introduced, and the two strategies are compared and evaluated.
"Taro Lin's theory is premised on the idea that the stock price is impossible to predict. The theory of stocks or futures in the world is mostly a method of prediction. They all desperately boast that their method has a high guess rate. If If these theories are common sense, then Takabayashi ’s theory is' meaningless. 'Economists, when discussing the idea that the stock price is unpredictable, came to the conclusion:' Even if we work hard on the method of trading, It can be concluded that the average performance of transactions in the market is higher than that of others' technology. However, Takabayashi's point of view is contrary to that of economists, and he clearly states: 'A method for making money exists'.
- Unlimited printing of the Federal Reserve will increase public trust in Bitcoin
- The US Federal Reserve “unlimited water”, so “Bitcoin”
- One article revealed the mystery of the North Korean hacker team: the world is fighting the epidemic, but they are stealing Bitcoin?
According to the textbook: 'The market is efficient and prices are usually adequate. 'But the reality is that, despite the fact that the situation hasn't changed, prices have changed dramatically every day. This shows that neither individual investors who have just started trading or professional fund managers who operate huge amounts of funds have failed to take effective actions. Here, we focus on the theory of "can make money" advocated by Taro Lin Hui, which is the theory of market technology. That is to say, although you can't expect to take 100% efficient and correct actions in trading, as long as you can make each trading action a little reasonable, this slight difference can lead to better trading performance than others. Some; repeating excellent deals and accumulating them can generate huge benefits. "
——From the preface of the Chinese version of Taro Hayato's "Technology of the Futures Market"
I. Trading ideas borrowed from strategy
The strategy borrows two ideas from the literature [1]:
The first is to establish a test position. The purpose of establishing a test position is to gain a sense of the direction of price fluctuations through it. Later, according to the market, the official positions (or main positions) are gradually established. Formal positions are a group of positions with a certain size and a formal purpose for profit.
Second, hedging positions are often established. Taking the buying position of recent futures as an example, while holding a certain amount of short selling position in forward futures, the purpose is divided into three types:
1. Insure the purchase position. Although the offset is equivalent to reducing the number of buying positions, when the number of short positions is less than the number of buying positions, the position as a whole is still a "more money, more profitable" position.
2. Earn speculative short positions in falling markets. It seems that this is the same as the former, but the essence of the idea is to treat the current futures with a buy position and the forward futures with a short position as two completely different futures. The operator according to changes in the market, Adjust the number of buy and sell positions accordingly.
3. Lock short interest positions.
Although the three short-selling positions appear to be the same in form, their thinking is different, and the measures taken according to market changes are also different.
More details will not be repeated here. This article designs two strategies for comparison.
Second, the adopted exchange and ordering methods
Because Deribit exchanges can use Websocket to place orders, this is not available on most exchanges. In order to improve the efficiency of order placement, a quantitative strategy is constructed on Deribit, and operations such as market acquisition and order use Websocket.
The following table shows the time difference between placing orders using REST and Websocket on the Deribit Exchange test network (Websocket orders are performed under Websocket long connection, so the time required to establish a long connection is not considered). The test was performed on the Hong Kong host at 2020.3.26 15: 34-15: 58, using the API V2 interface of the exchange, and the content was 10 market orders for BTC perpetual contracts each time, a total of 8 tests:
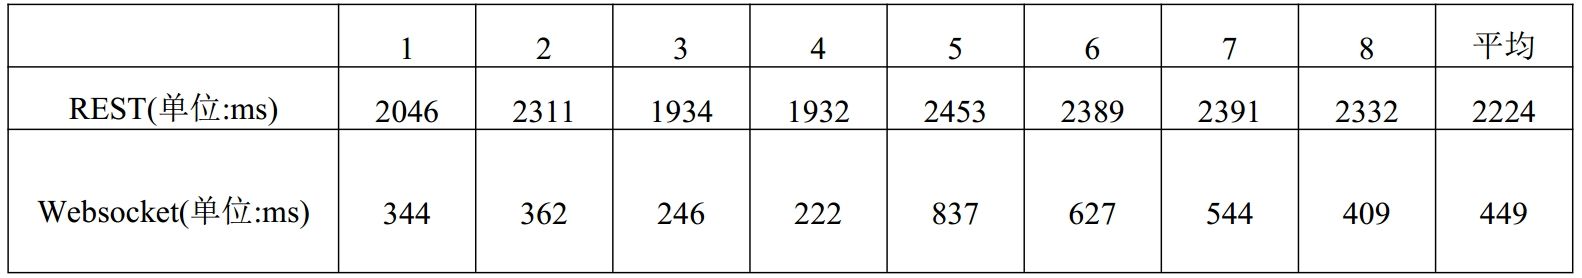
Table I
As can be seen from the above table, the average order time for REST is 2224 milliseconds, and the average order time for Websocket is 449 milliseconds, which is about 4.95 times that of the latter . Therefore, the use of the latter can greatly improve ordering efficiency.
Design of two and two quantitative strategies
According to our previous article published on Golden Finance [2] -"Analysis of Long and Short Pressure of BTC Spot-Liquidity Measurement of Limit and Market Orders" (https://www.jinse.com/blockchain/464819 .html), we wrote an indicator program for Deribit's futures contracts. In the indicator values, only the "equivalent pressure" indicator value and the "average equivalent pressure" indicator value were used to short the BTC perpetual contract and the short-term contract Many, market orders are used to place orders, and a quantitative strategy is constructed.
In the strategy, we set TP (Take Profit) as the profit required to close the profit, and SL (Stop Loss) to meet the conditions to close the loss.
(I) Strategy 1
1. Opening conditions
When the above long-short pressure index conditions are met (parameters are omitted), the position is 0 and the account equity accounts for more than 70% of the account balance before opening a position in the corresponding contract. Build up to Q contracts.
2. Closing conditions
When the profit reaches the TP value + the market price fee, the profit is closed; when the loss is slightly greater than the SL value, the stop loss is closed. The calculation of the market price handling fee shall include all market price handling fees for opening and closing positions.
(Two) strategy 2
According to our other article on Golden Finance [3] -"The application of Paiclub-10 index investment strategy in digital currency" (https://www.jinse.com/blockchain/419516.html), Consider the loss caused by the failure of the above long-short pressure indicator as the completion of the experimental position, and combine the ideas in the literature [1] described in the first section to build a strategy.
1. For test positions
(1) Conditions for opening positions
When the above long-short pressure indicator conditions are met (parameters are omitted), the position is 0 and the account equity accounts for more than 70% of the account balance, the position is opened in the corresponding contract. Build up to Q contracts.
(2) Closing conditions
When the profit reaches the TP value + the market price fee, the profit is closed.
2. For official positions
(1) Opening conditions:
① A position can be opened only when the above-mentioned long and short pressure index conditions are met (parameters are omitted).
② A position can be opened only if the position is greater than or equal to the test position and is not greater than Q_total contracts.
③ Compare the average price of a position with the price of buy 1 sell 1 to check whether the position is in a loss state. If it is at a loss stage, gradually open a position according to a certain price gradient near the average position price. The number of open positions is increasing according to the price gradient.
④ (Position in the direction of opening a position-position in the other direction) <= Q_total * a% in order to open a position.
⑤ Only when the account's net value accounts for more than 70% of the account balance can a position be opened.
(2) Closing conditions
① When a position is profitable and the position amount is greater than the position amount of another contract, the position can be closed.
② Each time a position is closed, only the amount of successful opening of the previous position is closed.
This way of closing positions can ensure that the positions of the account are always in a certain hedging state.
(3) Conditions for closing all positions
When the position is normally opened, if the unrealized profit of the entire futures transaction is greater than 10 times the TP value and can offset the market price handling fee, and the difference between the sell 1 and buy 1 price of the two contracts is small, all the positions of the two contracts are closed.
4. Evaluation of strategies [4]-[5]
Due to space limitations, this article only uses Sharpe ratio to introduce the evaluation of the above two strategies.
(1) Introduction to Sharpe Ratio
Because of its computational simplicity and ease of use, Sharpe Ratio has become one of the most commonly used standardized indicators used by many financial institutions and investors to measure portfolio performance.
The Sharpe ratio is based on the Capital Asset Pricing Model (CAPM) and the Capital Market Line (CML) as the basis for evaluation. If the Sharpe ratio of the portfolio is greater than the Sharpe ratio of the market benchmark portfolio, then the portfolio is above CML and performs better than the market; otherwise, if the Sharpe ratio of the portfolio is smaller than the Sharpe ratio of the market benchmark portfolio, the portfolio Just below CML, its performance is worse than the market.
Taking financial commodity X as an example, its Sharpe ratio can be calculated as follows:
(Sharp ratio of X) = [(return of X)-(risk-free rate of return)] ÷ (risk of X)
Generally speaking, the Sharpe ratio is a score, the numerator is an evaluation of returns, and the denominator is an evaluation of risks. Among them, the return of X refers to the expected rate of return of financial commodity X during the period under review, and the risk-free rate of return refers to the risk-free rate of return during the period under review, which can be approximated by the rate of return of government bonds during the period under review. Therefore, the larger the numerator (return), the larger the Sharpe ratio, and the smaller the denominator (risk), the larger the Sharpe ratio.
Let's analyze the meaning of this formula. First, the benchmark for yields minus government bonds is because government bonds are the safest interest-bearing asset that anyone can buy. It can be said that the higher than the interest rate is the value of general financial assets. Treasury bonds are the country's borrowing vouchers. The country is obviously less likely to go bankrupt than a company, so it is a financial asset with low risk.
Second, how is X's risk expressed? The standard deviation (SD) of stock returns is called the volatility, which represents the "risk" of stock trading. It shows that for stocks with a large SD, it is normal for the yield to fall by 1 SD from the average. It should be recognized that this "dangerous" (risk) exists. Dividing the higher interest rate than the national debt by the risk (SD) is because financial products with high risk at the same return will be judged as products with poor performance.
(B) the main defects of the Sharpe ratio
First, the Sharpe ratio cannot quantify the increase in value, if any, it is just a ranking criterion. The Sharpe ratio assumes a constant risk-free rate, and uses the same risk-free rate for both loans and borrowings. However, when calculating the Sharpe ratio, the choice of the risk-free rate is very important because it affects the ranking, although the impact of the risk-free rate is quite weak.
Second, the Sharpe ratio is an absolute measure and does not involve benchmarks of performance comparison. In addition, because the Sharpe ratio measures total risk, it is suitable for investors who invest in only one type of portfolio. In the case of portfolio aggregation (that is, in the case of multiple portfolios), the calculation of the Sharpe ratio is not very simple due to the covariance effect between volatility and may lose application value.
Third, the larger the Sharpe ratio, the better the portfolio's performance. When the Sharpe ratio is negative, its interpretation ability becomes very difficult. If the risk increases, so does the Sharpe ratio. Portfolio evaluation results are easily misleading.
Fourth, the Sharpe ratio is based on the mean square error theory, so it requires that the return on assets is normally distributed or quadratic preference and that the investor has a utility function. If the risk of an asset can be fully measured by standard deviation, the Sharpe ratio is a useful indicator of portfolio performance. If the return on assets is not normally distributed, then the Sharpe ratio may lead to erroneous conclusions and undesirable paradoxes. The point of contention for the Sharpe ratio indicator is the expectation of return and the assumption of variance.
Fifth, and very importantly, the Sharpe ratio is the most vulnerable to manipulation or manipulation. The main artificial manipulation or handling of the Sharpe ratio includes the sale of upside potential assets, thereby creating a high left-tailed risk distribution yield. In this way, the result of using Sharpe ratio to evaluate the performance of the portfolio will lose its significance.
Many scholars have adjusted the Sharpe ratio statistically, but most of its limitations and problems still exist and cannot be solved perfectly, which explains why there are many versions of the Sharpe ratio at present. But before a better evaluation index is put forward, it may be a theoretical explanation of portfolio performance in a general sense.
(Three) use Sharpe ratio to evaluate two strategies
Due to the short test time of the strategy, the daily risk-free rate of return is 0.00016. Take the average daily rate of return of strategy 1 in the last week as 0.00056, standard deviation of 0.00095, the average daily rate of return for strategy 2 as 0.00059 and standard deviation of 0.00041 as examples. The Sharpe ratios of Strategy 1 and Strategy 2 are 0.737 and 1.049 respectively, so Strategy 2 is better than Strategy 1.
V. Conclusion and discussion
In this paper, two quantitative trading strategies are designed. In order to improve efficiency, Websocket is used on the Deribit exchange for all operations such as market acquisition and order. Among them, Strategy 2 adds elements of experimental positions and hedging on the basis of Strategy 1, and evaluates these two strategies using Sharpe ratio. It is found that Strategy 2 is superior to Strategy 1, so the modification here is meaningful.
The testing time of these two strategies is short, and the detailed design of the hedging is not detailed enough, and the changes in the premium / discount spread of different futures contracts have not been considered, and may not be applicable to subsequent prices. Considering that the halving of Bitcoin may cause frequent fluctuations in the price of the currency, in actual applications, risk control should be strengthened, coordinated operation with other indicators, and flexible adjustments to positions based on market conditions.
references
[1] Taro Lin. Technology of futures market. Frequent translation by Mao Lan. Beijing: Earthquake Publishing House, 2017. 62-119
[2] Su Wenjie. Paike International Investment (Group) Co., Ltd. Long-short pressure analysis of BTC spot——Liquidity measurement of limit orders and market orders. Golden Finance. Https://www.jinse.com/blockchain/ 464819.html
[3] Mayer. Paike International Investment (Group) Co., Ltd. Application of Paiclub-10 Index Investment Strategy in Digital Currency. Golden Finance. Https://www.jinse.com/blockchain/419516.html
[4] Ding Tingdong, Li Fujun. Review of Sharp Ratio of Classical Indicators. Modern Business, 2011, (17): 27-28
[5] Kojima Koji. The minimal statistics you must love to read: If you keep it simple, it will not be statistics. Translated by Kong Kun. Beijing: Taihai Publishing House, 2015. 57-60
We will continue to update Blocking; if you have any questions or suggestions, please contact us!
Was this article helpful?
93 out of 132 found this helpful
Related articles
- What else can Bitcoin bring us if we can't hedge?
- Story | From the eyes of others, I know Bitcoin
- BTC plunges again: during the avalanche, every snowflake adds leverage
- Will Bitcoin halved in price, plunge again?
- Bitcoin Secret History: Who is Cobra who wants to change the Bitcoin white paper and consensus algorithm?
- Why did Bitcoin fall below $ 5,000? Will it rebound? What about miners?
- The tragic world under the epidemic, who is the next safe haven myth?


