Bitcoin has gone to the mid-term long-short watershed. Can there be a positive finger next?
Bitcoin has been rising and rising again, breaking 5,600, testing 6000, testing 6100, breaking 6200, and breaking 6300.
But what about other mainstream currencies? Silently watching Bitcoin perform alone, from time to time to down and eat a grass! A look of embarrassment, do not know what happened in this market, look around, weakly ask: What have we missed?
This may be the state of the recent currency circle!
[Yesterday market review]
- Venezuela and lifesaver cryptocurrency in political turmoil
- May 10 madman market analysis: circle, a beautiful bubble, will break sooner or later~
- Bitcoin broke through $6,300, and the encryption market hit another 19-year high
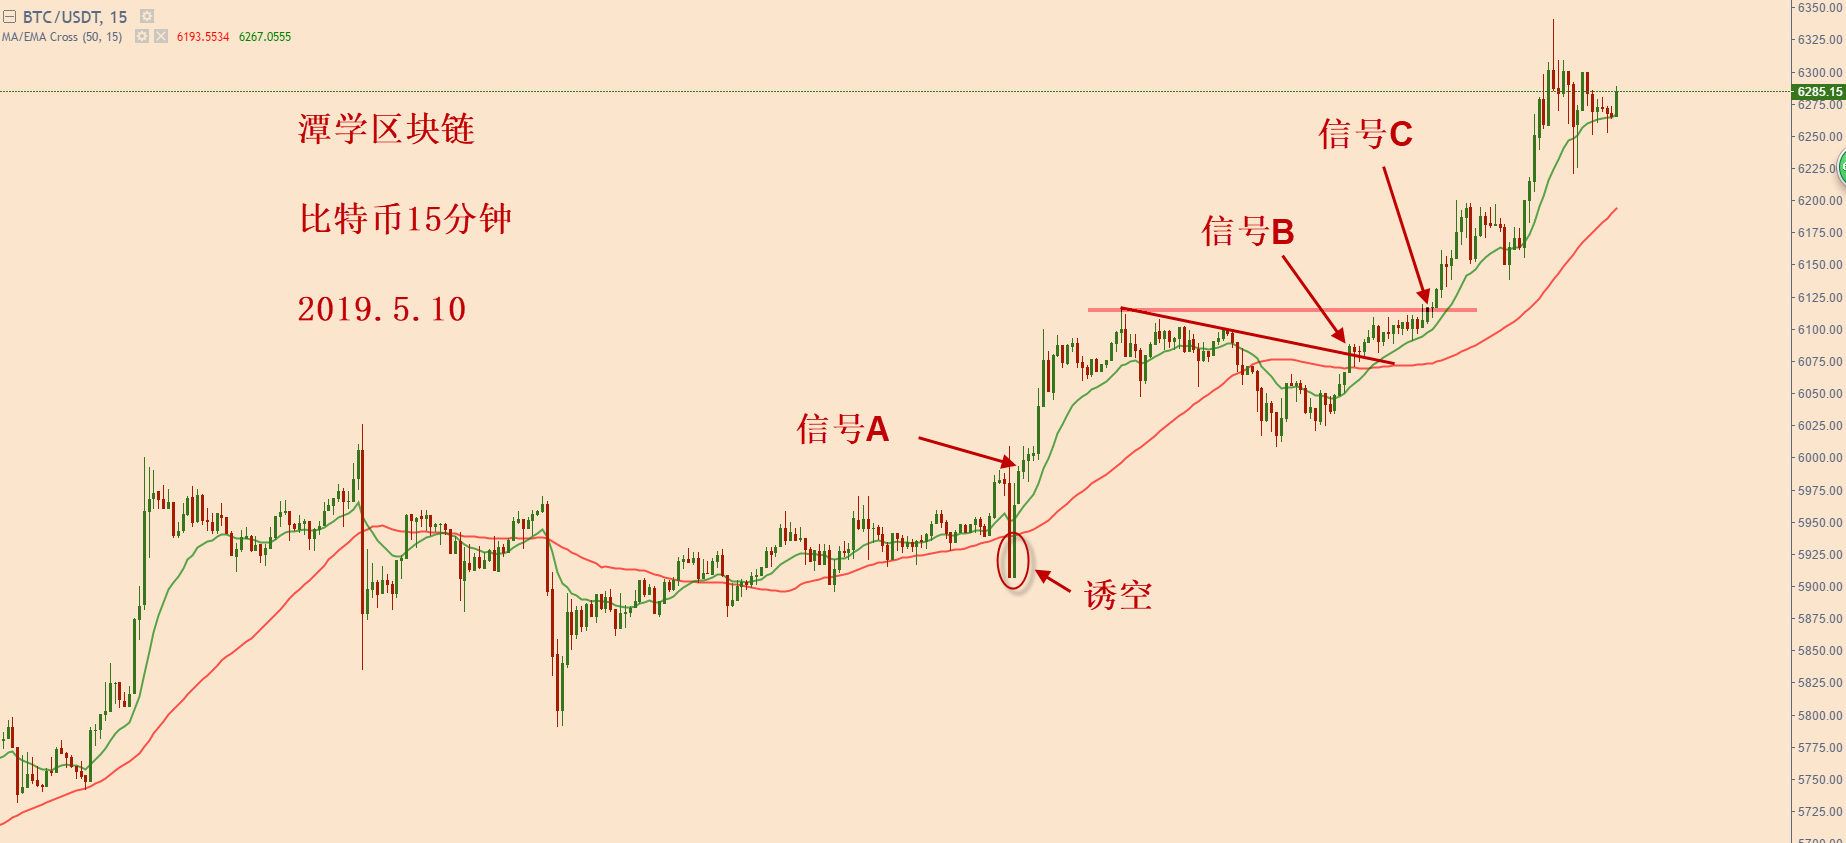
The strong will be stronger, Bitcoin will continue to surge in the past two days, there are three signals: A, B, C.
Signal A is the last trapping action before the rise. When it is up, it is an entry point.
Signal B is the signal that the downtrend line is broken upwards, and signal C is the signal on which the horizontal pressure bit is placed.
Of course, this kind of signal does not work every time. Only in the trend market, the effect will be maximized; if it is shock, it will greatly reduce its effect; only judge that this is the trend market, it is the best use. Time point.
[market analysis]
Bitcoin weekly chart
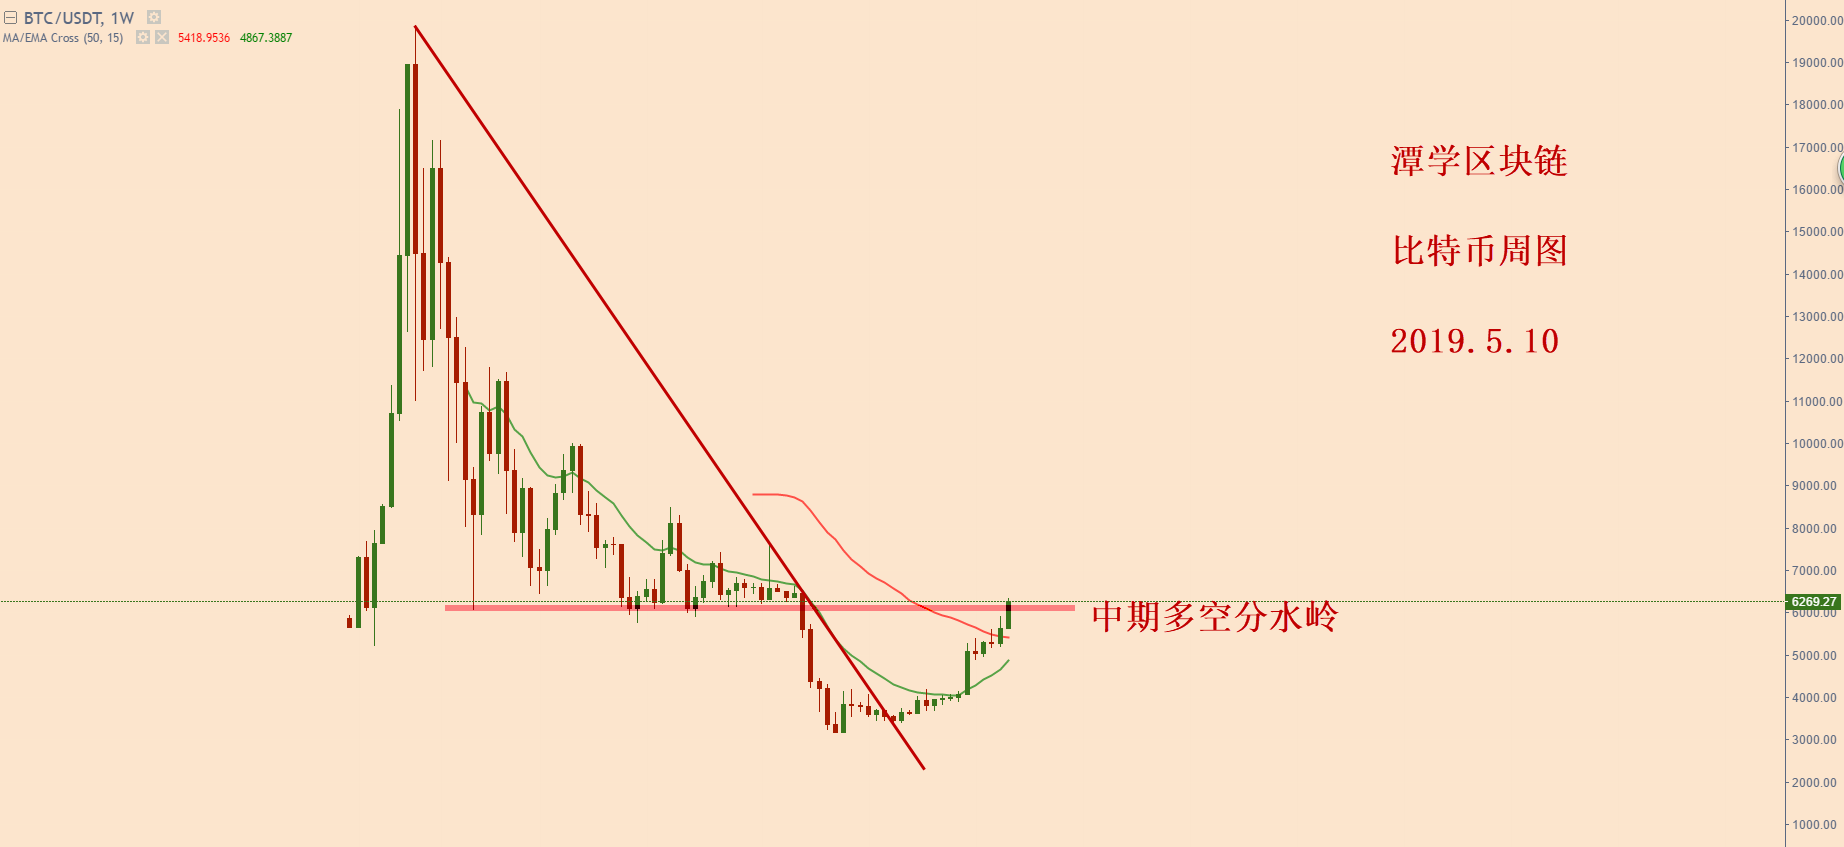
Bitcoin testing has been repeatedly tested before the fall of 2018, and now is a pressure on Bitcoin to continue to rise!
This pressure zone can be said to be the mid-term long-short watershed of Bitcoin. Let's take a look at the other mainstream currencies, and they have already rushed to the top of their long and short watersheds, and even ran to the top.
This time, we seem to understand what: the other mainstream coins rushed to the mid-term long and short watershed, but the funds seem to be exhausted, so we had to maintain the original position up and down shock; waiting for the coin king to speak. As long as the king of the coin said: rush! And take the lead in standing on the long and short watershed, then other mainstream currencies will continue to rise!
If the coin king said: Take a break for a while, then other mainstream currencies will face a downward callback!
Bitcoin sky map
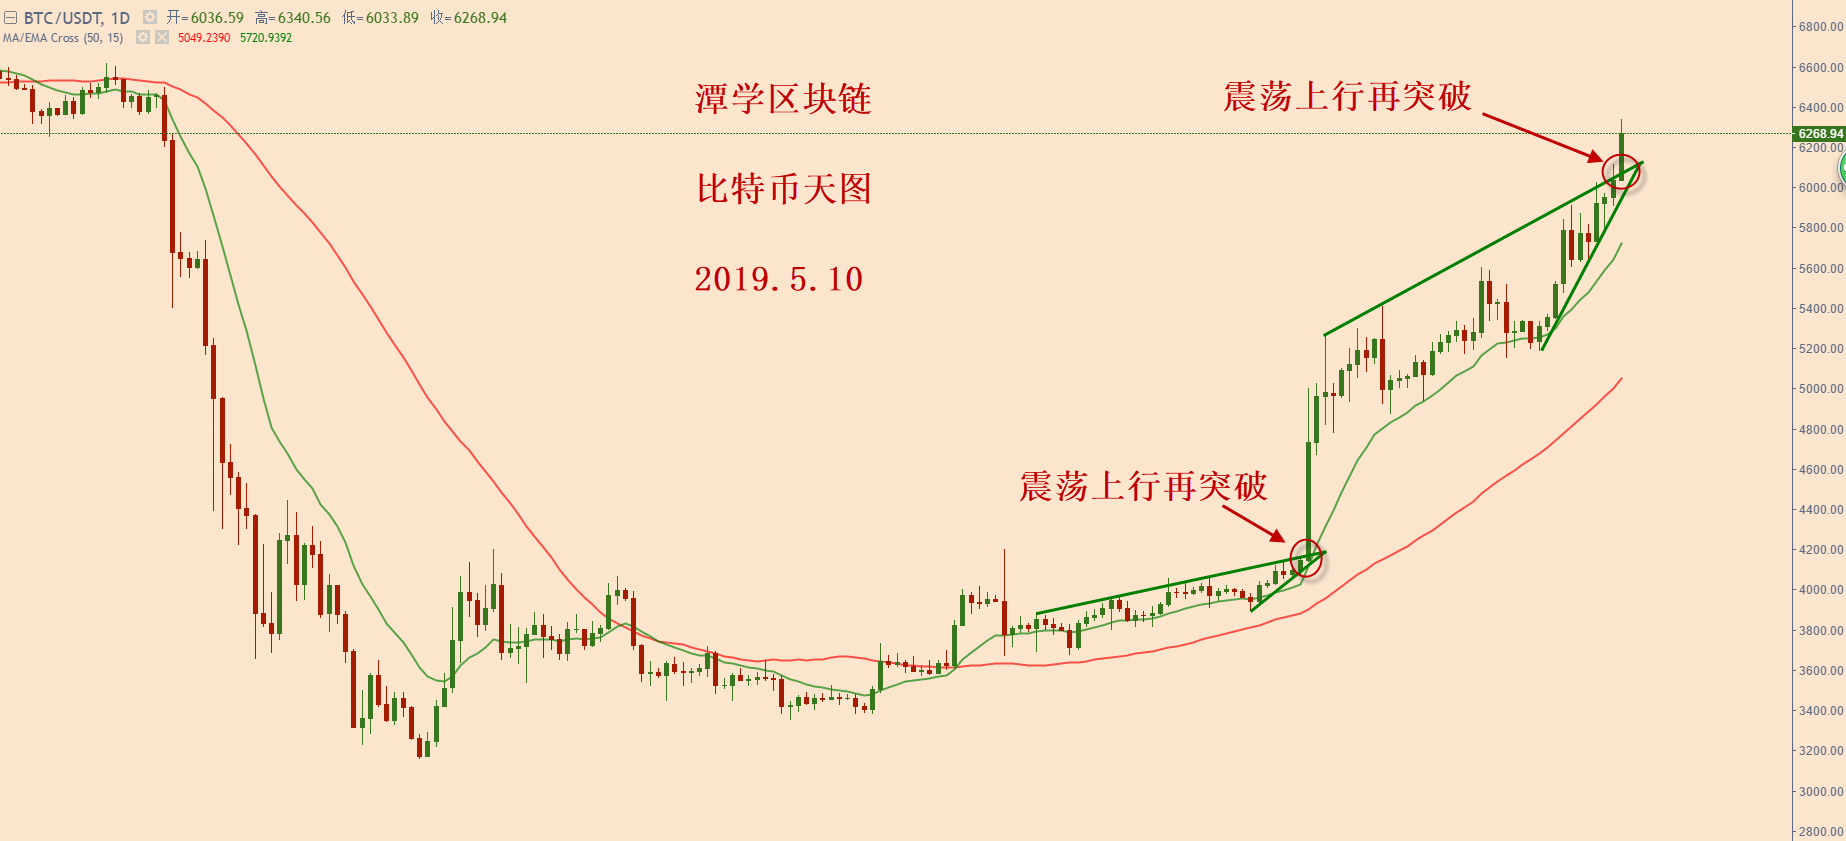
The character of Bitcoin in the last half of the year is the shock up, and then there is a top divergence; after the top turn back again and again, then break through and accelerate! Fully ignore the hints of the indicator!
Bitcoin for four hours
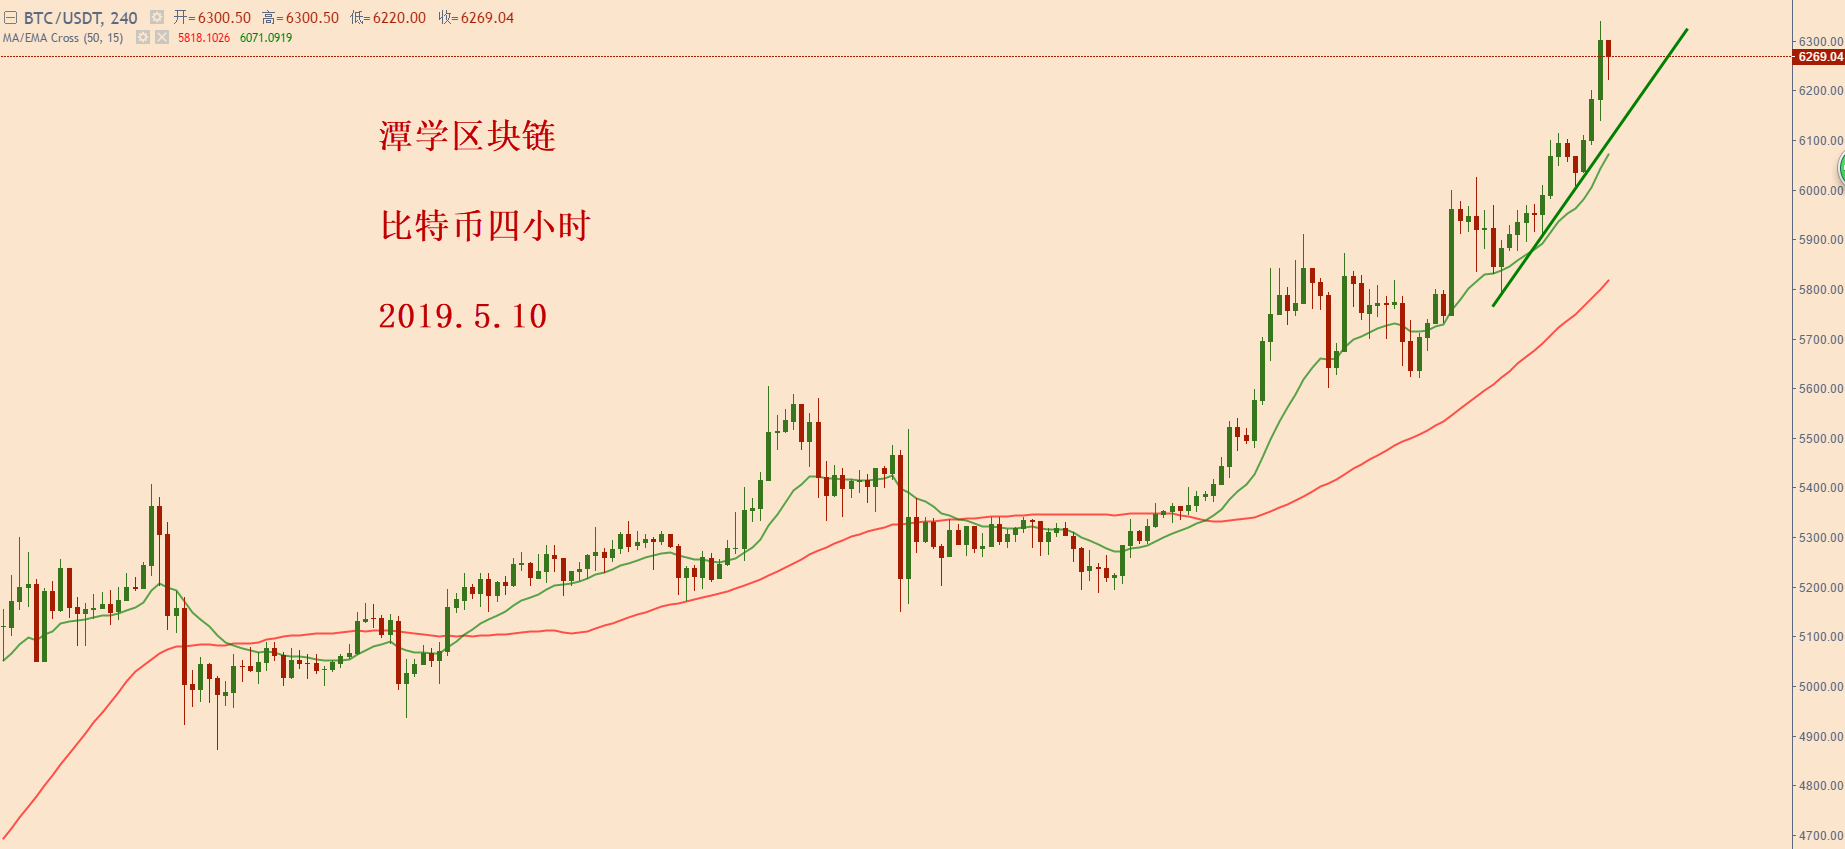
After four hours of standing up to the 5340 short-term long-short watershed in early May, the moving average has been in a long position. In the case of long-term moving averages, if you look at the pure-tech point of view: the long-term moving averages, you will follow the bulls until you reach the moving average. And the uptrend line has remained intact, even if you think the uptrend is over, don't easily guess the bearish.
In summary, Bitcoin faces the selection of the medium-term long-short watershed in the weekly chart and reaches an important level of pressure, but the short-term bullish trend is still not broken, and the possibility of continuing upward shocks still exists. This long-term can only be seen as a younger brother watching the big brother's performance, so if you have a long position, you can continue to hold it, and use the uptrend line to break down as a signal to leave the market; if you don't have a long position, sit on the side and look at the bitcoin's positive index. Can it work?
Other mainstream currencies are waiting to see for the time being!
Article source: Tan Xue blockchain (public number)
We will continue to update Blocking; if you have any questions or suggestions, please contact us!
Was this article helpful?
93 out of 132 found this helpful
Related articles
- ISF Executive Director: Blockchain is still immature and unforeseen security issues may arise
- Disintegrating the power mechanism of the United States? Listen to this US lawmaker how to attack Bitcoin.
- Are private banks ready to accept cryptocurrency investments?
- The truth of Venezuela: Bitcoin can't save Venezuela
- Principal Valuation Exploration: BTC Value Interval Estimation Based on Value Reserve Valuation Method
- Bitcoin prequel: came into being, breaking the 2008 financial crisis
- Can you make money in the cryptocurrency market by means of news?


