Bitcoin price analysis on April 10

Key points
Bitcoin prices are slowly climbing towards $5,300 and $5,360.
Bitcoin prices are slowly rising and may rise above $5,360.
- How low is the proportion of people investing in Bitcoin in Russia? Only 2%
- April 10 madman market analysis: choose Chinese life or American life depends on human ecology
- Bo silly game restarts: Will Bitcoin hit another $20,000?
On the hourly price chart, the important uptrend channel highlighted yesterday was complete with support at $5,180.
Trading will still support the decline, and may rise to a new high of 2019 above $5,360.
Bitcoin price analysis
In the past trading days, Bitcoin mostly fluctuated within the range of less than $5,300. After forming a high of $5,362, the price began to be revised downward. Ethereum fell below the $5,250 support area, the last wave of the 23.6% Fibonacci retracement (from $4,896 low to $5,362 high) and the $5,200 support area. However, when it was near $5,150, buyers appeared. Bitcoin then rose above $5,150 and 100 hours SMA.
In the upside, Bitcoin broke through the 50% Fibonacci retracement of the last volatility (from a low of 4,896 to a low of $5,362). More importantly, on the hourly price chart, the important uptrend channel highlighted yesterday was complete with support at $5,180. Channel support, $5,150 and 100-hour SMA are key to the next move in the near future.
As long as the bitcoin price follows this channel, the currency price is likely to break through the $5,300 and $5,360 resistance levels. Prices are also likely to hit new highs above $5,380. The next key resistance is at $5,400, and the price rises to this level is likely to be the seller. Conversely, if the price falls below $5,150, bitcoin may fall more. The first support below $5,150 will be $5,075. Below this level, Bitcoin will likely retest the $5,000 support level.
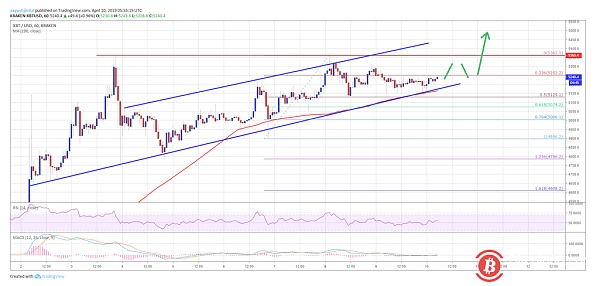
As can be seen from the chart, Bitcoin is well supported when it falls, and may break through the $5,300 and $5,360 levels. If the bulls continue to move, it is also possible that the price of the currency will rise above $5,400. On the other hand, if the price of the currency falls below $5,150 during the downturn, Bitcoin may move towards $5,000.
Technical indicator signal
MACD per hour – MACD is gradually rising in the bullish range
RS per hour – RSI is now much higher than 50, the angle is positive
Main support level – $5,150 and subsequent $5,075
Main resistance levels – $5,300, $5,360 and $5,400 above
Author: Kiran
Remarks: Bitcoin86 manuscript article, please indicate the source. The article is an independent view of the author and does not represent the standing position.
Disclaimer: This article market analysis is for reference only and does not constitute any investment advice or advice. Risk control, thank you.
We will continue to update Blocking; if you have any questions or suggestions, please contact us!
Was this article helpful?
93 out of 132 found this helpful
Related articles
- Will Bitcoin prices pull back or continue to rise?
- Ethereum price analysis on April 9
- Bitcoin price analysis on April 9
- The 2018 plunge brought us four lessons
- Why is Bitcoin possible to become digital gold? Let's talk about the network effect
- Analysis of the madman market on April 9: the market is again experiencing blood draws
- The SDT premium is over 4%. The demand in the Chinese market is rising. Is the bull market really coming?


