Bitcoin price analysis on April 9

Key points
Bitcoin is still in a steady upward trend above the $5070 and $5,000 support levels.
Bitcoin prices are falling, but they are still strongly supported above $5,000.
- The 2018 plunge brought us four lessons
- Why is Bitcoin possible to become digital gold? Let's talk about the network effect
- Analysis of the madman market on April 9: the market is again experiencing blood draws
In the hourly price chart, a key uptrend channel is being formed with support at $5,075.
The price of the currency may fall back to a few points in the direction of $5070 and then rise again in the direction of $5360.
Bitcoin price analysis
Recently, bitcoin prices have steadily increased towards $5,300. The price of the currency broke through the resistance range of $5,250, but failed to break through $5,300. In fact, at the beginning, Bitcoin formed a high of $5,359, but it was revised to below $5,250 shortly after, and fell below the last wave of the 23.6% Fibonacci retracement (from 4900). The dollar low rose to a high of $5,130). The pair even fell below the $5,200 level and tested the $5,130 level.
The last volatility of the 50% Fibonacci retracement (from a low of $4,900 to a high of $5,130) also showed a strong support level. Prices have risen above $5,250, but failed to break through $5,300. Currently, the currency price is being revised downwards towards a key bullish trend line with support at $5,150. Below the trend line, the 100-hour SMA is also around $5,100. More importantly, in the hourly price chart, a key uptrend channel is being formed with support at $5,075.
In the short term, Bitcoin may move in the direction of $5,100 and $5,075. However, buyers may protect Bitcoin from the trend line support and $5050. If the price rises, the initial resistance is at $5,250. The next key resistance is at $5,300. Above this level is the $5,360 resistance.
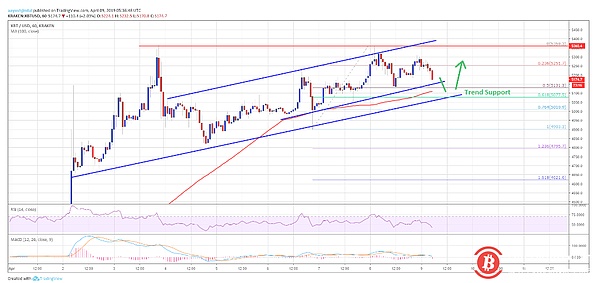
As can be seen from the chart, bitcoin prices are still steadily rising, and it is difficult for bears to push the price of bitcoin down to $5050 or less. Only after successfully closing below $5,000 will it be possible to start a sharp correction. The next key support is $4,750. If the price rises, it is only possible to rise to $5,500 by breaking through the $5,300 and $5,360 resistance levels.
Technical indicator signal
MACD per hour – MACD is moving slowly within the bearish range
RSI per hour – RSI has recently fallen and seems to be struggling around 50
Main support level – $5,100 and subsequent $5070
Main resistance levels – $5,250, $5,300 and $5,360 thereafter
Author: Kiran
Remarks: Bitcoin86 manuscript article, please indicate the source. The article is an independent view of the author and does not represent the standing position.
Disclaimer: This article market analysis is for reference only and does not constitute any investment advice or advice. Risk control, thank you.
We will continue to update Blocking; if you have any questions or suggestions, please contact us!
Was this article helpful?
93 out of 132 found this helpful
Related articles
- The SDT premium is over 4%. The demand in the Chinese market is rising. Is the bull market really coming?
- Dapp report for the first quarter of 2019, EOS performance is eye-catching, TRON growth is fierce
- Mode coin, the next "pig" that is blown to the tuyere?
- Controversy and questioning brought by Ethereum
- If the miner is dissatisfied with the BCH incentive halving, it may cause cyber security problems.
- Ethereum price analysis on April 8
- Bitcoin price analysis on April 8