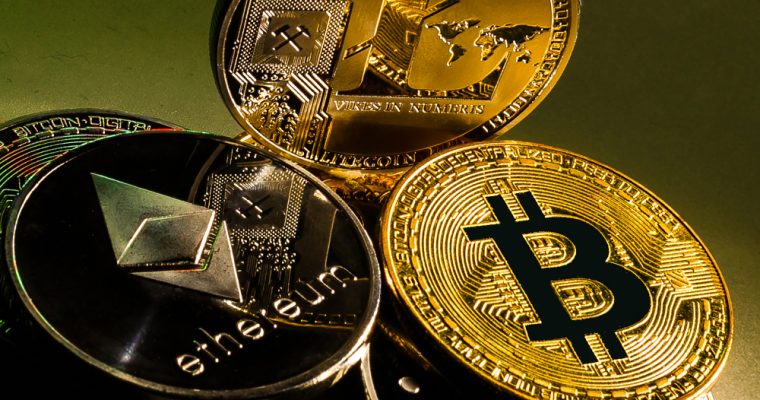
BTC chain data perspective: 78% of the whale address has no expenditure, the daily address increases 40% in half a year
After a short period of half a bear market, this year, BTC opened the cryptocurrency Mavericks market with a rising attitude. On January 1, BTC's currency price is still near 4,000 US dollars, but on 177 days after 177 days, BTC's currency price has already risen to around 14,000 US dollars, and is currently stable above 9500 US dollars, the highest increase of about 256%. It has become the best performing asset target in the world this year.
Who is the behind-the-scenes pusher of this round of bull market? The mainstream view in the market believes that the participation of large investment institutions, such as quantitative hedge funds, has pushed up the rapid rise of the current round of BTC. Then, behind the prosperity of the bull market, what is the picture of BTC's real chain data depicting a rising picture? PAData reviewed the transaction address and balance distribution on the BTC chain in the first half of the year, trying to get a glimpse.
PAData Inghts:
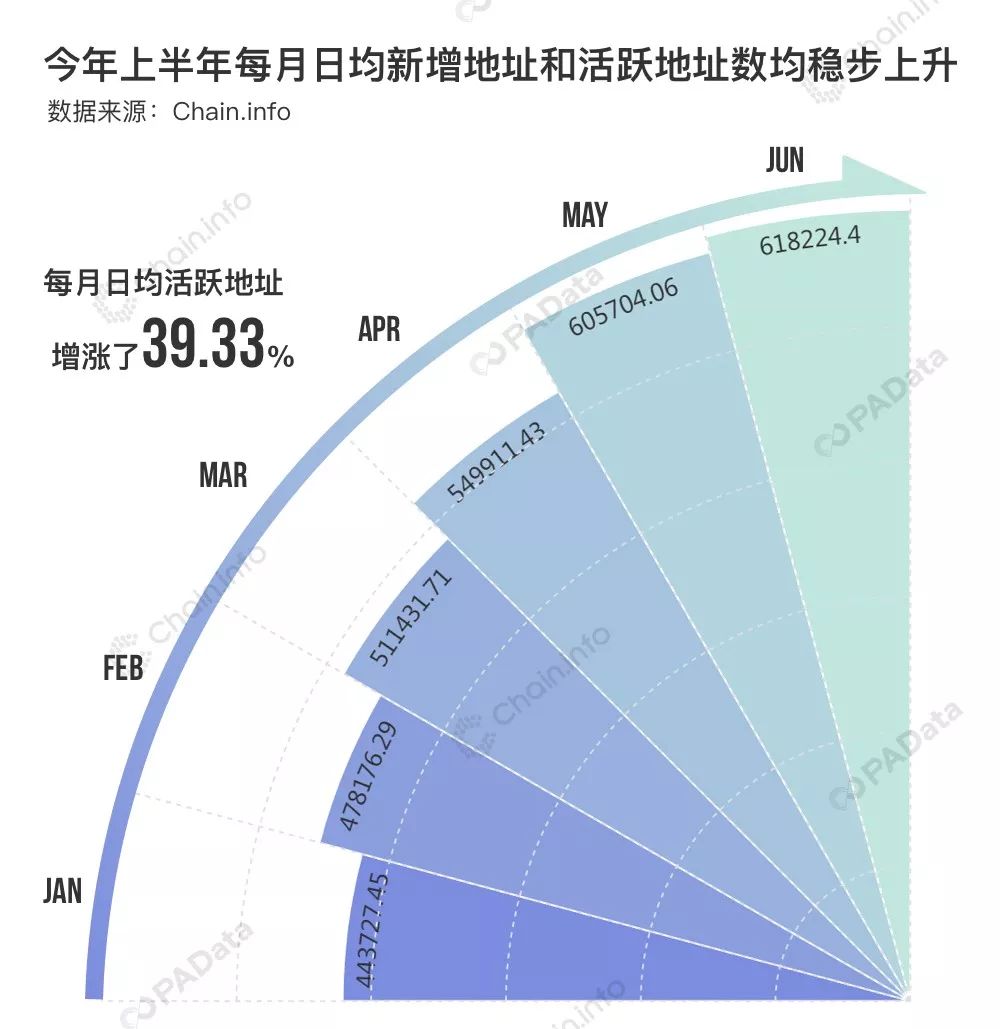
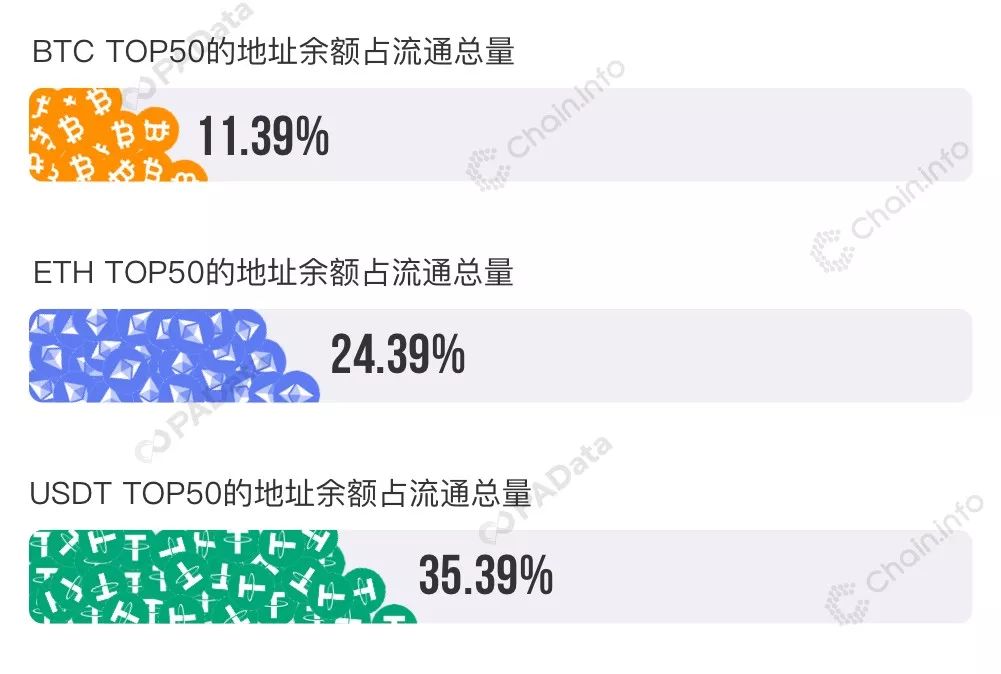
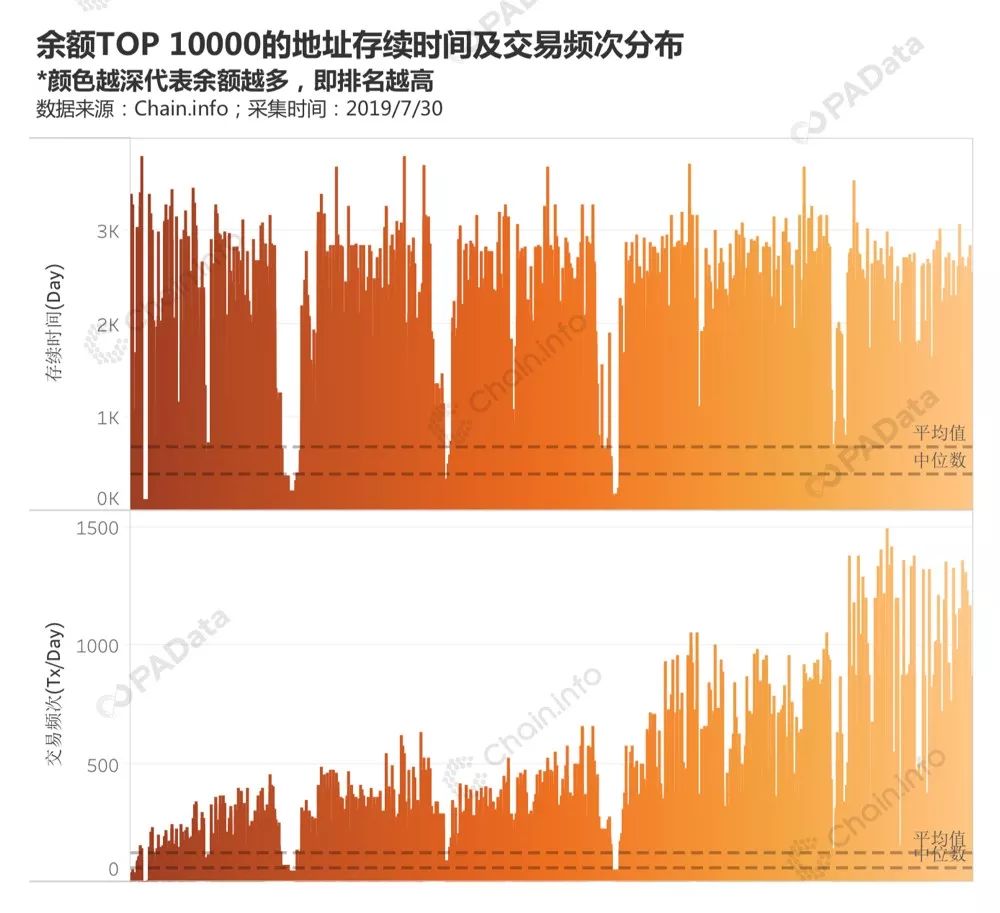
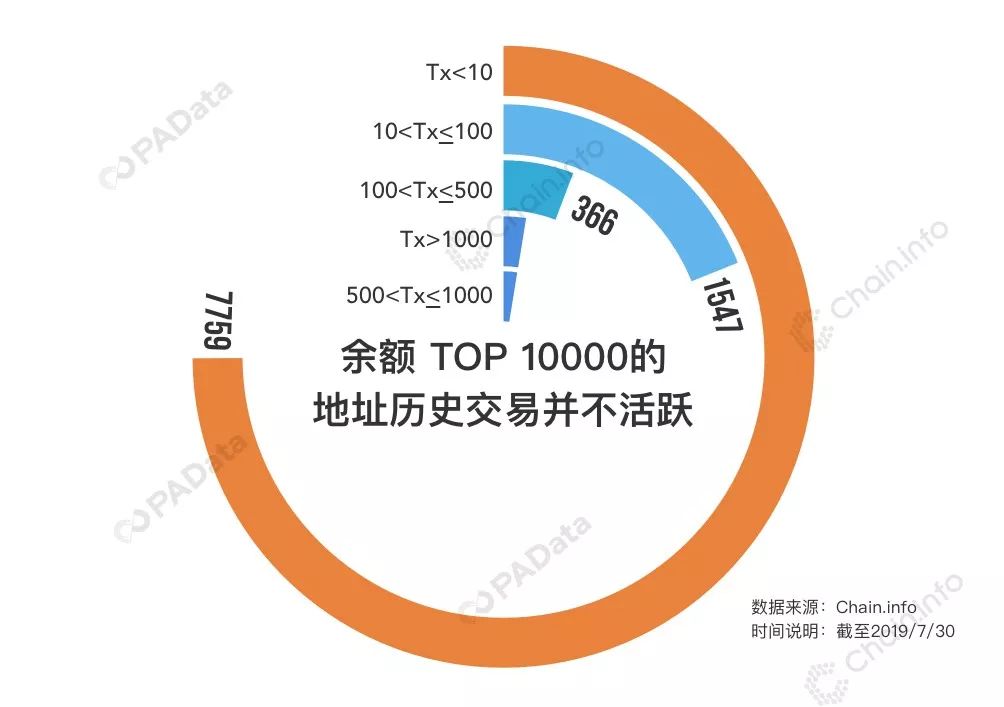
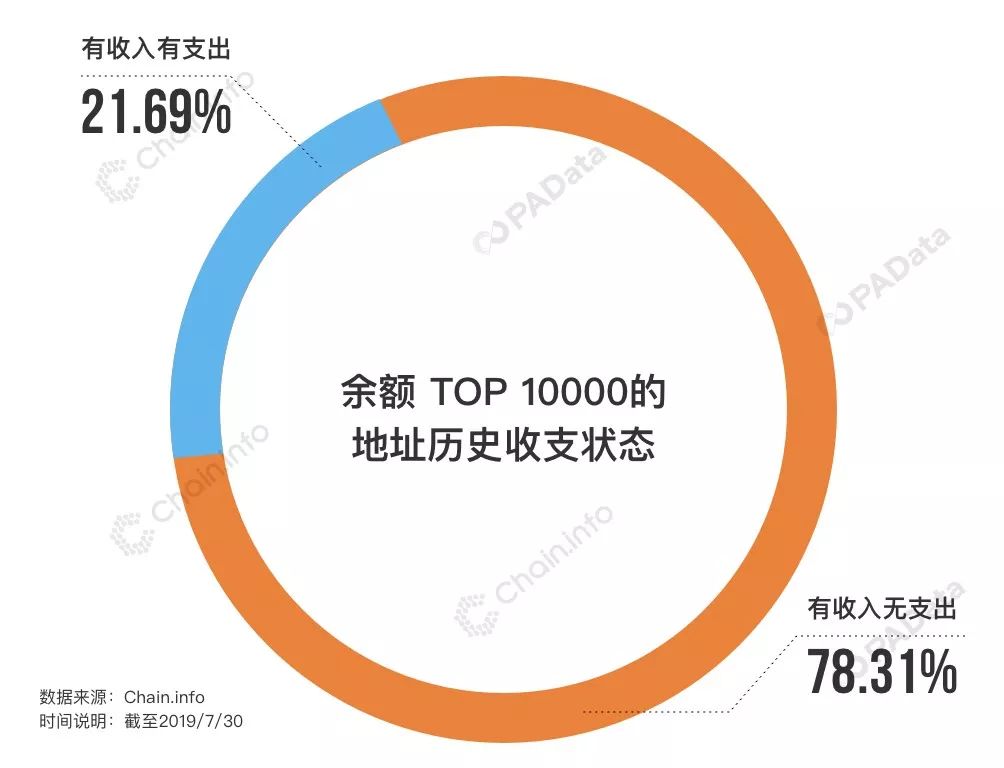
1, 50% of the BTC address balance is less than 10 US dollars, BTC chips have a tendency to converge to the "middle layer" of the tens of millions of dollars. 2. In the first half of the year, the number of new addresses and active addresses of BTC continued to increase. The average daily new address in June was about 420,200, with a monthly increase of about 31.67%. The average daily active address in June was about 816,200. 39.33%. 3. The new address and active address changes are all positively correlated with the closing price of the day. 4, the price of the currency is the factor that affects the operation of the existing holders, the daily amplitude does not affect their willingness to participate. 5. The influence between the price of the currency and the activity of the address is basically stable. The activity driven by the rise in the price of the currency will further affect the price of the currency. 6. As of July 30, the total balance of the TOP 50 address was approximately 2.03 million BTC, accounting for 11.39% of the total circulation at that time, and the concentration was lower than the ETH and USDT during the same period. 7. 50% of the whales' addresses have an average of 59 days of chain trading.
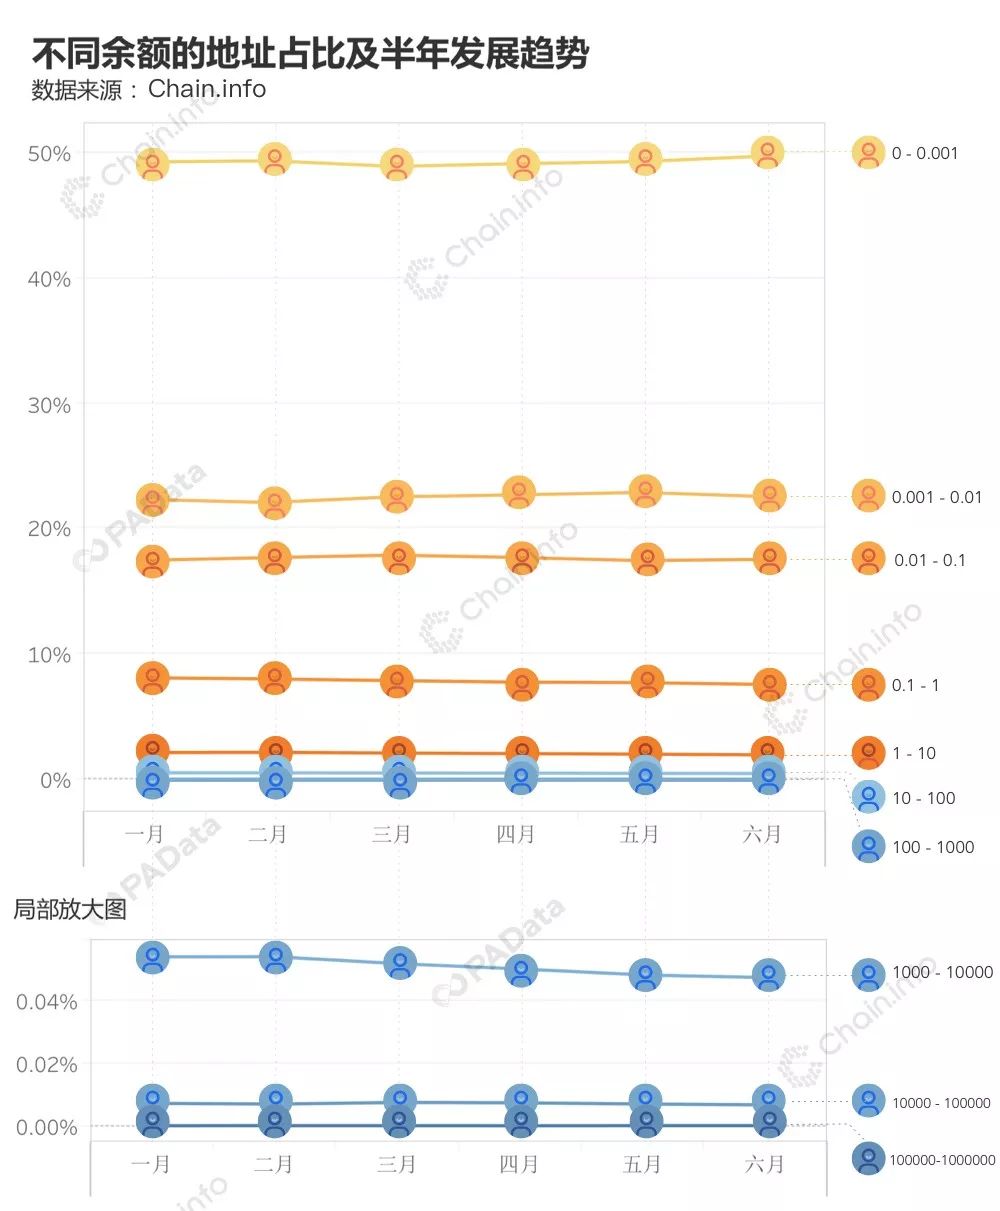
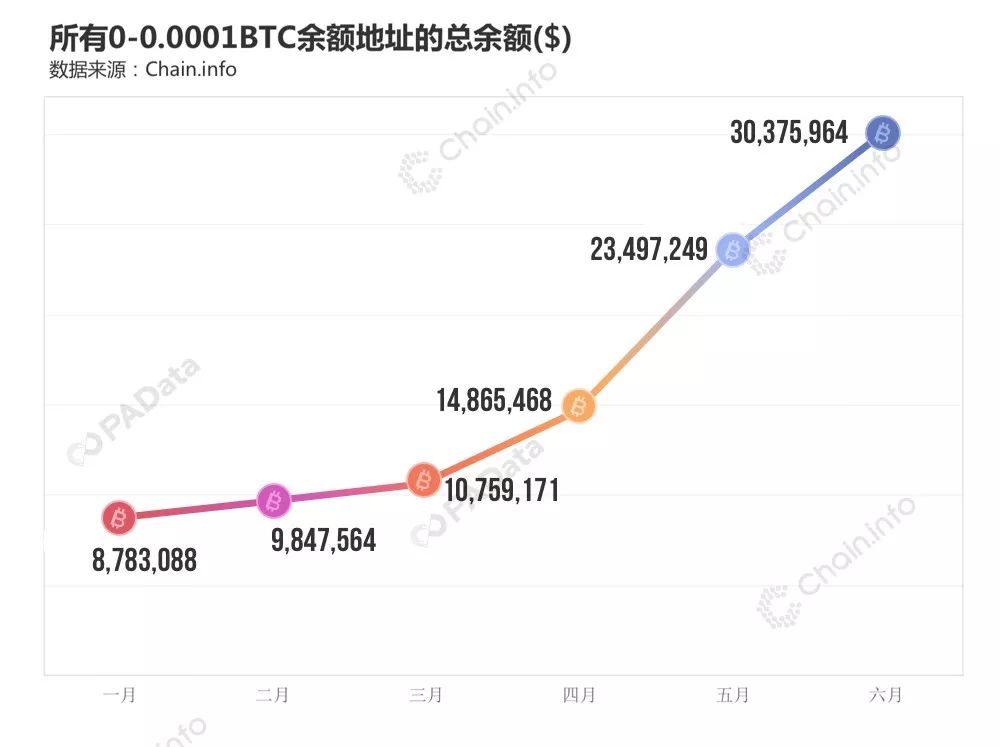
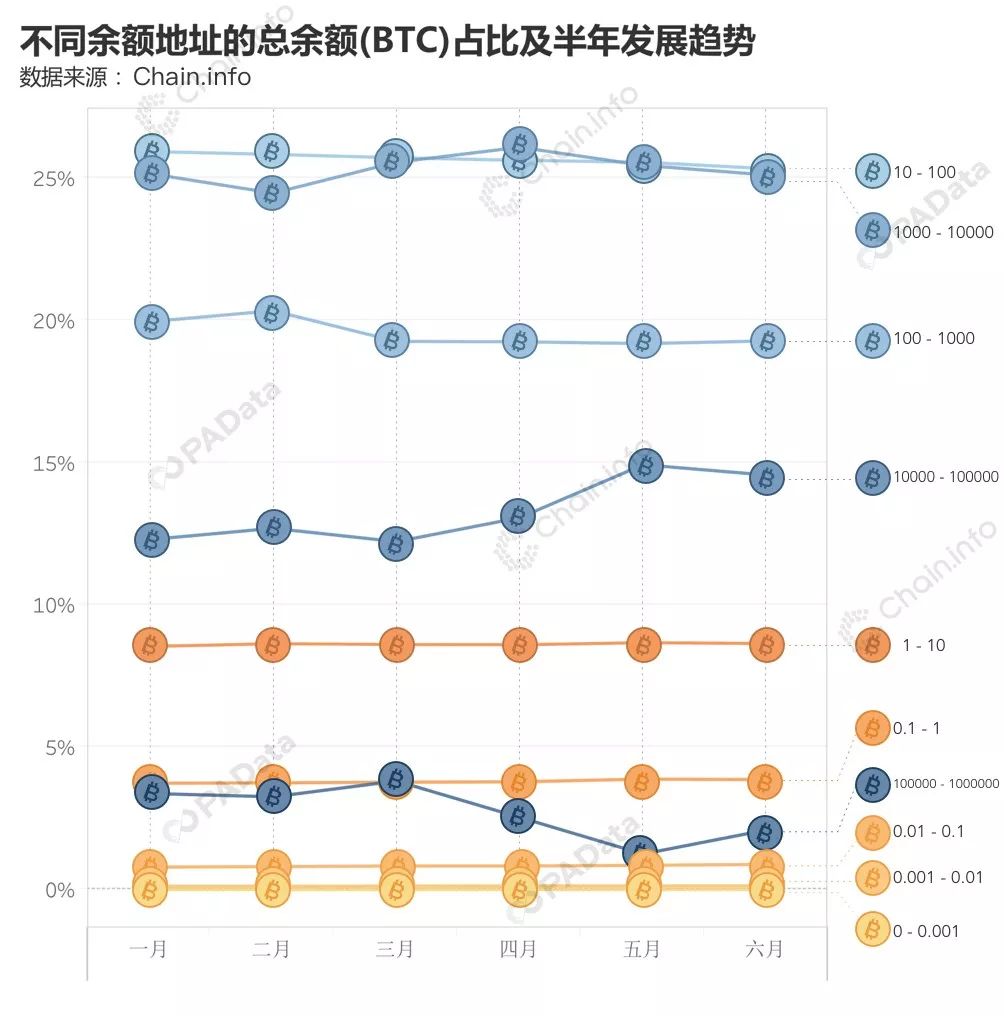
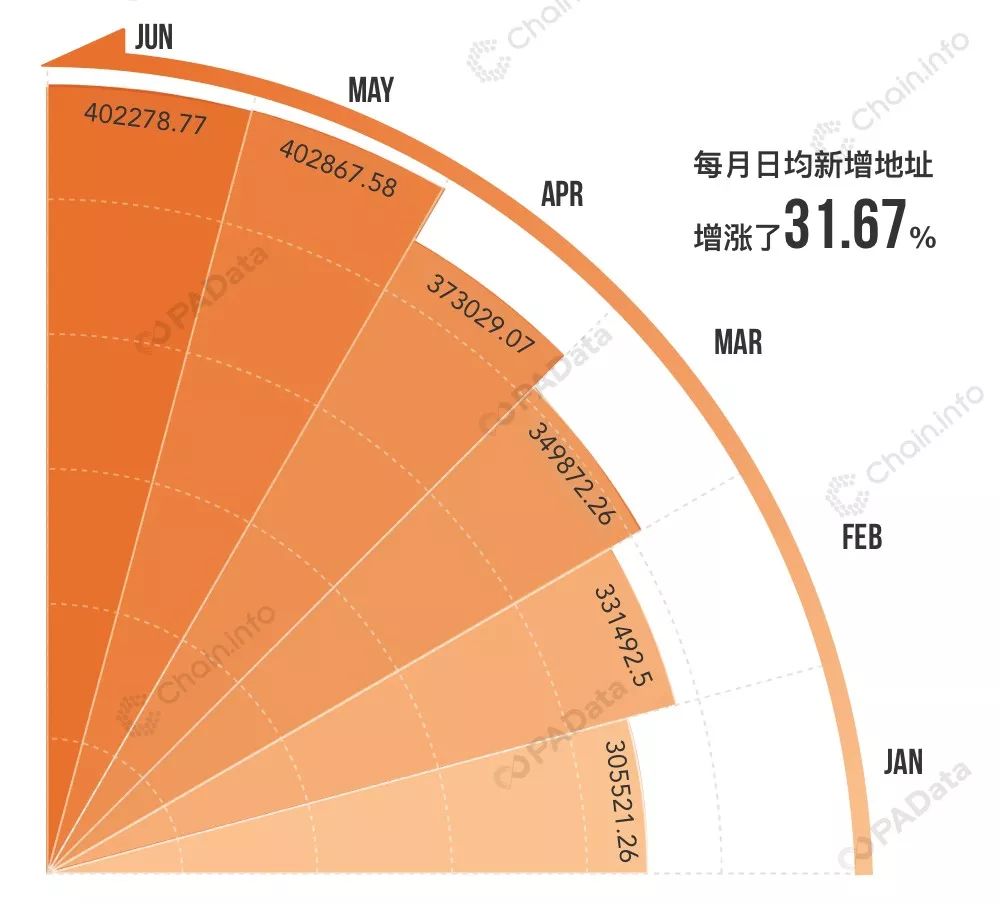
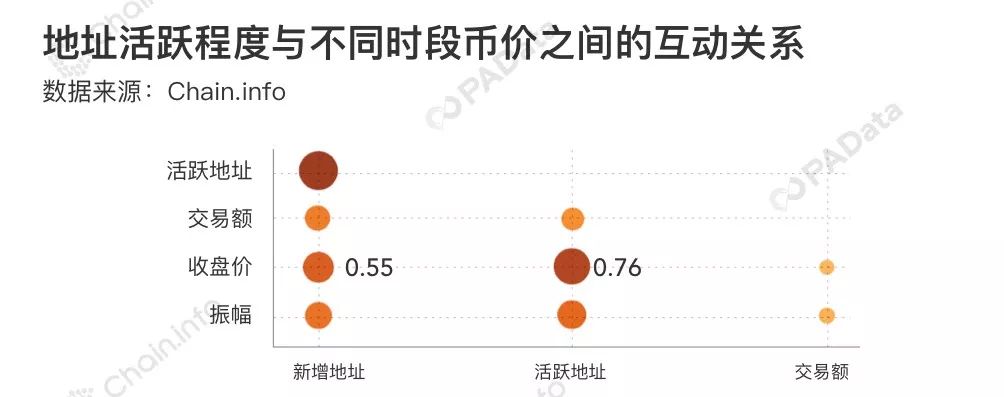
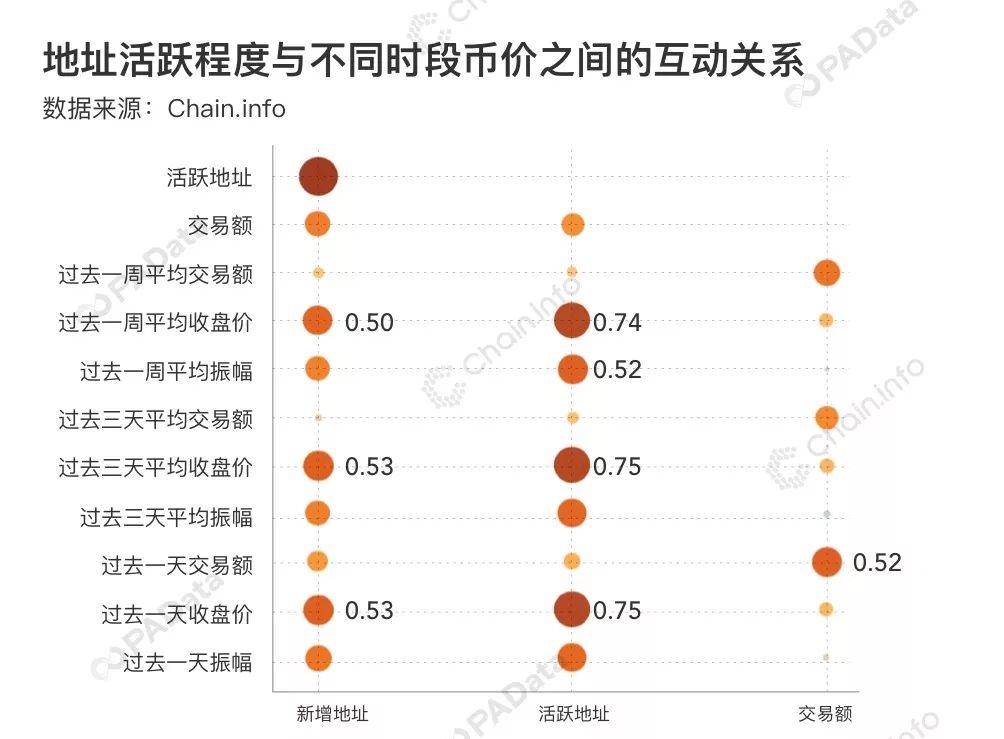
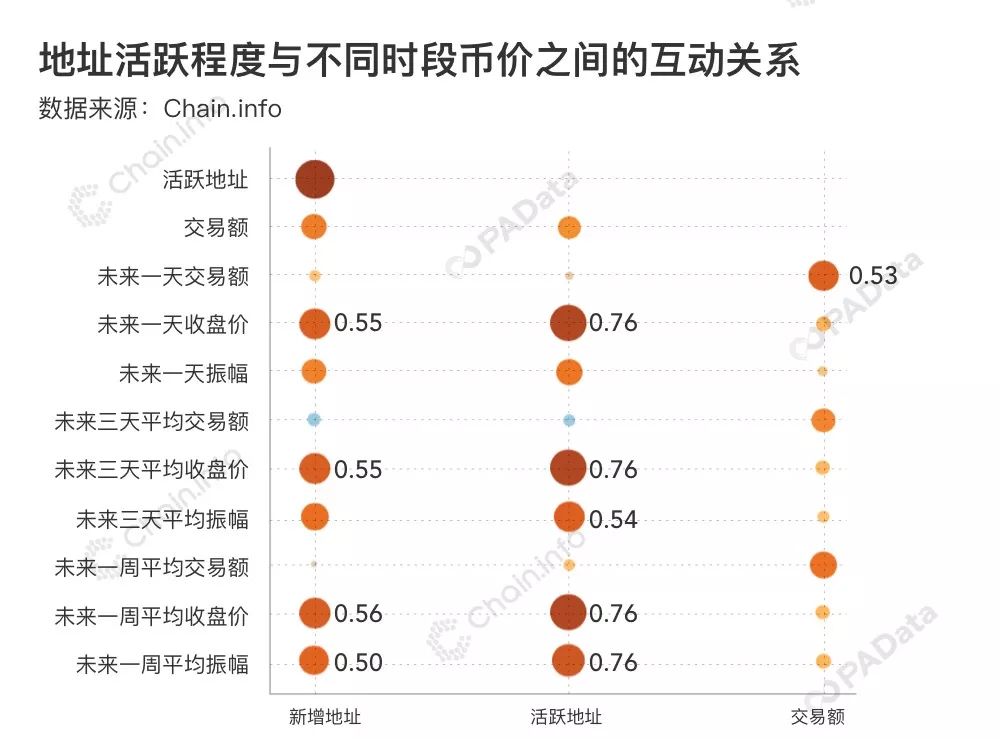
8, 78.31% of the addresses have no historical expenditure records, only historical income records.50% address balance is less than $10 to change the balance or become "dead money" According to the statistics of the Bitcoin network one-stop data service platform Chain.info, as of June 30, there were 25.9 million addresses in the BTC chain, which was 13.42% higher than that of January 30 this year. Although the increase in the total number of addresses is more obvious, the addresses of each balance level are different. If the address balance is divided into 10 orders of magnitude (currency), the order from low to high is 0-0.001, 0.001-0.01, 0.01-0.1, 0.1-1, 1-10, 10-100, 100-1000, 1000. -10000, 10000-100000, 100000-1000000, it can be found that the first three low-level addresses increased by more than the overall level in the first half of the year, reaching 14.49%, 14.62% and 13.87% respectively.The most significant increase in the chain growth rate is the address of the 10,000-100,000 balance, with a half-year increase of 21.28%. In addition, the addresses of the two orders of magnitude 100-1000 and 100000-1000000 decreased in the first half of the year, with a decrease of -0.42% and -40%, respectively. However, from the point of view of the proportion of addresses, the addresses of various magnitudes are basically stable, and the smaller the number of addresses, the higher the total number and the higher the ratio.The total number of addresses with the smallest balance of 0-0.001 is the highest , and as of June 30, it has reached about 50% of the total number of addresses. If converted at a price of 10,000 US dollars, the single address balance of this order will not exceed 10 dollars. Why are there so few addresses with so many addresses? This may be related to BTC's UTXO zeroing mechanism , because the system defaults to the zeroing balance to a new address. The reason for the change in the number of addresses is very complicated. In the first half of this year, the address of this order of magnitude increased significantly, or it was related to frequent transactions caused by the rise in the price of BTC coins. It may also be that investors split their accounts or have new investors. These suspected zero-return addresses may also raise the issue that if the address holders are sufficiently fragmented, the likelihood that the balances in those addresses will become "dead money" will increase. According to the conversion, the average balance of a single address of this order is about 0.00022 BTC, which is lower than the average transaction fee of 0.00053 BTC in the past ten years. If the individual does not hold multiple small addresses, even the transaction transaction fee is not enough. The balance may have sunk. According to the statistics of Chain.info, the balance of the address is 0-0.001BTC, and its total balance has continued to rise in the first half of the year. It has reached about 2810 BTCs on June 30, and is converted to approximately $30.37 million according to the closing price of the day.In the first half of the year, the chip distribution tends to 10 million US dollars. However, 2810 BTCs still only occupy a small proportion in the total amount. From the proportion of the total balance of each level balance address in the first half of the year, it was only about 0.016% as of June 30. Overall, the higher the level of the balance, the higher the total balance of the address. However, in the first half of this year, there are several orders of magnitude change in the total balance of the address. In April of this year, the total balance of addresses of 1000-10000 grades accounted for the total balance of addresses exceeding the 10-100 level for the first time, and became the highest-ranking address in the total. The proportion on April 30 was about 26.09%. And from the half-year trend, the total balance of 1000-10000 (converted to the equivalent of 10 million US dollars) is still rising, while the total balance of 10-100 orders There is a downward trend. If we look at the change in the total balance of the addresses of other balances, we can see that the total balance of the 100-1000 addresses is in the third place, accounting for 19.29% as of June 30, but the half-year trend is Falling form. In the first half of the year, the total balance also accounted for the downward trend of the 100000-1000000 level. As of June 30, it accounted for 2.10%, which was about 1.28 percentage points lower than that of January 30. However, the total balance of 10,000-100,000 addresses accounted for an upward trend in the first half of the year, accounting for 14.58% on June 30, an increase of about 2.27 percentage points from January 30. From the perspective of the semi-annual trend, the total balance of the balance with a balance of less than 10 has basically no change, but in addition, the BTC chip has a tendency to converge toward the middle layer (100-100000 BTC) , but it is difficult to explain that this is a small-scale balance. The result of extensive address increase or splitting of the head whale address is that the new funds are more likely to enter the "middle layer" address.New addresses and active addresses continue to increase and are weakly related to currency prices From January to May this year, BTC's monthly average new address [1] continued to increase, but it declined slightly in June. According to statistics, in January this year, the average daily address of BTC was about 305,500. The average daily new address in June was about 420,200, and the monthly increase was about 31.67%, with an average monthly increase of about 5.28%. In the first half of the year, the number of active addresses of BTC [2] also continued to increase. According to statistics, the average daily active address in January this year was about 443,700. The average daily active address in June was about 618,200, with a monthly increase of about 39.33% and an average monthly increase of 6.55%. If the new address is not included, then in the first half of this year, the monthly active address of BTC will increase by about 56.25%, with an average monthly rate of 9.37%, which is much higher than the new address. To a certain extent, this means that the old address is more active during the current round of BTC rise. But in turn, the continued increase in new and active addresses is the reason for this round of BTC soaring? PAData analyzed the relationship between the number of new addresses/active addresses [3] and the past week, the past three days, the past day, the next day, the next three days, and the currency price, amplitude, and chain transaction amount in the next week. The new address and the active address are independent of the amount of transactions on the chain in the previous week. This may be because the real-time transaction of the user on the exchange does not happen in the chain immediately, and only needs to be settled when the user withdraws the cash, which causes the decoupling of the transaction amount on the chain from the secondary market.From the dimension of the day, both the new address and the active address are slightly positively correlated with the closing price of the day, that is, the more new and active addresses on the day, the higher the closing price. By zooming in on the time dimension to the previous week, you can also observe the interaction between the new address/active address and the currency price. For example, does this round of rising prices attract more newcomers to enter or call more old users? From the price of the past week, the past three days and the past day , the closing price in the past week has a weak correlation with the number of new addresses, that is, the high price in the past week, it really attracts Some new users, but not veryattractive , are more attractive to older users . The active address that does not include the new address is more relevant to the currency price of the past week. So, do these new and active addresses have an impact on the currency price for the next week? From the correlation analysis, this effect is similar to the effect of the new address and the active address in the past week, which means that the effect between the price of the currency and the activity of the address is basically stable, and the activity driven by the rise in the price of the currency is active. Degree will further affect the price of the currency. However, it is worth noting and further observation that the effect of the number of active addresses on the amplitude of the currency price in the coming week is greater than the impact of the price amplitude of the currency on the active address in the past week , that is, these invoking investors may affect the amplitude of the next week, investment. The greater the number of people (considered to be proportional to the number of addresses), the greater the volatility of the next week.78% of the whales have no historical expenditures, and the BTC chips are more scattered. According to the statistics of Chain.info, as of July 30, the total balance of the TOP 10000 balance has reached 1030 BTC.The total balance of T OP 50 is about 2.03 million BTC, accounting for 11.39% of the total circulation at the time (17846612.5 BTC). According to Etherscan data, the total TOP 50 of ETH balance accounts for 24.39% of the total liquidity. According to the data of Rich List|Tether, the total amount of the TOP 50 of the USDT balance accounts for 35.39% of the total liquidity. From the horizontal comparison, BTC's current chip distribution is relatively scattered. The average duration of BTC's whale address is not long. The average interval between the earliest appearance and the last transaction time of TOP 10000 is about 682.79 days, which is equivalent to 1 year and 8 months.More than half of the addresses last for about 396 days, which is equivalent to 1 year and 1 month. The duration of individual addresses has been nearly nine years, and the length of the duration is not related to the balance. The trading frequency of these giant whale addresses is not high, with an average of 123 transactions occurring on the chain, and 50% of the addresses have an average of 59 days of chain trading. There are 7739 addresses with less than 10 transactions and 694 addresses with more than 100 transactions. Moreover, the more the whales are ranked lower, the less the balance, the longer the transaction frequency, and the less active. The address of the whales is not only low in transaction frequency, but many addresses have no historical expenditure records at all. According to the statistics of Chain.info, as of July 30, 78.31% of the addresses of TOP 10000 have no historical expenditure records, only historical income records. The low frequency of transactions and most of the historical expenditure records may be related to the fact that some of the whale addresses are actually cold wallets of the exchange. For example, the top four are the cold wallets of Fire, Coin, Bittrex and Bitstamp. Another possibility is that these whale addresses continue to be in the bitcoin downturn, but no further data is available to support this. the data shows: [1] New address: The number of addresses where the first transaction occurred during the day from 0:00 to 24:00. [2] Active address: The number of addresses (including the first time) in which the transaction occurred during the day from 0:00 to 24:00. [3] The active address here does not include the new address. Text and data | Carol ; Data support | Chain.info; Source | PANews.io
We will continue to update Blocking; if you have any questions or suggestions, please contact us!