Can Bitcoin be $5,500 again? Bitcoin short-term price interpretation

Bitcoin/US dollar short-term price analysis <br /> Bitcoin is bullish on short-term trading bias, and BTC/USD has made a strong upside recovery after briefly falling below the $5,000 support level.
The four-hour time frame shows that the head and shoulders pattern is forming, and the bulls need to bounce the BTC/USD exchange rate above the current annual trading high to make the bearish pattern ineffective.
- Secret history of Bitcoin mining: A miner dug up more than 1 million bitcoins in the early Patoshi model
- The trading volume of currency transactions has risen sharply, or is it welcoming the “Xiaoyangchun” in the currency market?
- Limiting the three elements of decentralized economic shaping and blockchain technology
The technical indicators for the 4-hour timeframe are bullish and underscore the growth in BTC/USD interest in short-term buying.
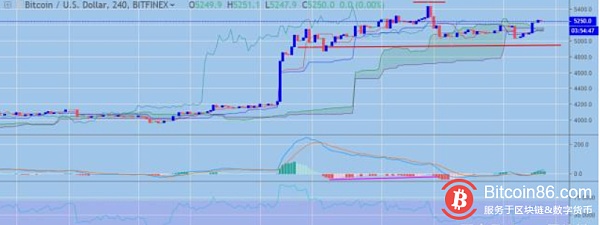
BTC / USD Quotes Chart
trend
Traders should be aware that a bearish head and shoulders pattern may trigger a strong technical reversal and return to the support level of $4,500.
Relative strength index
The relative strength index of the above time frame is bullish and highlights the bullish pressure of growth.
MACD indicator
The MACD indicator within the four-hour time frame is bullish, and the MACD signal line sends a strong buy signal.
Bitcoin/US dollar mid-term price analysis
Bitcoin is still bullish in the medium term, with the market-first cryptocurrency sticking to its key 200-day moving average.
The Ichimoku indicator on the daily time frame shows the importance of a daily closing price above the $5,200 level. If the bulls fail to close the daily candle above $5,200, they may fall to the $4,700 level.
After the recent decline in the BTC/USD exchange rate, technical indicators during the daily session attempted to recover higher.

Bitcoin market trend
trend
Traders should note that the average daily break in technical breakouts is still valid, while price trades are above the trend line to support the falling wedge pattern.
Relative strength index
After the recent decline in BTC / USD, the relative strength index of the daily time frame attempts to stabilize.
MACD indicator
The MACD indicator on the daily time frame conflicts, the MACD signal line is in the overbought area, and the MACD histogram is still tending to go down.
in conclusion
After the recent sharp drop in BTC / USD's current annual trading high, Bitcoin successfully stabilized prices above $5,200.
The bulls must continue to close the daily candle at more than $5,200 and bounce the cryptocurrency to more than $5,500 to encourage new technology buying interest and invalidate the bearish pattern within a four-hour time frame. (百家号)
We will continue to update Blocking; if you have any questions or suggestions, please contact us!
Was this article helpful?
93 out of 132 found this helpful
Related articles
- The shackles of civilization: French cryptocurrency enthusiasts call for Bitcoin donations to rebuild Notre Dame
- Romanian central bank official: cryptocurrency is a financial product that cannot play the role of money
- Ao Ben Cong has finally got into a big trouble. Do you dare to hold BSV?
- Ethereum price analysis on April 17
- Brazil trades record 100,000 bitcoins within 24 hours
- How to avoid digital currency financing scams
- Bitcoin price analysis on April 17


