Ethereum price analysis on April 17

Key points
Ethereum formed good support around $155 and rebounded well.
Ethereum gained momentum above the $162 and 10-hour SMA.
- Brazil trades record 100,000 bitcoins within 24 hours
- How to avoid digital currency financing scams
- Bitcoin price analysis on April 17
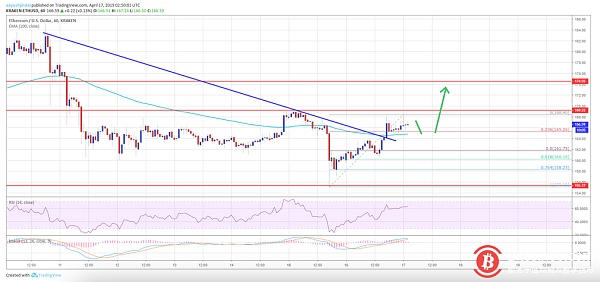
In the process of rising, Ethereum broke through the key bearish trend line highlighted yesterday, with a breakthrough level of $164.
Ethereum is accelerating to climb towards $168 and is likely to continue to climb towards $175.
Ethereum price analysis
Recently, Ethereum experienced a wave of downside corrections and fell below $160. The price of the currency even fell below $155 and is located in the 100-hour SMA. However, $155 is a very solid support level, and the price then starts to rebound after that. During the ascent, Etheree once again broke through the resistance of $160 and the last volatility of the 50% Fibonacci retracement (from a high of $170 to a low of $155).
More importantly, in the process of rising, Ethereum broke through the key bearish trend line highlighted yesterday, with a breakthrough level of $164. Soon after, it also broke through the $162 resistance, the 100-hour SMA and the 61.8% Fibonacci retracement of the last decline (from a high of $170 to a low of $155). Ethereum is close to $170 and has set a new high at $168. Currently, prices are breaking through the trend line and consolidating gains above the 100-hour SMA. The first support is at $165 and the last volatility of the 23.6% Fibonacci retracement (from a low of $155 to a high of $168).
If the price can break through $168 and $170, it will open the door for further gains. The buyer's next target may be $175, and Ethereum may encounter sellers here. If the price can break through the $170 resistance level, the price will move in the direction of $180.
As can be seen from the chart, Ethereum showed positive signs above $165 and $162. In the short term, prices may fluctuate above the $162 level. If a callback occurs, the price may test the 50% Fibonacci retracement of the last volatility (from a low of $155 to a high of $168). In the end, the price could break through $170 and test $175.
Technical indicator signal
MACD per hour – MACD rebounds to bullish range
RSI per hour – RSI rebounds to above 50, currently close to 60
Main support level – $162
Main resistance level – $170
Author: Kiran
Remarks: Bitcoin86 manuscript article, please indicate the source. The article is an independent view of the author and does not represent the standing position.
Disclaimer: This article market analysis is for reference only and does not constitute any investment advice or advice. Risk control, thank you.
We will continue to update Blocking; if you have any questions or suggestions, please contact us!
Was this article helpful?
93 out of 132 found this helpful
Related articles
- Financial experts: encryption ends in winter, bitcoin may reach $10,000 this year
- alert! BCH will fork again, and the liar is coming again!
- Foxconn links to Ethereum, or to help Ethereum open a new chapter
- Game to encrypt world power: Dragon Mother is BTC Alien is BSV
- Don't wait until Bitcoin is worth a million, you can't regret it.
- BSV suffers 51% of attack costs for only $6,500
- The Ethereum core development team considered adding a hard fork frequency and gave 4 reasons.


