Glassnode Cryptocurrency market trading volume reaches historical low, BTC is experiencing an unprecedented period of low volatility
Glassnode Crypto market trading volume at all-time low; BTC experiences unprecedented low volatility.Author: Checkmate, Glassnode
Translation: Deep Tide TechFlow
Abstract
- Bitcoin is famous for its price volatility, but the current market is experiencing extreme volatility compression.
- The futures market is noticeably stable, with trading volumes for Bitcoin and Ethereum reaching historical lows, and spot trading and arbitrage yields at 5.3%, slightly higher than risk-free rates.
- The implied volatility in the options market is undergoing significant volatility compression, with volatility premiums below half of the 2021-22 benchmark.
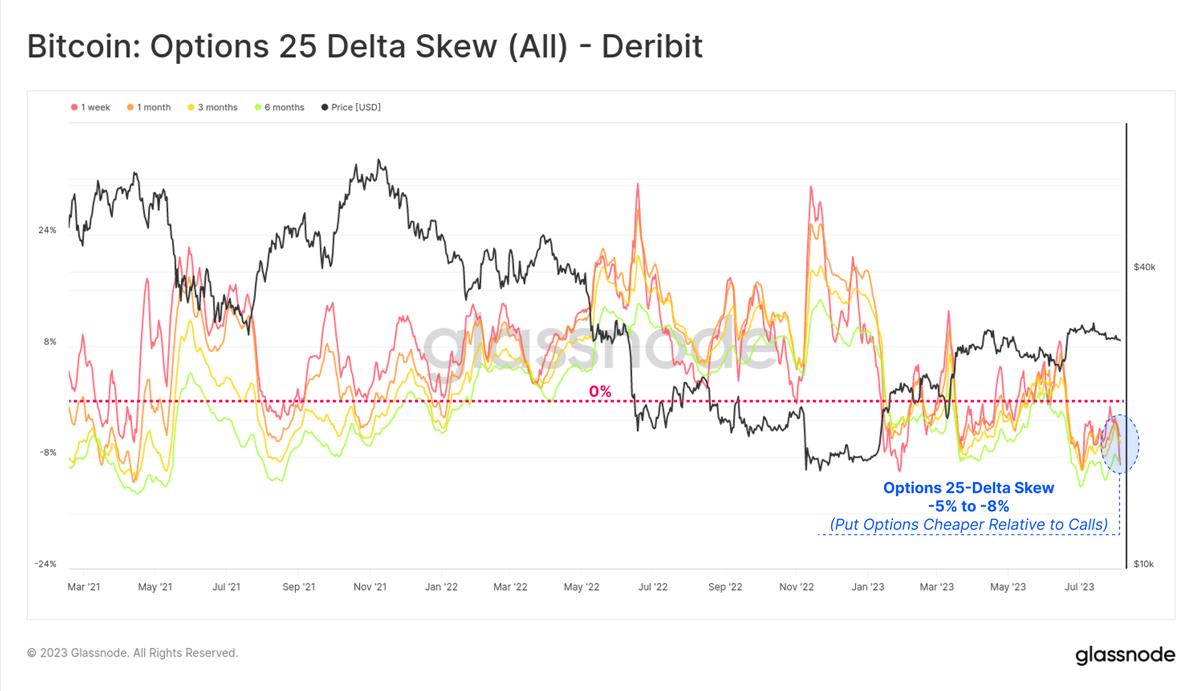
- The put/call ratio and the 25-delta skew indicator are at historical lows, indicating a bullish bias in the options market, and the pricing of put options suggests very low future volatility.
A Calm Period
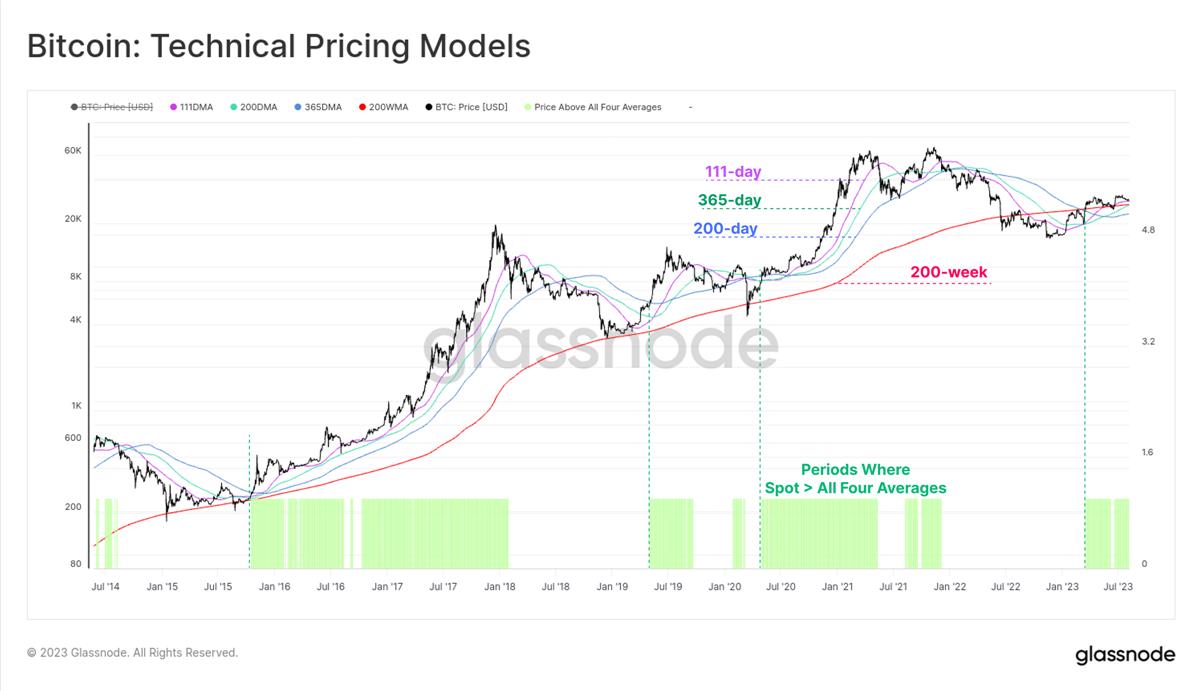
The Bitcoin market is going through a very calm period, with many volatility indicators reaching historical lows. In this article, we will explore the uniqueness of this quiet period from a historical perspective and then discuss how the derivatives market is pricing it.
Firstly, we note that the Bitcoin spot price is above some widely observed long-term moving averages in the industry (111-day, 200-day, 365-day, and 200-week). The range of these averages extends from a low of $23,300 (200DMA) to a high of $28,500 (111DMA). The chart also highlights similar periods in the past two cycles, which have often coincided with macro uptrends.
- Exploring the Optimal Voting Technology Detailed Explanation of Vota, a Special Purpose Infrastructure for Decentralized Community Governance
- LianGuai Daily | The contract address of LianGuai Stablecoin PYUSD has been announced; OpenAI has launched the web crawler GPTBot, which can automatically collect information to improve AI models.
- Building a Virtual World How to Use Blockchain Technology to Record Time for Digital Gods?
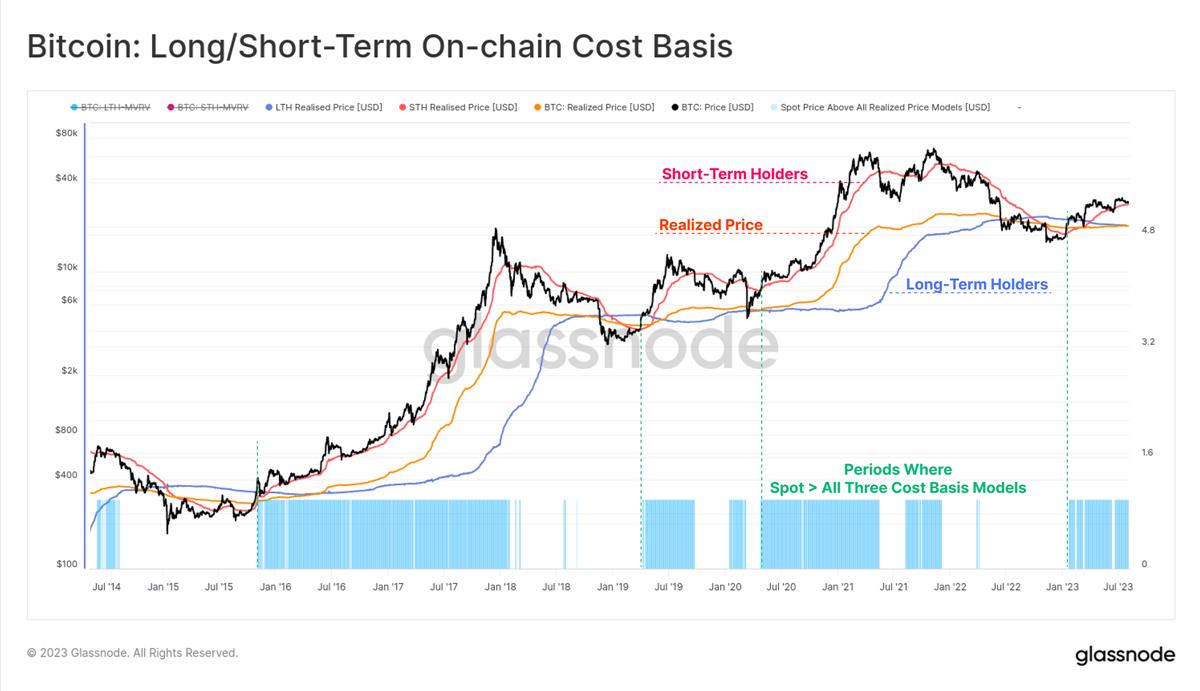
We can observe very similar situations using on-chain realized prices, which simulate the cost basis of three groups:
🟠 The entire market (actual price).
🔴 Short-term holders (coins held for less than 155 days).
🔵 Long-term holders (coins held for more than 155 days).
The spot price is once again higher than these three models and shows strong consistency with the aforementioned classical technical analysis tools.
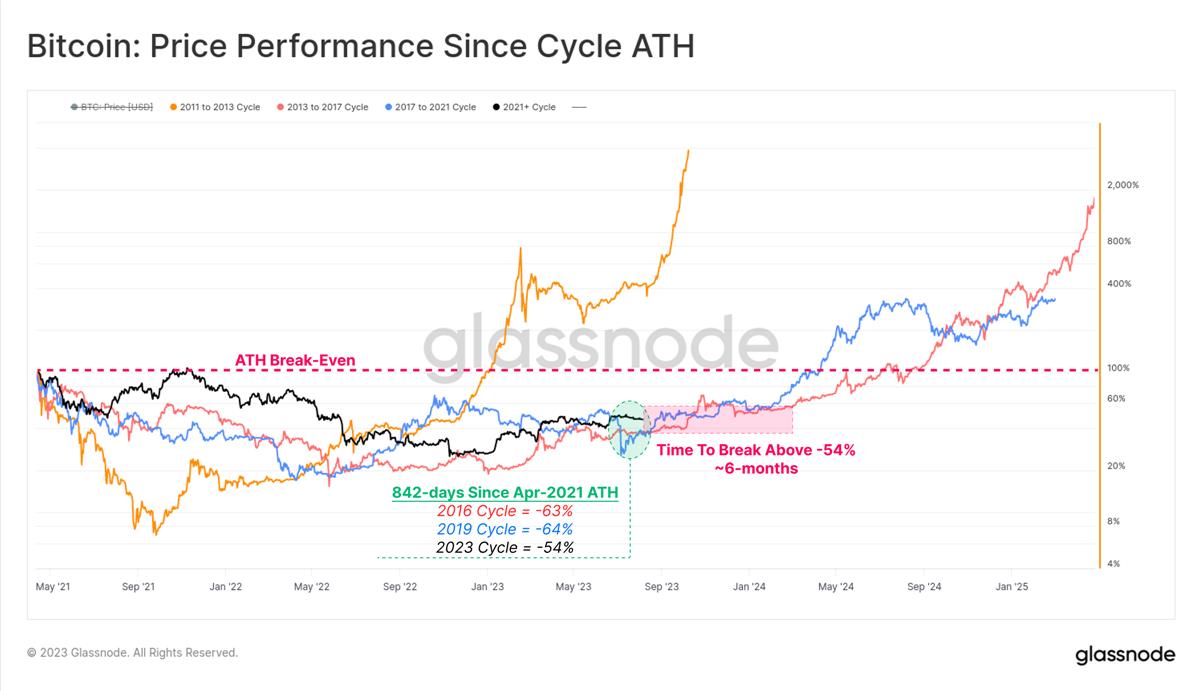
842 days have passed since the peak of the bull market in April 2021. Compared to history, the recovery in 2023 is actually better, with a decline of -54% compared to the all-time high, while the historical decline was -64%.
We also note that both the 2015-16 and 2019-20 cycles experienced 6 months of boring periods before the market accelerated beyond the -54% retracement level. This may indicate the boredom that could occur in the future.
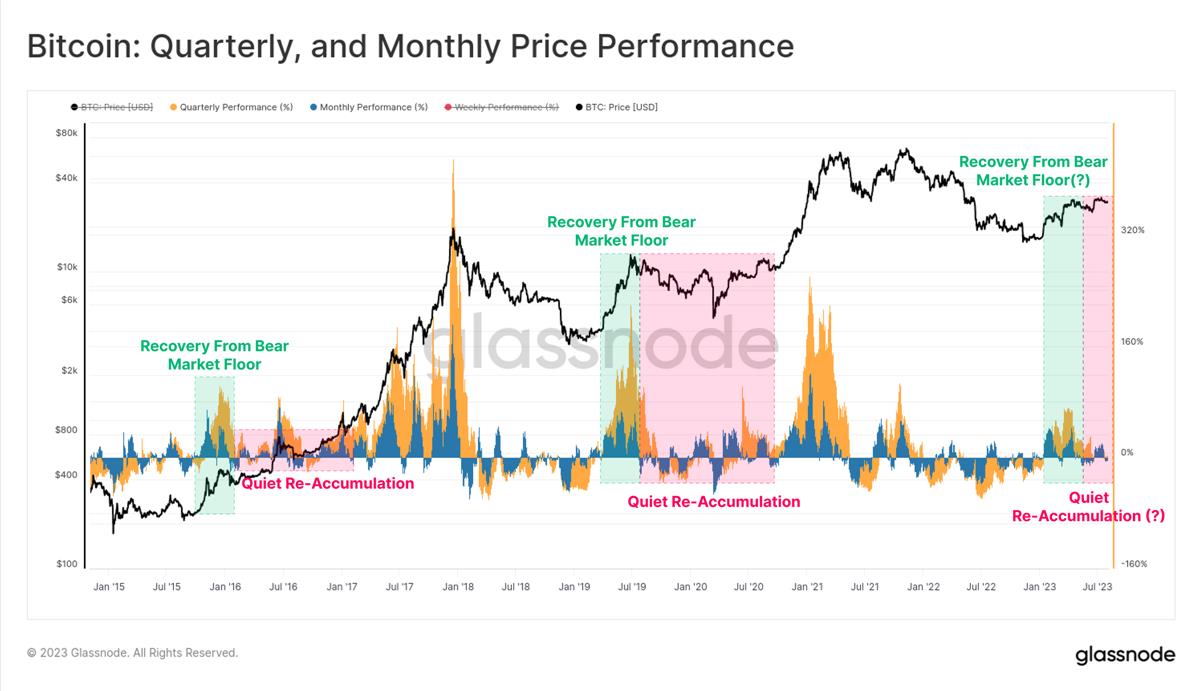
After a hot start in early 2023, both quarterly and monthly price performances have cooled down. We can once again see many similarities with previous cycles, where the initial momentum of the bottom bounce was strong, but then entered a period of continuous consolidation.
Bitcoin analysts typically refer to this period as a re-accumulation phase.
Volatility Collapse
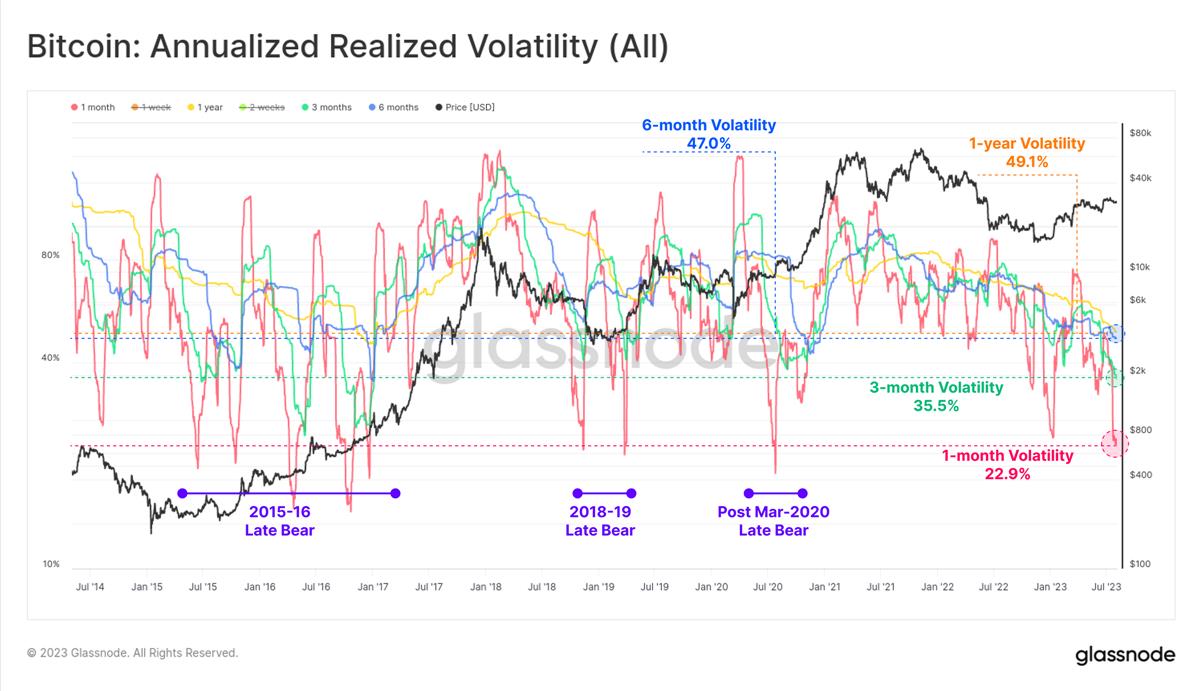
Bitcoin’s realized volatility has dropped significantly within a 1-month to 1-year observation window in 2023, reaching multi-year lows. The 1-year volatility level is now at levels not seen since December 2016. This is the fourth extreme period of volatility compression:
- The bear market at the end of 2015 entered a re-accumulation phase in 2016.
- The bear market phase at the end of 2018 occurred before the November sell-off of 50%. However, a recovery rebound occurred in April 2019, rising from $4,000 to $14,000 within three months.
- After March 2020, as the world adapted to the outbreak of COVID-19, the market consolidated.
- Market consolidation at the end of 2022, when the market was digesting FTX’s failure and our current market situation.
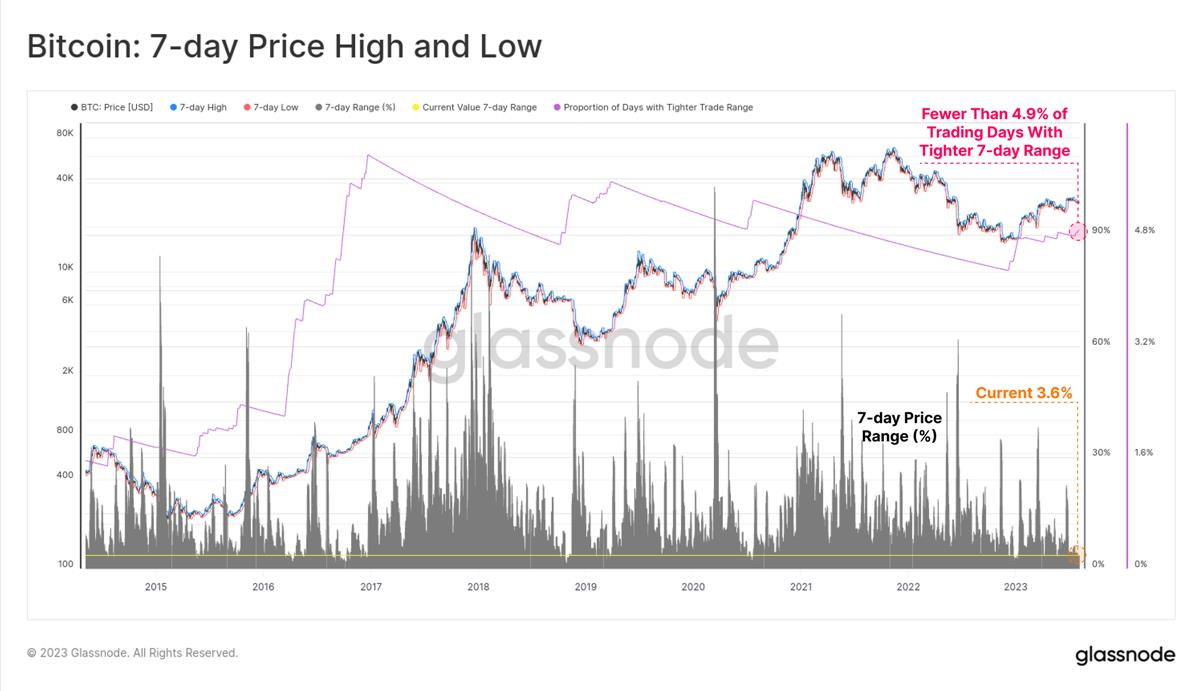
The price range between the highest and lowest prices within 7 days is only 3.6%. Only 4.8% of trading days have experienced a smaller weekly trading range.
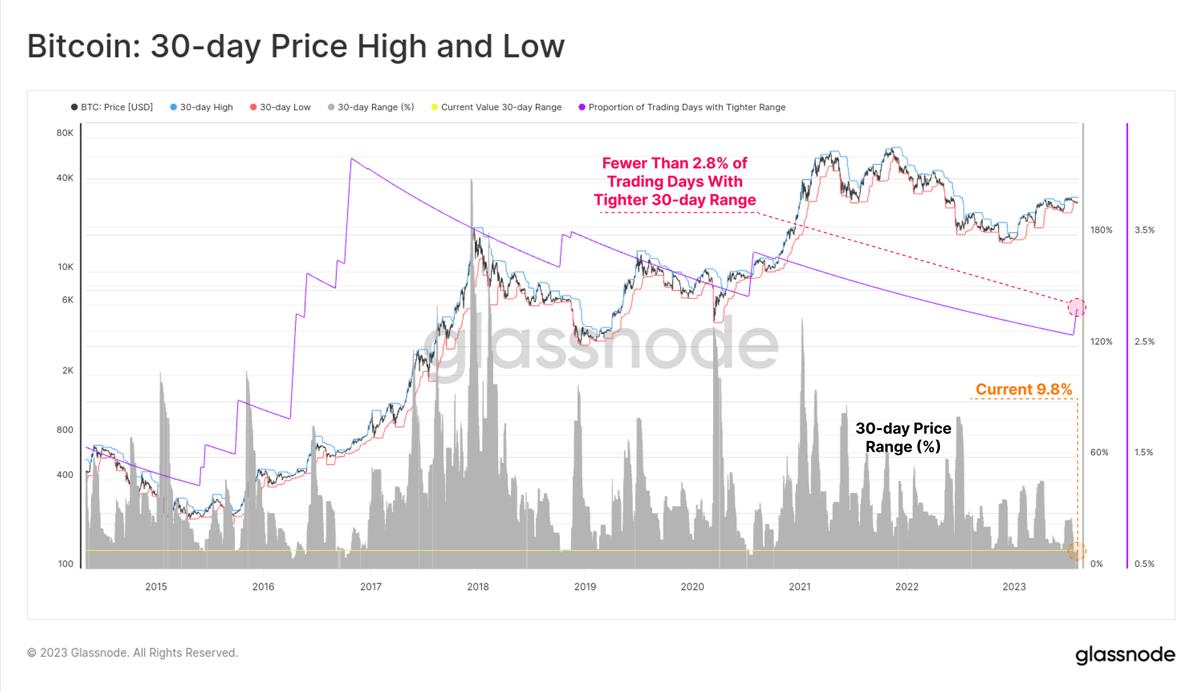
The price range for 30 days is more extreme, with prices fluctuating within a range of only 9.8% in the past month, and only 2.8% of months have had a smaller range than this. For Bitcoin, this level of consolidation and price compression is a very rare event.
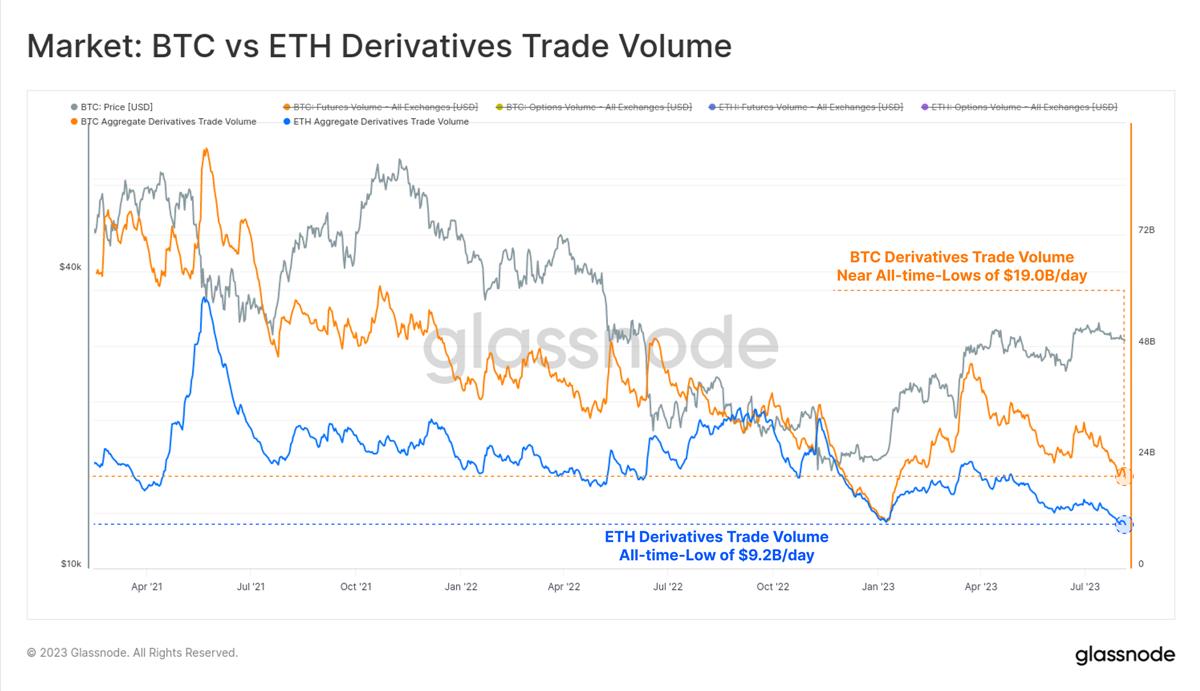
This period of calm is also evident in the Bitcoin and Ethereum derivatives markets. For both assets, trading volumes for futures and options are close to or at historic lows.
The derivatives trading volume for Bitcoin is currently $19 billion, while the Ethereum market has a daily trading volume of only $9.2 billion, reaching a low point in January 2023.
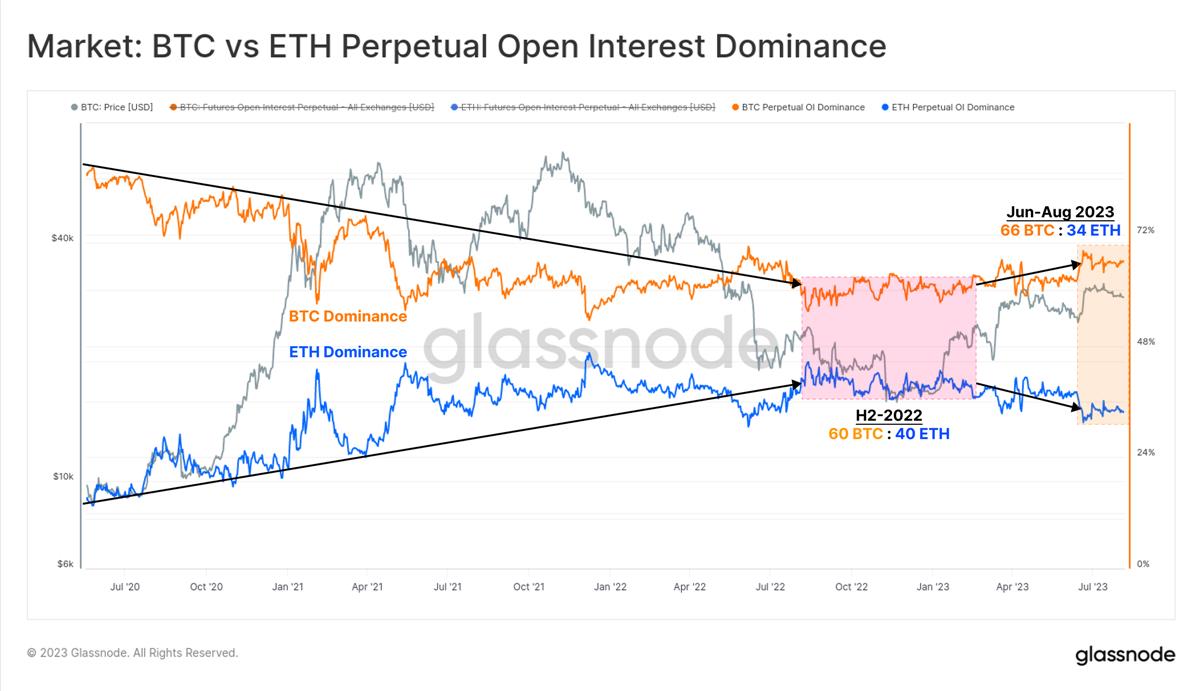
The market still maintains a relatively risk-averse stance, with Bitcoin’s dominance in the futures market gradually increasing. During the period from 2021 to 2022, the trading volume and open interest of the Ethereum futures market steadily increased relative to Bitcoin, reaching a peak of 60 BTC:40 ETH in the second half of 2022.
This year, Bitcoin has once again taken the lead, indicating that low liquidity and reduced risk appetite are still the forces driving funds towards the risk curve.
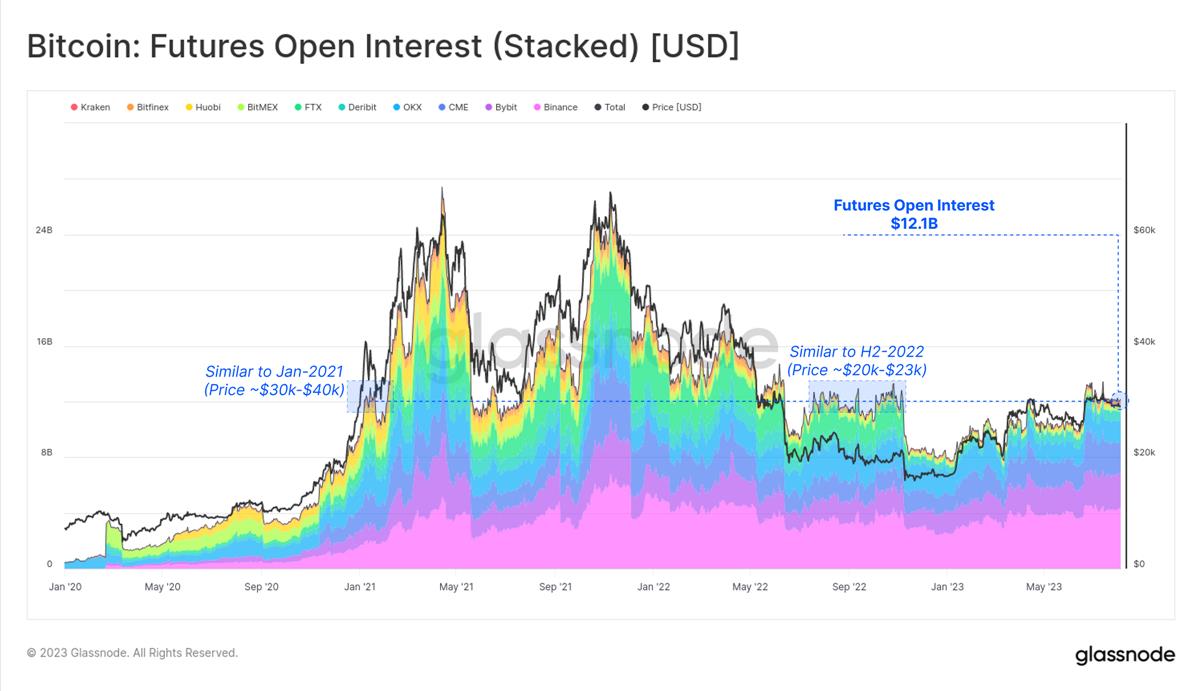
In the past month, the open interest of Bitcoin in the futures market has remained relatively stable at $12.1 billion. This is similar to the level in the second half of 2022, when Bitcoin was about 30% cheaper than today and FTX exchange was still active. This is also similar to the surge period in January 2021, when Bitcoin was 30% higher than now and the market was not yet mature, with leveraged speculation just heating up.
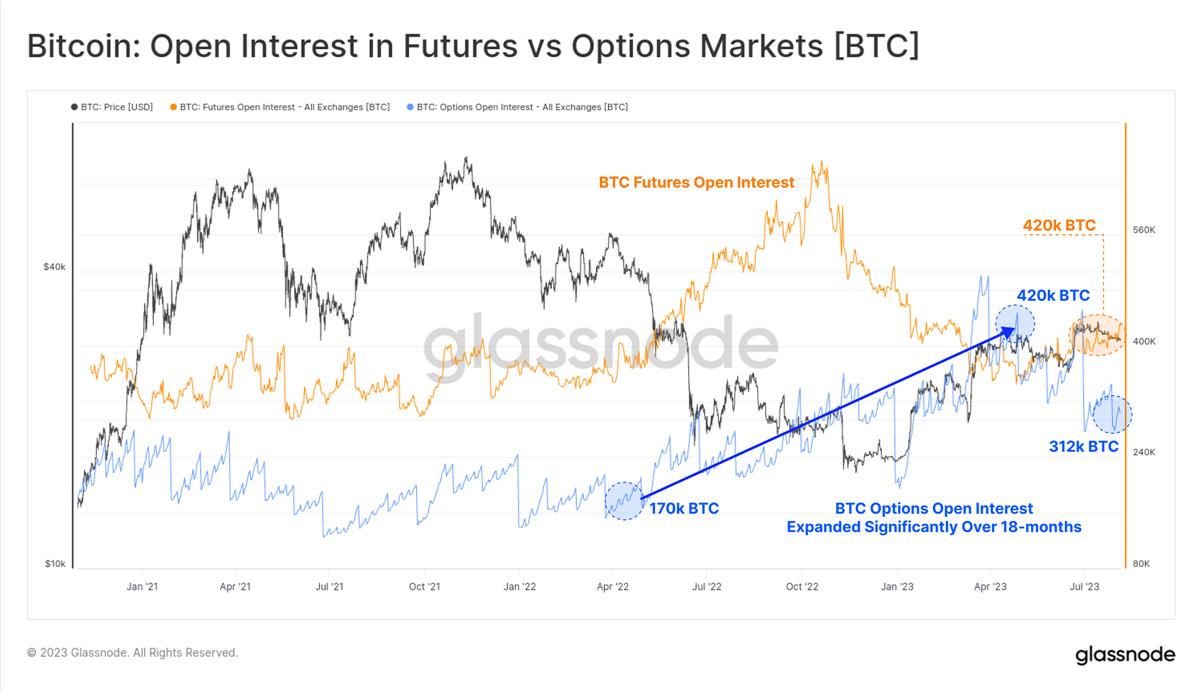
From a comparative perspective, the options market has seen significant growth in both dominance and growth, with open interest more than doubling in the past 12 months. Now, the options market is on par with the futures market in terms of open interest.
On the other hand, the open interest in the futures market has been steadily declining since the end of 2022 (when FTX crashed), with only a slight increase in 2023.
Due to the low trading volume and lack of activity in the futures market, the next target is to identify which opportunities keep traders active in the field of digital asset derivatives.
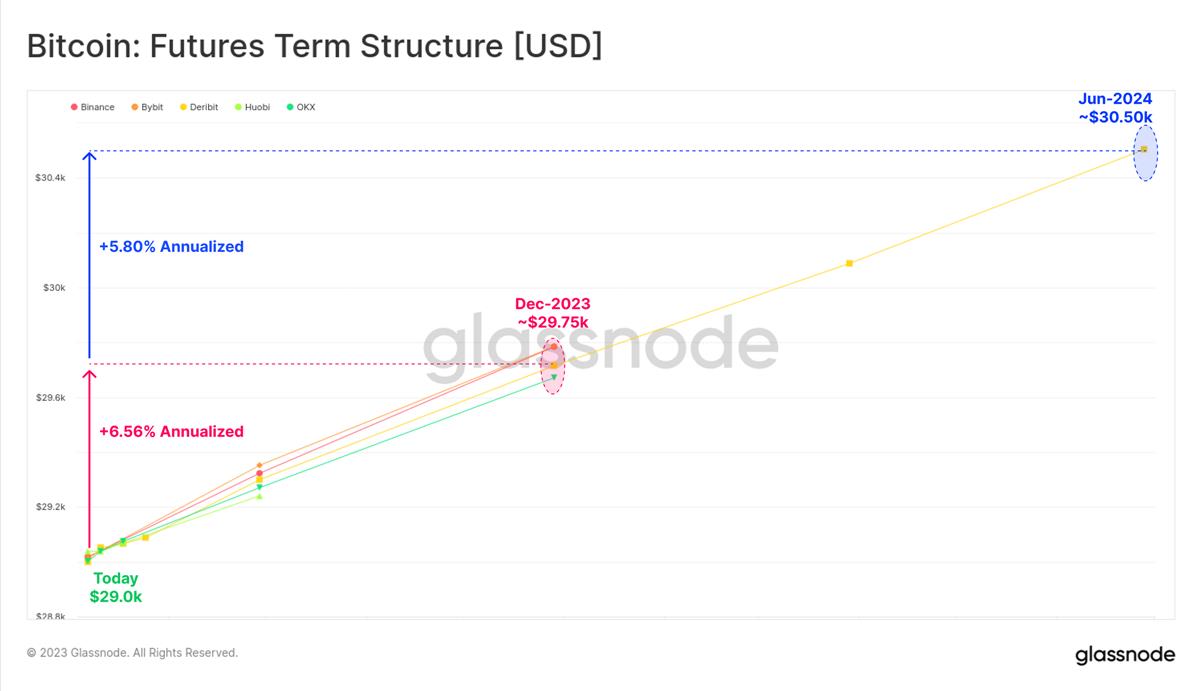
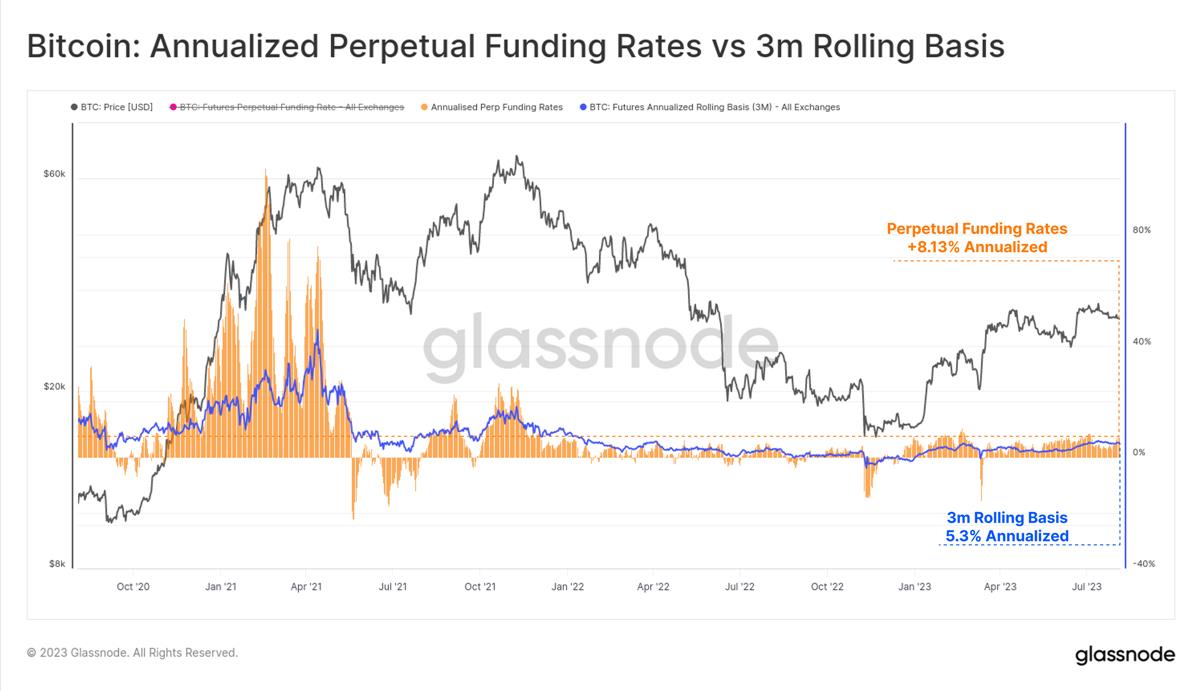
In the futures market, the term structure indicates that an annualized return between 5.8% and 6.6% can be achieved through spot arbitrage strategies. However, this is only slightly higher than the yield of short-term US Treasuries or money market funds.
The perpetual contract market is the most liquid trading venue for digital assets, where traders and market makers can lock in funding rate premiums to arbitrage futures and spot prices. This form of spot arbitrage is more volatile and dynamic, but considering the additional risks, the current annualized return is 8.13%, which is more attractive.
It is worth noting that since the end of 2022, funding rates have maintained a stable positive growth, indicating a significant change in market sentiment.
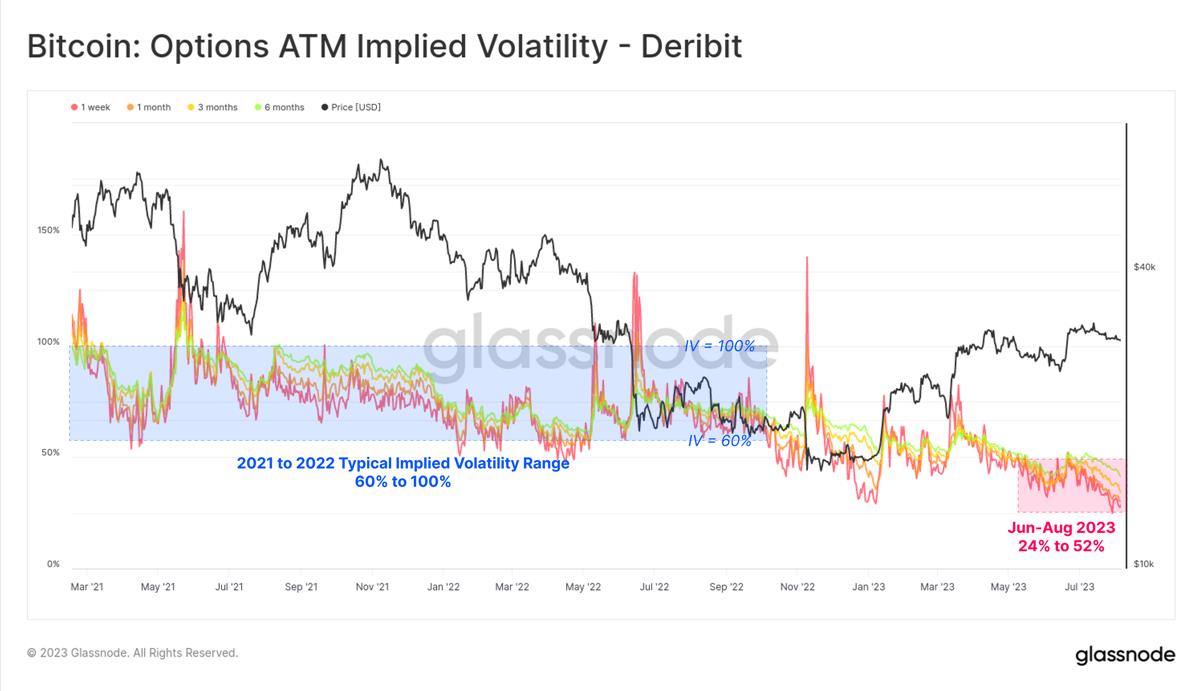
In the options market, we can see the severity of volatility compression, with implied volatility for all expiring contracts reaching historical lows.
The Bitcoin market is highly volatile, with implied volatility for options trading between 60% and over 100% for most of 2021-22. However, currently, the volatility premium in option pricing is at its lowest in history, with IV ranging from 24% to 52%, less than half of the long-term baseline.
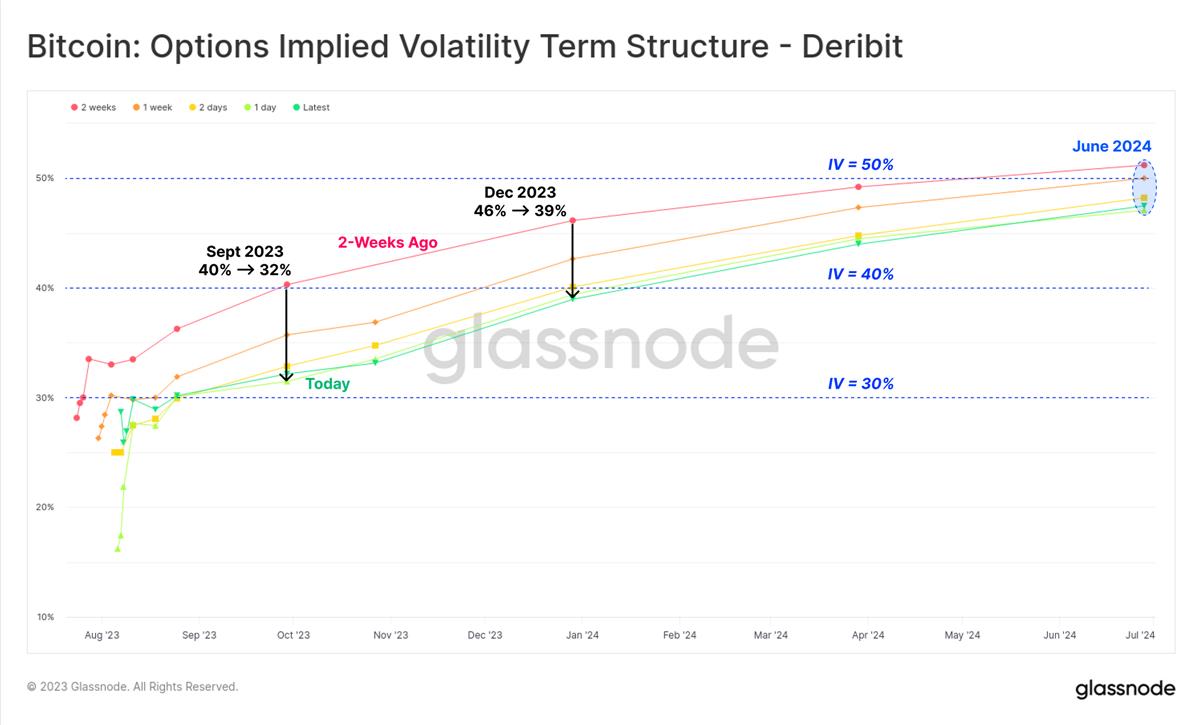
The implied volatility term structure shows that the volatility premium has been contracting in the past two weeks. In just the past two weeks, the implied volatility of the December contract has dropped from 46% to 39%. The volatility premium for options expiring in June 2024 is slightly above 50%, which is relatively low historically.
Both the put/call ratio in terms of trading volume and open interest are at or near historical lows, with a trading range between 0.42 and 0.48. This indicates a net bullish sentiment in the market, with demand for call options still dominant.
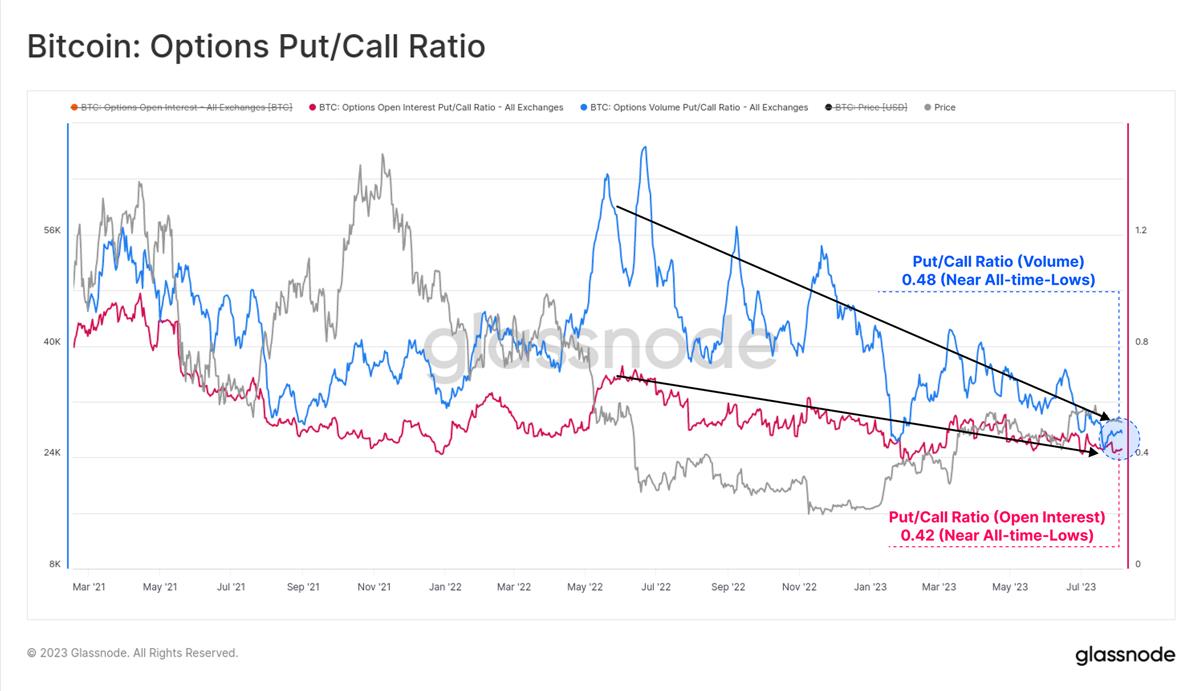
Therefore, compared to call options, put options are becoming cheaper, as reflected in the historical low of the 25-delta skew indicator. Overall, this suggests that the options market (now comparable in size to the futures market) believes that future volatility will be at historical lows.
Summary and Conclusion
Few news headlines claim that Bitcoin is a price-stable and non-volatile asset, making the occurrence of monthly trading ranges below 10% particularly notable. Currently, market volatility can be said to be at an all-time low, raising doubts about whether there will truly be an increase in volatility in the future.
The futures cash arbitrage yield ranges from 5.3% to 8.1%, slightly higher than the risk-free rate of short-term US treasuries. The implied volatility premium in the options market is at historically low levels, especially with weak demand for put options.
Considering Bitcoin’s volatility, have we entered a new era of price stability for Bitcoin, or has volatility been mispriced?
We will continue to update Blocking; if you have any questions or suggestions, please contact us!
Was this article helpful?
93 out of 132 found this helpful
Related articles
- Bitcoin Technology Revival? A Comprehensive Review of the Ordinals Series Protocols
- Reasons for the decline of ICP Independent technology and sparse ecosystem
- How will the metaverse truly land? Futureverse raises $54 million to focus on digital infrastructure
- Inventory of 6 projects in ETHGlobal LianGuairis that utilize authentication technology to build voting systems.
- Fit21 Encryption Bill of the Republican Party in the United States Approved for Full Deliberation in the House of Representatives
- From parameter A, examining the technical details and governance philosophy of Curve
- LianGuai Daily | Flashbots raises $60 million in funding; Anthropic, Google, Microsoft, and OpenAI launch cutting-edge model forum.