QKL123 market analysis | What is Bitcoin? Risk assets or hedge assets (0305)
Abstract: As a token of a peer-to-peer currency system, Bitcoin has the attributes of both risk assets and hedging assets: in the early days, similar company shares played a role in stimulating community or project construction; currently it has certain hedging attributes, but the market The fluctuations are like stocks and are affected by the ecological development of their own projects. For a short period of time, Bitcoin fluctuates within a range, and Ethereum is converging, and it may change.
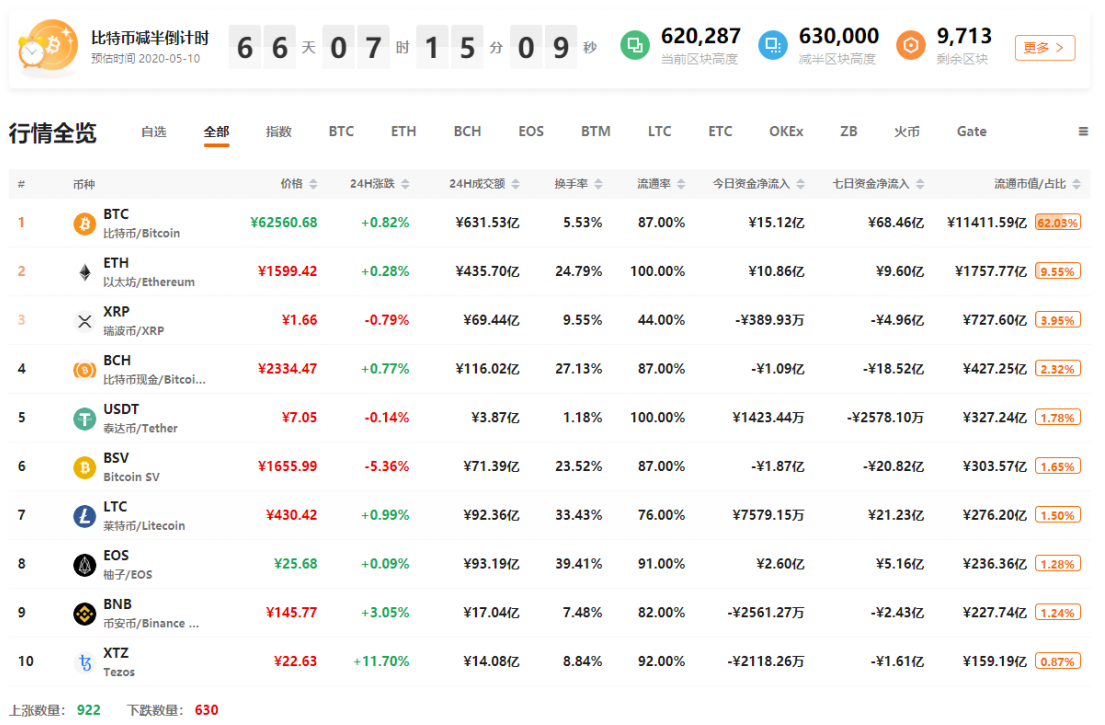
At 16:00 today, the 8BTCCI broad market index was reported at 13,396.19 points, with a 24-hour rise or fall of + 0.66%, reflecting a slight rebound in the broader market; total turnover was 907.123 billion yuan, a 24-hour change of -23.38%, and market activity decreased significantly. The Bitcoin strength index was reported at 86.02 points, with a 24-hour rise or fall of + 0.49%. The relative performance of Bitcoin in the entire market has become stronger; the Alternative sentiment index is 41 (previous value 40), and the market sentiment is expressed as fear; The external discount premium index was reported at 101.29, and the 24-hour price fluctuation was -0.17%, and the intensity of OTC fund inflow slightly weakened.
Analyst perspective:
- Intensive Reading | BIS: From the Flower of Money to the CBDDC Pyramid
- US Congress Holds Blockchain Hearing, Participating Companies Outspoken: Crypto Tax Is A "Nightmare"
- Perspectives | Bitcoin is not dead, the cycle is immortal
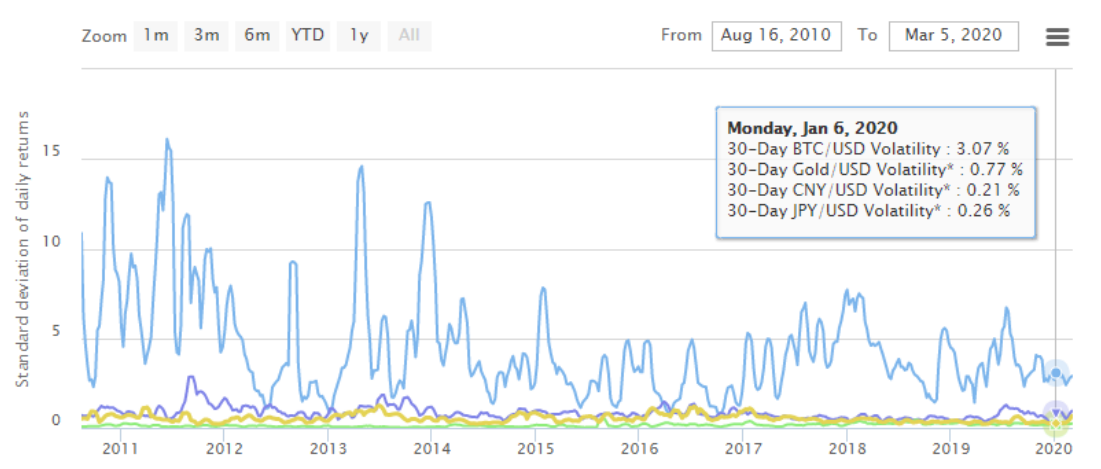
The definitions of safe-haven assets and risk assets are relative. Generally, a class of assets with relatively small market prices is called safe-haven assets, such as gold, the US dollar, the Japanese yen, and government bonds of some major economies. And stocks and financial derivatives usually have large price fluctuations and are usually considered risky assets. According to BuyBitcoinWorldWide, in terms of the U.S. dollar price (the actual purchasing power of the U.S. dollar is declining), the 30-day volatility of the yen, yuan, gold, and bitcoin is generally 0.3% -0.5%, 0.2% -0.4%, 0.5% -1%, 3% -6%. That is, from the perspective of market price performance, Bitcoin is still far from the definition of safe-haven assets.
Bitcoin is essentially a token of a decentralized currency system and has some of the characteristics of stocks and gold. In the early days of Bitcoin development, it was just a community project maintained by a small number of people. Tokens played a role similar to company equity financing and equity incentives: supporting project development and motivating early participants. Gradually, with the development of Bitcoin's payment scenario, trading market, and project ecology, more and more people around the world accepted Bitcoin, and Bitcoin has evolved into a risk asset based on open source code and global consensus.
For more than a decade, Bitcoin's market value has continued to rise and price volatility has continued to decline. At present, the market value of Bitcoin is as high as 11400 trillion yuan, and the volume is close to 2% of the market value of gold. Although Bitcoin still has strong speculative attributes, this does not prevent Bitcoin from being considered as digital gold, because Bitcoin and gold have many similar characteristics, especially the anti-inflation hedging attribute, or in some extreme cases As a safe haven. Historically, the Cyprus crisis, the abolition of large banknotes in India, and the severe inflation in Nigeria. The changes in the Google trend of Bitcoin and the apparent price premium in these regions are all manifestations of seeking Bitcoin as a safe haven in the region.
For many people in the world, Bitcoin is still an unknown thing, mainly because Bitcoin is far from their actual lives. On the one hand, because the infrastructure related to bitcoin payment or use is not sound, and there are still many functions that need to be improved in technology development; on the other hand, the attitudes of countries around the world to bitcoin have also limited the use of bitcoin. There is a competitive disadvantage in alternative payment instruments. However, as a hedging tool, Bitcoin can make up for some of the shortcomings of gold, such as lower inflation, portability, and near-infinite severability. As the saying goes, "buy gold in troubled times", for ordinary investors, at least one more choice.
First, the spot BTC market
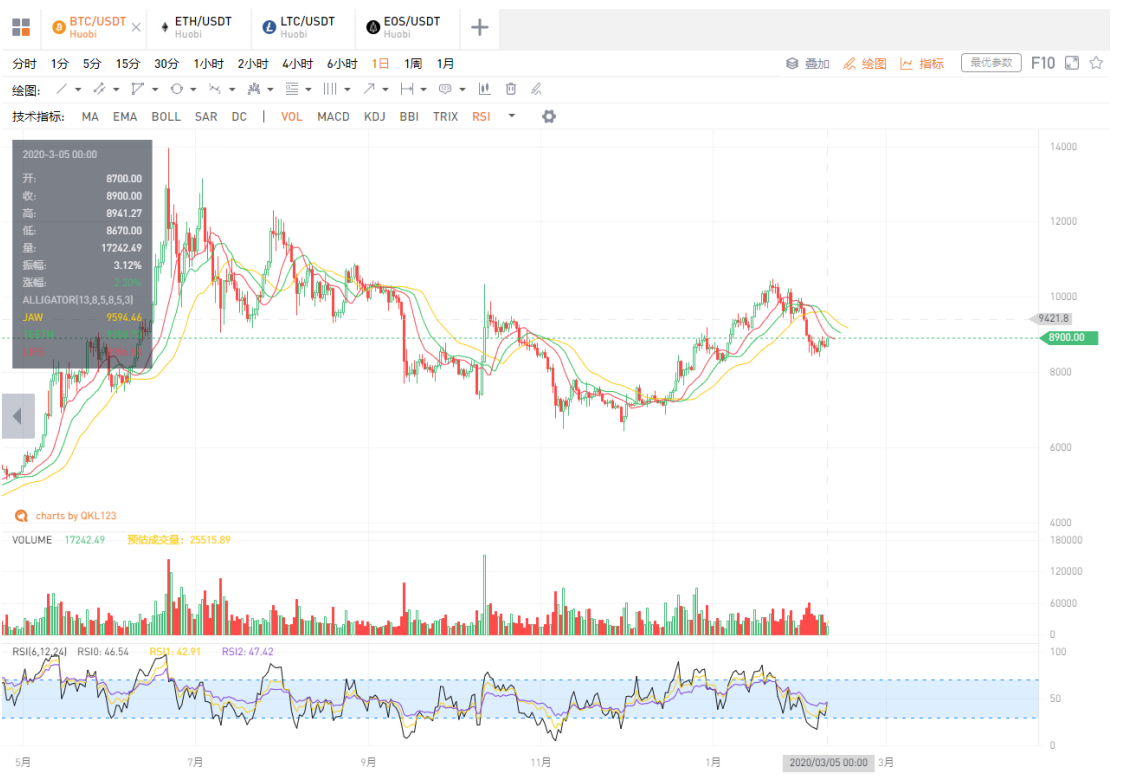
BTC went from US $ 8,600 to US $ 8,900 again, the volume could shrink relatively, and the long and short positions remained deadlocked. From the four-hour K line, the RSI departs from the oversold range, the crocodile indicator has a tendency to narrow, and the market has gradually stabilized, but the short-term shock may continue.
Second, the spot ETH market
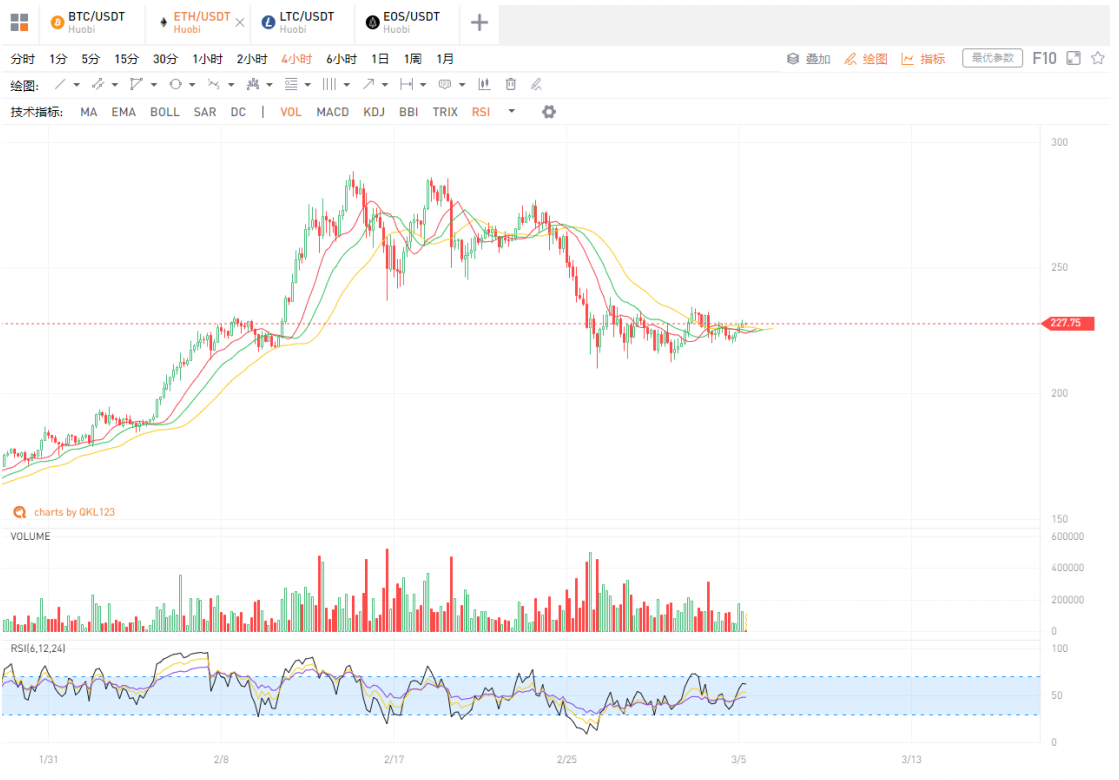
Recently, the trend of ETH has converged in a triangle. Although the move is similar to the high point in mid-February, it is less likely that the main force will play again after receiving chips at this position, and it is more likely to change upwards in a short time. .
Third, the spot LTC market
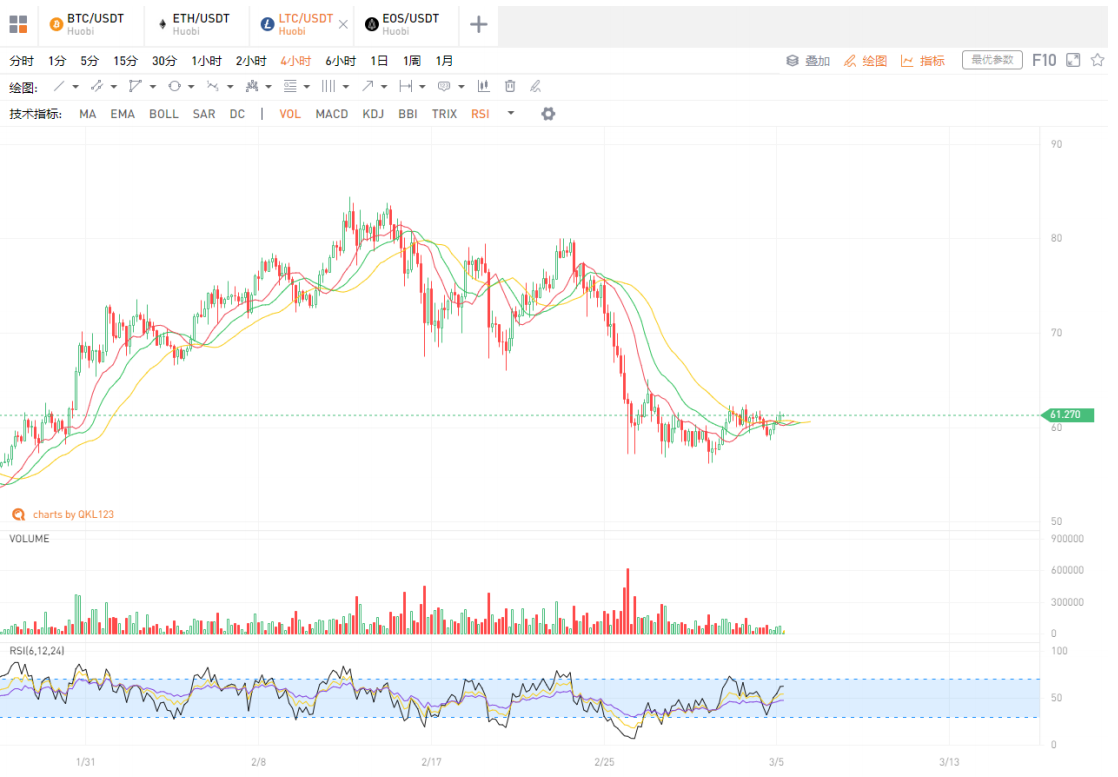
LTC and ETH move similarly. The 4-hour K-line crocodile indicator is closed to eat, and the long and short are exhausted. It may change in a short time.
Fourth, the spot EOS market
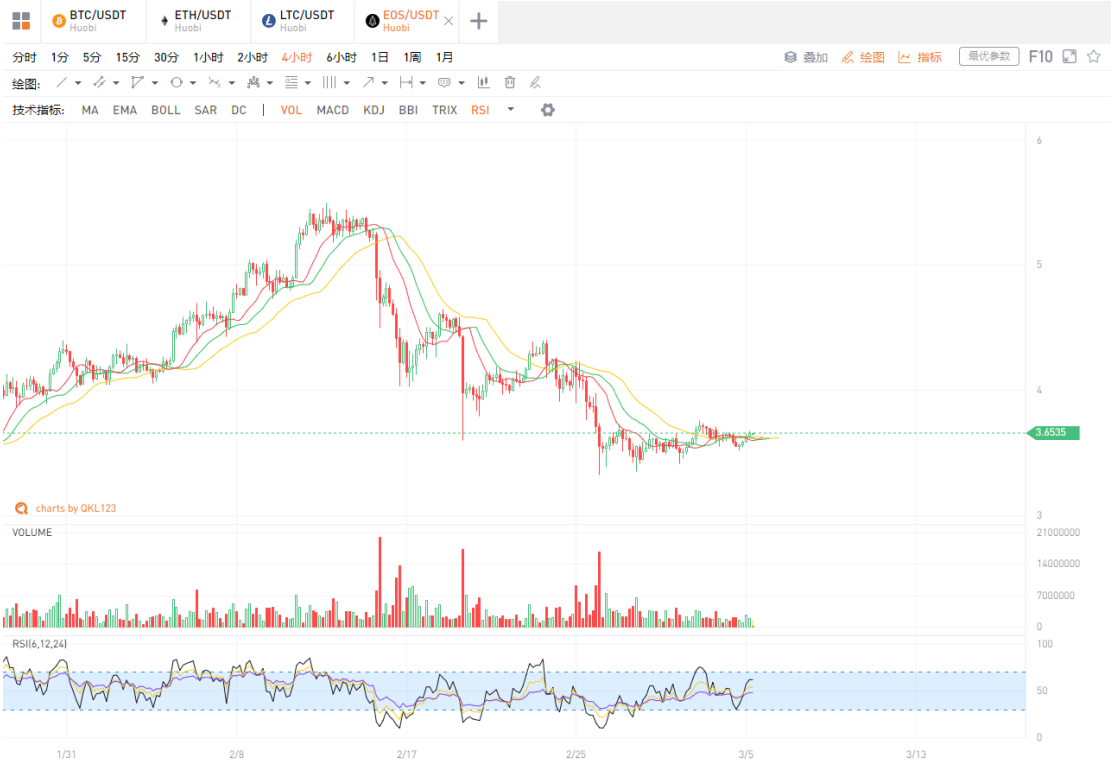
EOS linked with BTC may continue to explore today. If it breaks through the previous few days' highs, it can be used as a starting signal for the broader market.
Five, analyst strategy
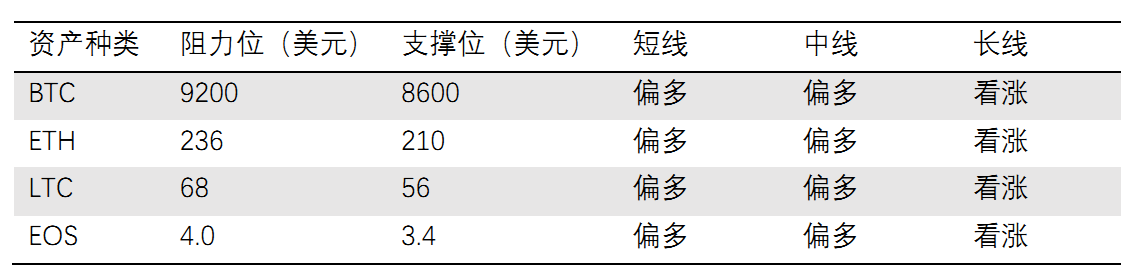
1. Long line (1-3 years)
The long-term trend of BTC has improved, and it is expected to usher in the crazy bull market in the next one to two years. Smart contract platform leader ETH, altcoin leader LTC, DPoS leader EOS can be configured at dips.
2. Midline (January to March)
BTC is hovering at the 200-day moving average, which is expected to increase by halving. There is still a certain amount of upside. Those who do not have heavy positions will increase their positions on dips.
3. Short-term (1-3 days)
There may be a short-term change in the market. Small positions attract low and sell high.
Appendix: Interpretation of Indicators
1. 8BTCCI broad market index
The 8BTCCI broad market index is composed of the most representative tokens with large scale and good liquidity in the existing global market of the blockchain to comprehensively reflect the price performance of the entire blockchain token market.
2.Bitcoin Strength Index
The Bitcoin Strength Index (BTCX) reflects the exchange rate of Bitcoin in the entire Token market, and then reflects the strength of Bitcoin in the market. The larger the BTCX index, the stronger the performance of Bitcoin in the Token market.
3.Alternative mood index
The Fear & Greed Index reflects changes in market sentiment. 0 means "extremely fearful" and 100 means "extremely greedy." The components of this indicator include: volatility (25%), transaction volume (25%), social media (15%), online questionnaire (15%), market share (10%), and trend (10%).
4.USDT OTC Premium Index
The ChaiNext USDT OTC INDEX index is obtained by dividing the USDT / CNY OTC price by the offshore RMB exchange rate and multiplying by 100. When the index is 100, it means the USDT parity, when the index is greater than 100, it means the USDT premium, and when it is less than 100, it means the USDT discount.
5.Net Funds Inflow (Out)
This indicator reflects the inflow and outflow of funds in the secondary market. By calculating the difference between the inflow and outflow of funds from global trading platforms (excluding false transactions), a positive value indicates a net inflow of funds, and a negative value indicates a net outflow of funds. Among them, the turnover is counted as inflow capital when rising, and the turnover is counted as outflow capital when falling.
6.BTC-coin hoarding indicator
The coin hoarding indicator was created by Weibo user ahr999 to assist bitcoin scheduled investment users to make investment decisions in conjunction with the opportunity selection strategy. This indicator consists of the product of two parts. The former is the ratio of Bitcoin price to the 200-day fixed investment cost of Bitcoin; the latter is the ratio of Bitcoin price to Bitcoin fitting price. In general, when the indicator is less than 0.45, it is more suitable to increase the investment amount (bottom-sweeping), and the time interval accounts for about 21%; when the indicator is between 0.45 and 1.2, the fixed investment strategy is suitable, and the time interval accounts for about 39 %.
Note: Crypto assets are high-risk assets. This article is for decision-making reference only and does not constitute investment advice.
We will continue to update Blocking; if you have any questions or suggestions, please contact us!
Was this article helpful?
93 out of 132 found this helpful
Related articles
- Wall Street capital forces palace, Silicon Valley elite trust crisis and crypto sweetness
- Perspective | Digital assets will establish a new order for the private equity market, which will become the standard investment market
- ProgPoW algorithm is leaked, Ethereum ASIC mining is unstoppable?
- Bitcoin's biggest loyal fan, Twitter CEO Jack Dorsey again funding Bitcoin developers
- Market analysis: BTC stabilizes and rebounds, is expected to build a curved bottom
- Bitcoin Secret History: What did Satoshi Nakamoto and BM chat in Bitcointalk
- Grayscale GBTC fund premium suggests institutional investors hoarded bitcoin in February