Search plunged into 90%, panic continued, and bitcoin bottomed out all the same signals?
Falling for more than a month, is Bitcoin in the end?
Bitcoin has bottomed out all the time and will show similar characteristics: Bitcoin ’s search fever hits a record low, the entire network ’s computing power continues to decline, and a large number of miners shut down and go out of business; the panic index has been at a low level for a long time, and investors have chosen cash as the king; USDT issuance continues New highs, USDT positive premium has become the norm, and the data performance on the Bitcoin chain is extremely sluggish.
Looking at the current performance of the cryptocurrency market, we are experiencing a similar situation.
In the bitcoin mining difficulty adjustment just passed, the bitcoin mining difficulty was reduced by 16% at one time, setting a historical record. In the context of the currency's price falling and rising, and the global central bank's continuous release of liquidity, there is even more reason to believe that Bitcoin is bottoming out.
- How to choose the cryptography technology? Preliminary Study on Security Model of Theoretical Capability Boundary
- Babbitt Column | Bitcoin is a risky asset, and hedging properties have never really been verified in the market
- Research report | How to invest in crypto assets under extreme conditions?
1.Bitcoin's bottom signal
"Bitcoin has a high probability of $ 3,800. This is the bottom of the market in this round of decline."
Recently, Xu Yingkai, the founding partner of BlockVC, made a prediction on the bottom of Bitcoin. As a well-known investment in the circle, the industry has given a more positive response. Xu Yingkai also said that after Bitcoin halved (1-2 months later), the market began to fully recover.
In addition, many industry data such as changes in mining difficulty, search heat, and panic index also indicate that Bitcoin is currently in the bottom-building stage.
According to the latest data from BTC.com, the BTC mining difficulty was reduced by 15.95% to 13.91T (block height 622944) on March 26. This mining difficulty reduction is the second highest in Bitcoin history, only after 18.03% on October 31, 2011. If calculated based on the history of Bitcoin's ASIC miners since 2013, the difficulty reduction will reach a record high, higher than 15.13% on December 3, 2018.
Among them, before December 2018, Bitcoin experienced a drop of nearly 60%; in October 2011, Bitcoin also experienced a drop of up to 55%. After a while, Bitcoin started the bottoming process.
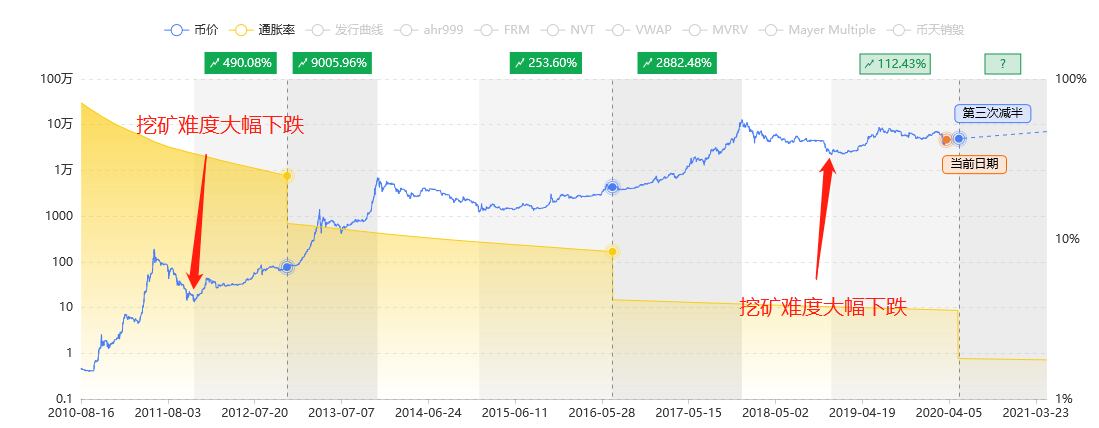
Data source: qkl123.com
Historical data shows that the difficulty of mining has a very close relationship with the change in the price of bitcoin.
The lowering of mining difficulty means "mining cleaning", and the upcoming reduction of Bitcoin production will intensify such cleaning and promote the healthy development of the industry.
In this regard, Xu Yingkai believes that after the halving is completed, due to the cliff-like decline in the miner's revenue, a wave of miners will be concentrated, but the daily new market selling pressure has also doubled year-on-year (in fact, the impact was not significant before the half) The so-called "death spiral" (lower prices, miners selling coins, and lower prices due to miners selling coins) is expected to gradually weaken.
"I'm greedy when others panic," Buffett's investment motto echoed.
So is the crypto market scared? Obviously, at present, the entire market is in a state of extreme panic for a long time.
Review the historical data of the “Panic and Greed Index”. Since the index was launched in February 2018, the lowest value of the index appeared on August 21, 2019. The panic index reached 5 on the day, but then quickly rebounded to the normal level of 31. . The recent panic index has been under extreme panic for a long time, and there is no sign of rebound, which fully shows that the current market is in a state of extreme panic, and the degree of panic has reached an unprecedented level. [1]
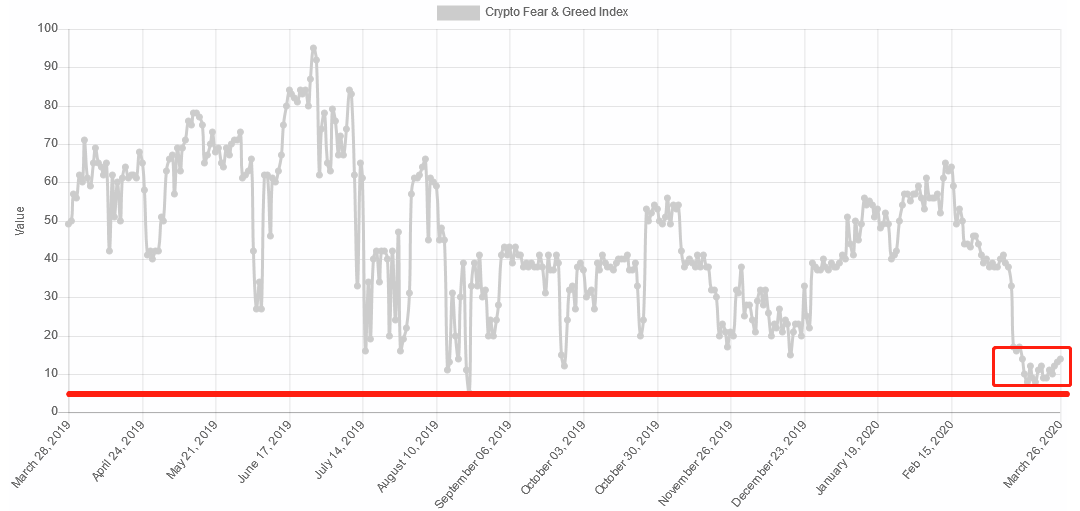
Data source: alternative.me
The reason why the entire market will be so panic, in this regard, Xu Yingkai believes that the price position of 3,800 US dollars is caused by extreme panic of market sentiment, and serial bursts of contracts, leverage, borrowing, etc. Copying and supplementing market liquidity is a top priority.
The USDT premium index can also feedback this issue from the side. The latest data of the USDT OTC Premium Index shows that since the end of January, USDT has been in a positive premium state for a long time, which shows that the liquidity of the cryptocurrency market needs to be resolved urgently.
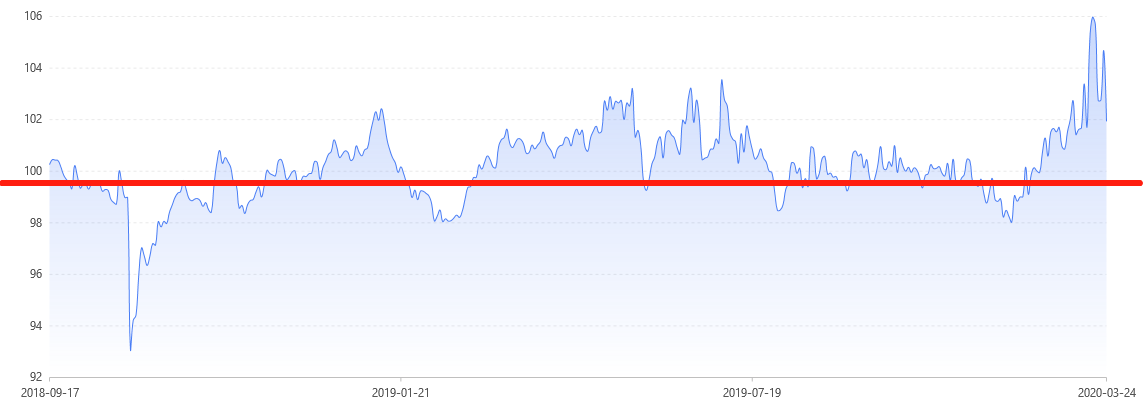 Above the red line indicates that USDT is at a premium
According to Xu Yingkai, this issue will be resolved in the next two months.
"The Federal Reserve opens the Unlimited QE model and directly purchases various credit assets (even through SPV pocket private sector credit). The behavior of unlimited QE will gradually reflect the market liquidity after 1-2 months. Because of the new crown pneumonia band The coming global market is uncertain. In the next 1-2 months, it will gradually facilitate statistical forecasting. The problem that assets cannot be re- reasonably priced will be resolved, and some wait-and-see funds will gradually enter the market. "Xu Yingkai said.
According to Xu Yingkai, through this cross-cycle and market-level shuffle, the balance in the existing market structure will be broken, the distribution of chips will be more concentrated, the market's main holding costs will be significantly reduced, and the momentum needed to re-rise is lower and changed Made it easier.
In any case, many indicators are pointing to "Bitcoin is in the process of building the bottom", and the data on the Bitcoin chain also points to this conclusion.
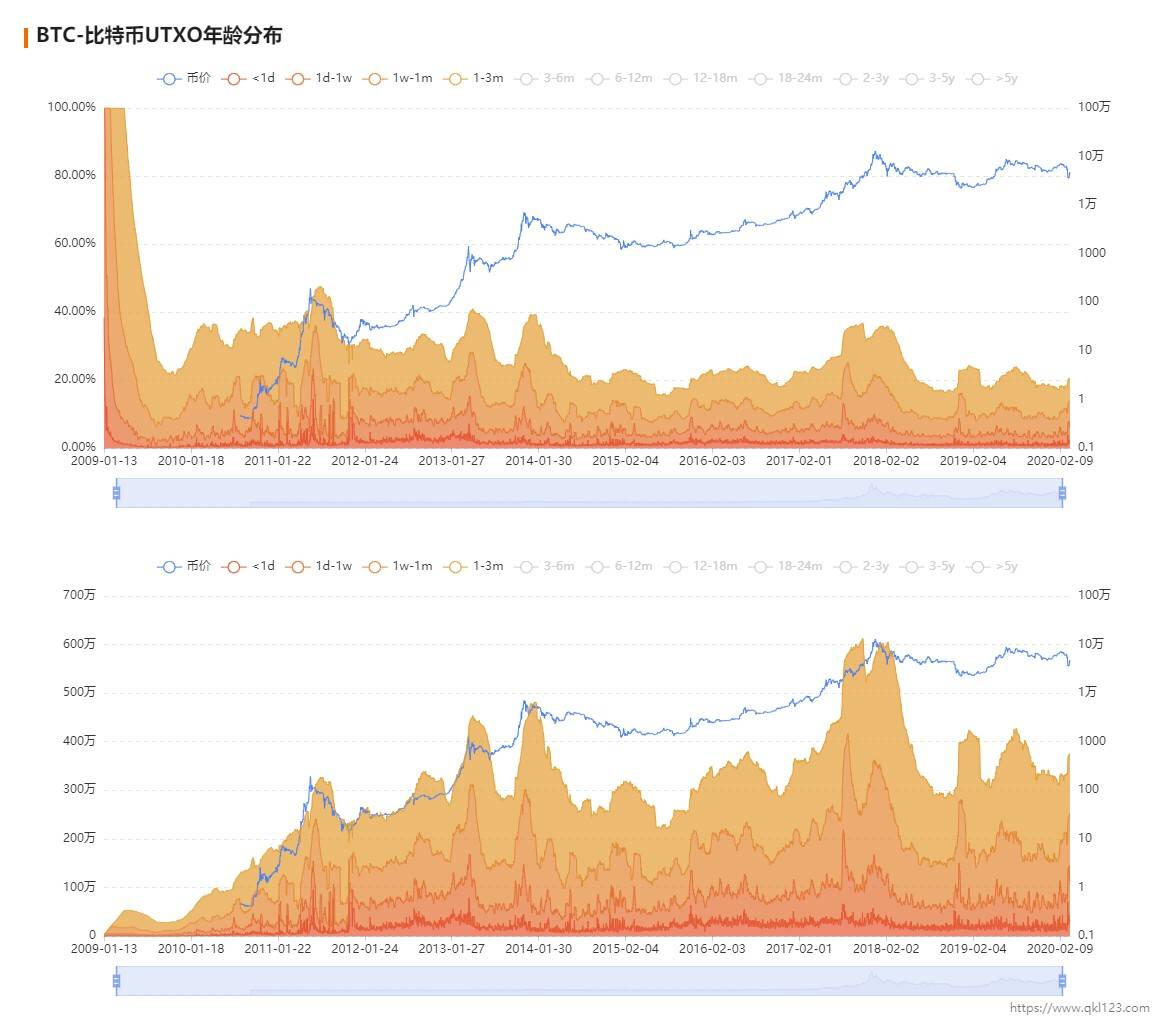
2. On-chain data UTXO, the hardest core building index
Unlike bank accounts, Bitcoin uses the UTXO (Unspent Transaction Output) model to feed back account balances. The more unmoved balances over a long period of time, the more Bitcoins that have been frozen, and the less the market circulation. This is the hardest core indicator of the feedback building process.
According to the length of "snow", Bitcoin UTXO is divided into three categories: The first category is UTXO that is held for more than one year. This type of holder is usually defined as Hodler, which corresponds to long-term holders. The second type is UTXO held for less than three months. This type of holder can be defined as a Trader, which indirectly reflects the behavior of short-term traders. The third type is UTXO between three months and one year. This type of holder is referred to here as the Transitioner, as it is most likely to be converted to Hodler or Trader. [2]
The blockchain data website QKL123 has a professional study of these three indicator data in the article "Bitcoin UTXO Age Distribution: In the Market?" We next introduce the study.
First, let's look at the change in Bitcoin Ho dl (long-term holder) holdings.
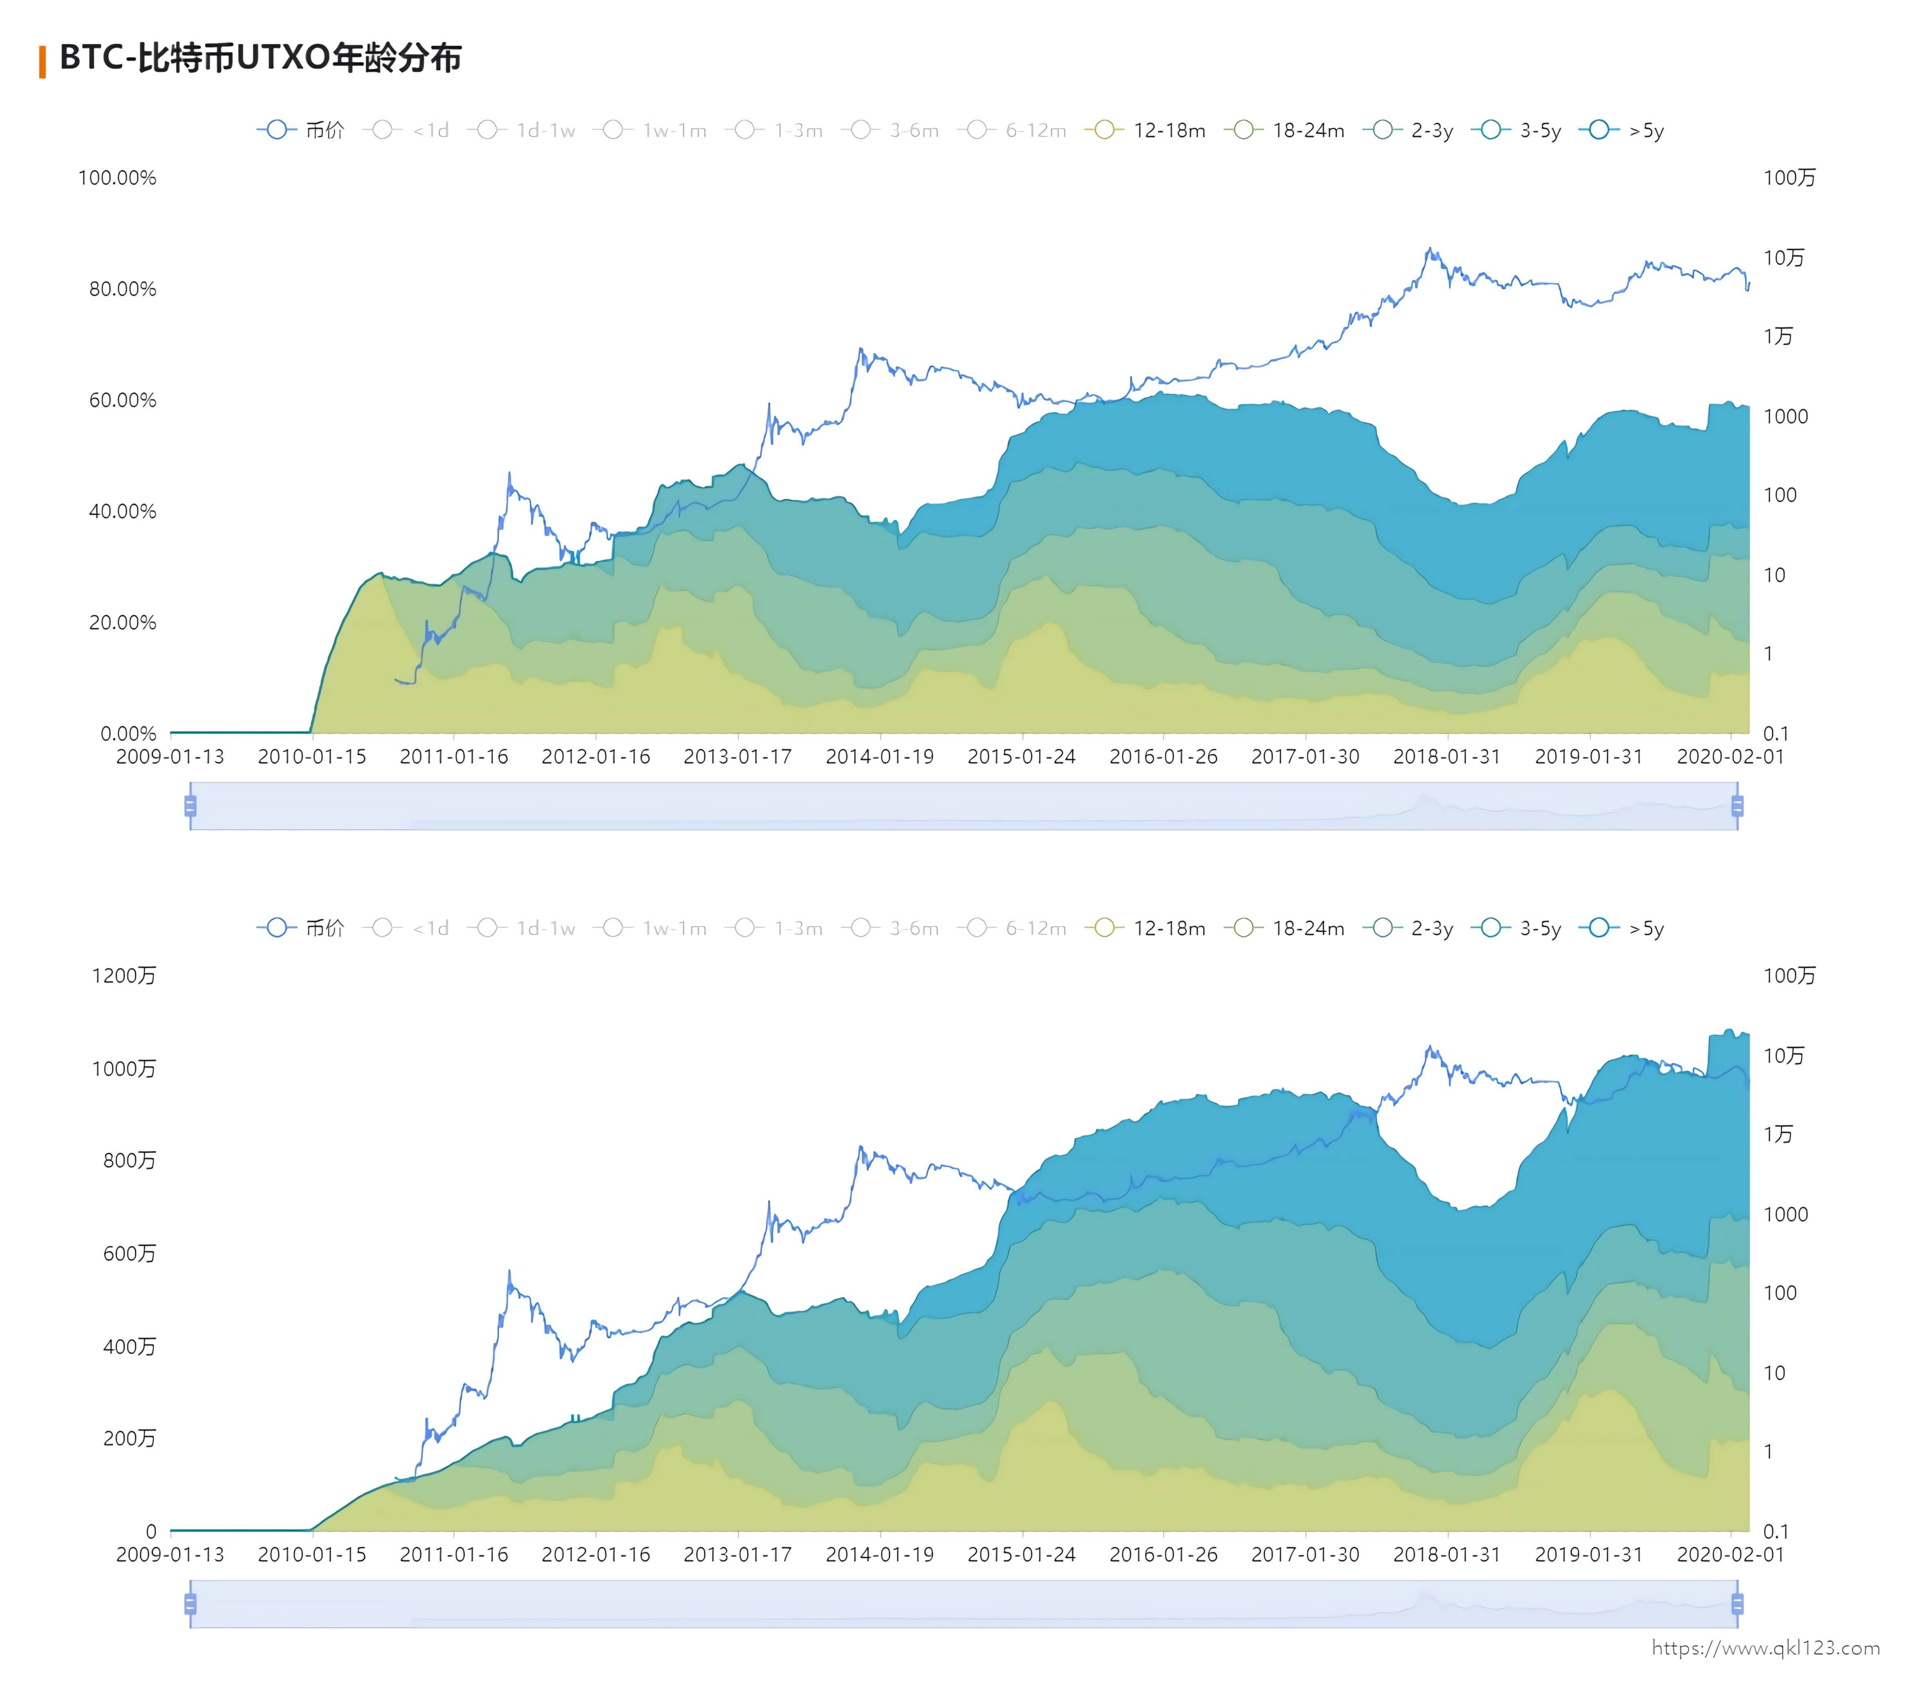
Historical data shows that Ho dler's holdings and the price of Bitcoin show a significant negative correlation in some periods.
For example, near the historical cyclical peaks, after the bull market peaks in December 2013 and December 2017, Hodler's holdings reached periodical troughs in March 2014 and March 2018, respectively. Especially in January 2013 and April 2016, they were 12 months and 16 months behind the previous bear market lows (November 2011 and January 2015).
Therefore, it can be concluded that a considerable part of Ho dler was sold for a period of more than a year after the bear market bottomed and held for more than a year. Currently, Holder's holdings are at the historically high levels seen in March 2019, meaning that a cyclical bottom is forming.
This indicator shows that the current long-term holders are increasing, and Bitcoin is at the bottom.
Second, let's look at the changes in Bitcoin Trader holdings.
Because many traders' bitcoins are stored on exchanges, the on-chain Trader can only indirectly reflect the behavior of some of these subjects.
Comparing Trader's holdings with Bitcoin prices, it is found that during the bull market, the two showed a very obvious positive correlation, which is also easier to understand-during the bull market, transactions were active and the number of transfers increased.
For example, after the bull market peaks in June 2011, April 2013, December 2013, and December 2017, Trader holdings were in July 2011, April 2013, January 2014, and January 2018, respectively. There were periodic highs in the month. Moreover, there are obvious big fluctuations around the high point, which indicates that many Traders have made a lot of changes around the apex and sold a lot during the decline of the Bitcoin price.
In the period of low currency prices, such as near the cyclical lows of the market in early 2015 and the end of 2018, Trader's holdings correspond to a small peak, indicating that the market is active at this position due to a dip. At present, with the recent sharp drop in Bitcoin, Trader's holdings have rebounded significantly, indicating that the bottom-sweepers are active.
Finally, let's look at the change in Bitcoin Transitioner holdings.
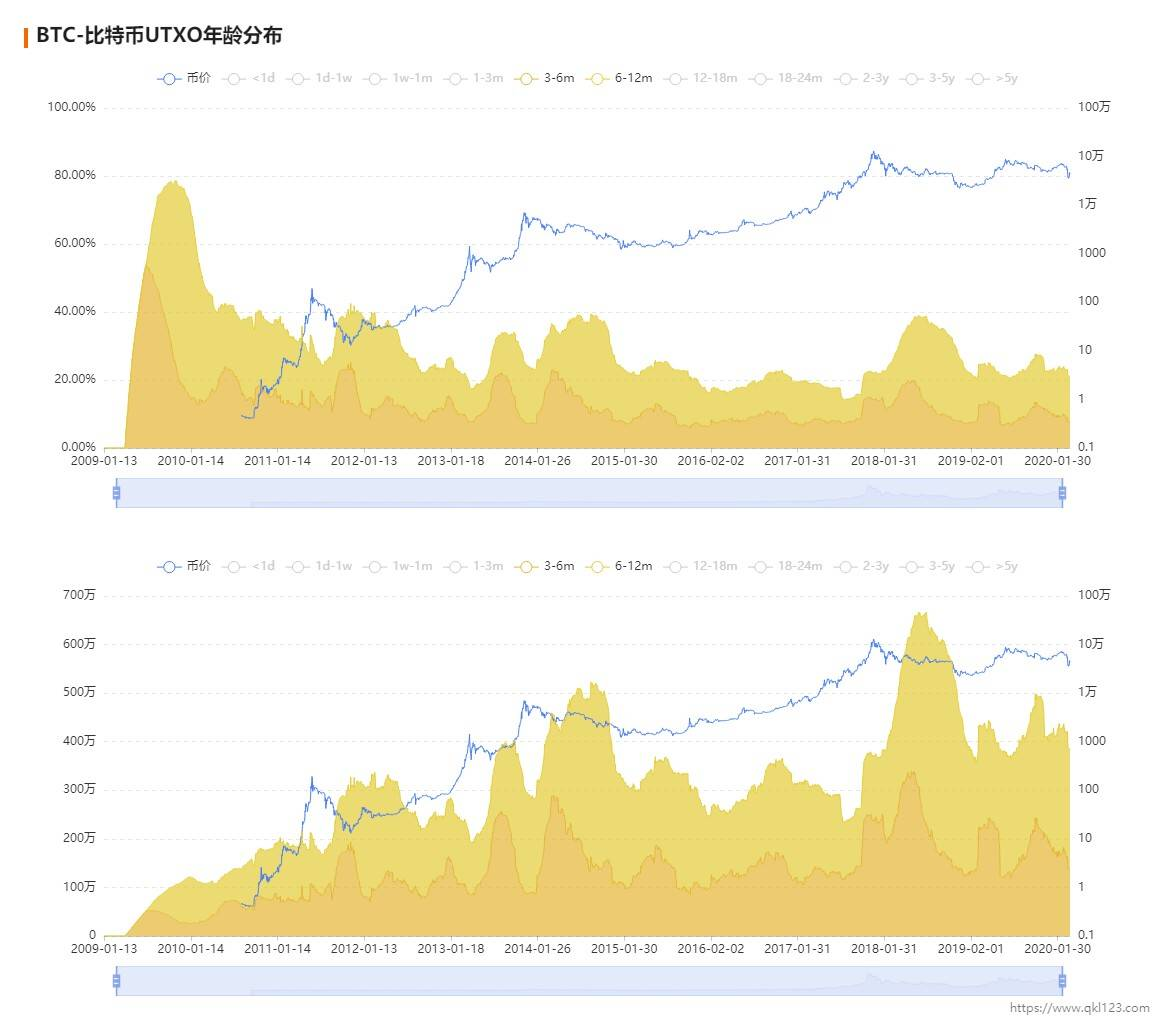
Transitioner is not old or short, stuck between Hodler and Trader, and its behavior may have both characteristics.
There have been four significant highs in the history of Transitioner holdings. The corresponding periods are from November 2011 to May 2012, May 2013 to October 2013, and June 2014 to October 2014. , And from May 2018 to August 2018. In these four periods, the period from the previous period when the high point of the price was around 6 months, indicating that many Transitioner had taken over the high and were forced to sell after holding for a period of time.
Moreover, after completing a large number of sell-offs, Transitioner often corresponds to a periodical low point. For example, the two low points in March 2015 and February 2019 are near the periodical bottom. Currently, Transitioner is at an active low and is showing a downward trend. This shows that such investors are being washed out by the bear market.
In summary, whether it is Hodler, a firm holder of currency, Trader, a short-term speculator, or Transitioner that is often "cut", the three trends change, indicating that Bitcoin is at the bottom.
So, how will the script be written next?
3. How to write the next script?
Numerous indicators indicate that bitcoin is in the bottom-building phase, how long will this bottom-building phase last, and how will the script be written next?
Fundstrat technical analyst Rob Sluymer believes that Bitcoin has remained above the 200-week moving average, which he considers to be an important long-term structural support level for most asset classes, and supported the cryptocurrency in 2015 and 2018.
"For now, technically, we will once again think that Bitcoin is bottoming out, and it may take months for Bitcoin to recoup its losses."
Vijay Ayyar, head of business development of cryptocurrency exchange Luno in Singapore, believes that with the halving of Bitcoin block rewards coming, Ayyar believes that the price of Bitcoin may reach $ 6,500 again, and then continue to be between 3000 and 6000 before the next bull market breakthrough Dollar consolidation.
Blockchain senior entrepreneur Luo Kai, in his in-depth long article "How US Stocks and Bitcoin Work: How Much Down and How Much Up", "I still judge 3300-3500 points as a medium-term hard for Bitcoin Bottom. Why is this point. Because the assets of the fiat world entered Bitcoin at the end of 2018, the bottom of the predator that formed was in this range. "[3]
In addition, Luo Kai also said that Bitcoin is essentially irrelevant to U.S. stocks. After all, the market is too small, and even Apple's fractions are not. This time the "fuse" of Bitcoin should be understood more as having a strong correlation with US dollar assets. After all, there are two big forces in Bitcoin now, partly from USD assets and partly from RMB assets driven by USDT.
Luo Kai believes that there will be a surge in the short term? I think there may be a long and short double kill. Until the US stocks bottom in 2020 in June, the US stocks start to rise, and then they will not rise again.
No one can predict exactly how bitcoin will go next, but the phrase "how fierce the fall, how violent the rise, how short the fall time, and how violent the rise time" will definitely become the best footnote in the market .
Reference article:
[1] Breaking 7 historical records in 30 days, “2020 of the blockchain industry” is destined to be recorded in the annals https://mp.weixin.qq.com/s/QR-ma67ZnchRPcSmmL6SzQ
[2] Bitcoin UTXO age distribution: market bottom? Https://www.8btc.com/article/573938
[3] U.S. stocks vs. Bitcoin: how fierce it is and how fierce it is https://www.8btc.com/media/571658
We will continue to update Blocking; if you have any questions or suggestions, please contact us!
Was this article helpful?
93 out of 132 found this helpful
Related articles
- Opinion | BTC is likely to break $ 20,000 in 12 months, hedge funds begin to deploy cryptocurrencies significantly
- Behind "House N" in South Korea: Is Encryption Security Really Safe?
- Cryptocurrency rankings in the U.S. released! Richest cities hold $ 55,000 in crypto assets per capita
- Five Questions on New Infrastructure: Blockchain plays an important role and investment volume is insufficient
- Bybit New Product Launch Conference-Anyway, have an appointment with you
- Major Korean Exchanges Announce "Cooperate with Investigation of Room N"
- Opinion | Under the epidemic, the "hidden disease" of the supply chain is exposed, blockchain + supply chain or "hidden machine"


