TOP30 cryptocurrency data perspective: Who is blowing the bull market charge?
In the recent month, the price of the currency has soared, and Bitcoin once rushed to the vicinity of 9,000 US dollars. It seems that many people have seen the hope of the upcoming bull market. In the bear conversion room, who is screaming and whether it is revealing new market trends.
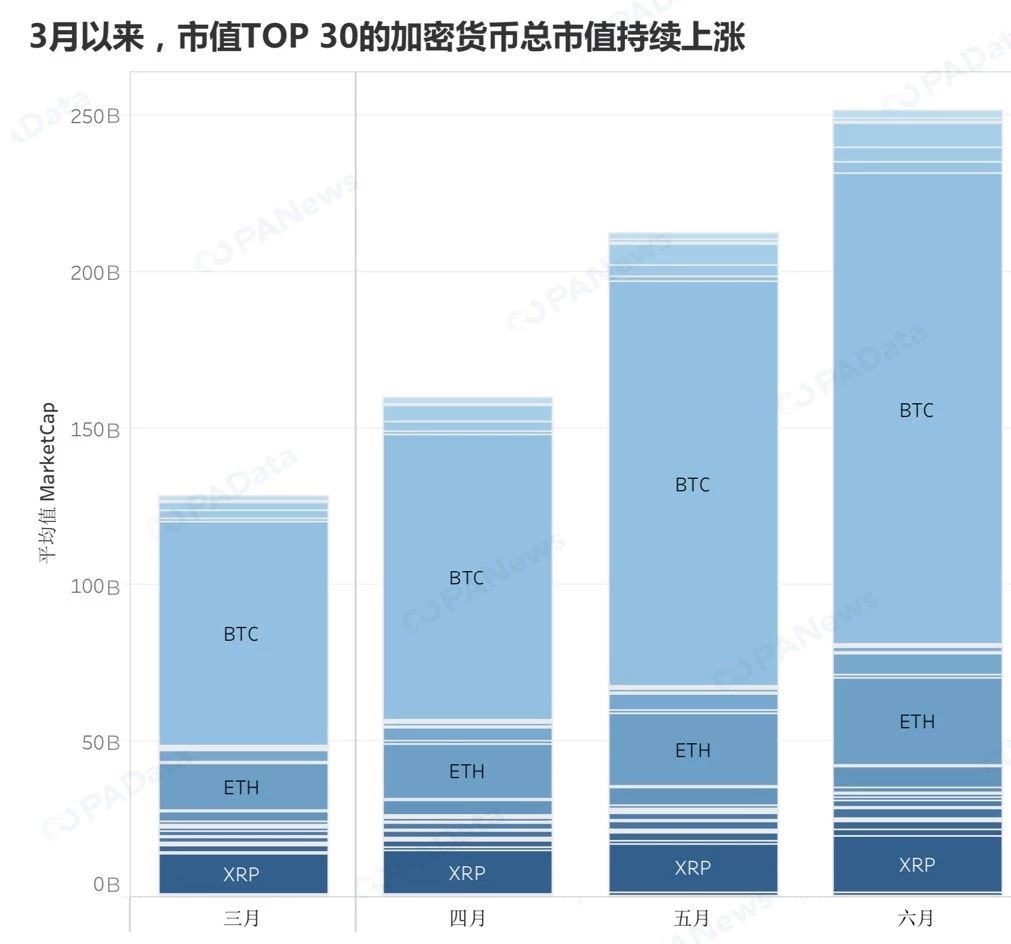
PAData analyzed the cryptocurrency discovery of CoinMarketCap on the top 30 circulation market value as of June 4. Since the end of March, the market value of TOP 30's encrypted goods has continued to rise moderately, rising from $130.4 billion at the end of March to 2432 at the beginning of June. Billions of dollars, an increase of about 86.5%. In the past 30 days, the TOP 30 currency has increased by an average of nearly 33%. The BSV once again "made a demon", the price of the currency and the market value soared by 300% in the past month.
The cryptocurrency market is still a market highlighted by the “Matthew effect”. Regular observation of changes in the cryptocurrency of the market value of TOP 30 helps to observe market trends. Prior to this, PAData analyzed the TOP 30 cryptocurrency on August 28, 2018 and March 25, 2019, respectively. It was found that BNB was strong in the exchange "new" campaign, and MKR was not in the Defi concept. It has been a sudden emergence in the bear market.
Maker fell 6th and Cosmos ranked 15th
- Taking Bitcoin and Ethereum as examples, let’s talk about making up the pitching method.
- Australia ICO new guidelines introduction
- The IPFS mining machine entered a strange outbreak, and the miners’ wool party was cleaned.
Compared with the previous two statistics, the overall pattern of cryptocurrency with a market value of TOP 30 still has little change. 90% of the cryptocurrency fluctuates within the TOP 30 range, BTC, ETH and XRP are among the top three market capitalizations, and the market capitalization rankings of BNB, BAT, GOGE, XMR, NEM and USDT are also the same as last time.
In the Maker under the Defi Aura, the market value ranking dropped by 6 places, which is the highest drop in the market value of TOP 30. At present, TRON, who was in the whirlpool of public opinion because the founder Sun Yuchen took the Buffett charity luncheon at a historically high price, its market value ranking dropped by one place from the previous statistical day, and remained basically stable. The market capitalization rankings of well-known domestic public chain projects NEO, ONT and VET also declined.
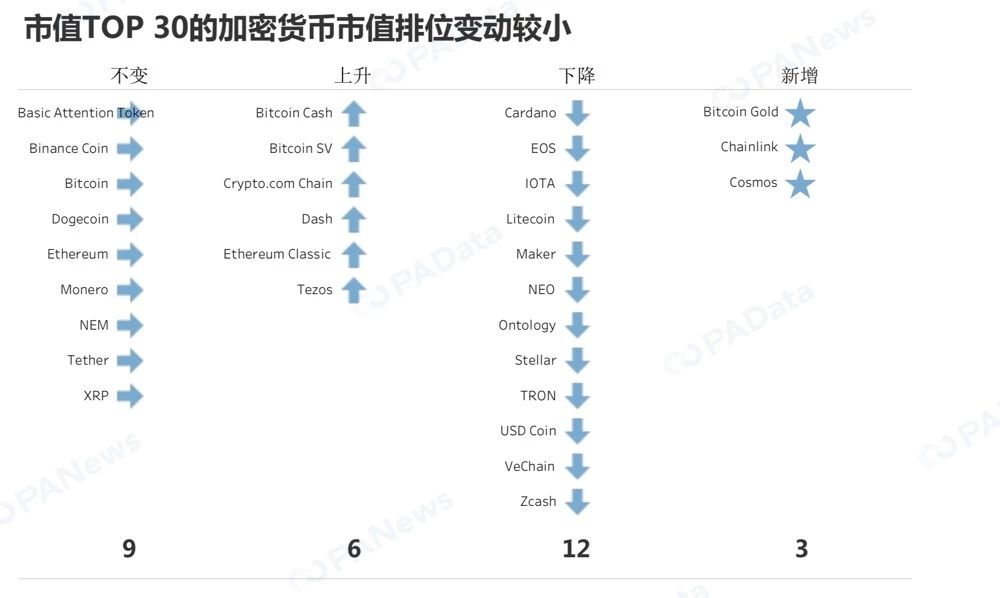
The replacement rate of this statistic is 10%, that is, there are 3 project tokens with new market capitalization TOP 30, which are BTG (bit gold), LINK (Chainlink) and ATOM (Cosmos), and WAVE replaced by TOP 30. , OMG, QTUM. Among them, ATOM has a market value of 15, BTG has a market value of 25, and LINK has a market value of 30. It is worth noting that Cosmos's token ATOM, which is mainly a cross-chain technology, only landed on major exchanges in early April. After one month of listing, the market value entered the TOP 30 visible market.
In addition, looking at the project tokens in the past TOP 30, we can see that the public chain project is absolutely dominant. The infrastructure project is mainly in line with the current stage of development of the industry, and the new TOP 30 Chainlink and Cosmos are middleware projects, which also indicates the deepening development of infrastructure and the further expansion of technology space.
The market value increased by about 33% in 30 days.
Since the end of March, the market value of TOP 30's encrypted goods has continued to rise moderately, rising from 130.4 billion US dollars at the end of March to 243.2 billion US dollars at the beginning of June, an increase of about 86.5%.
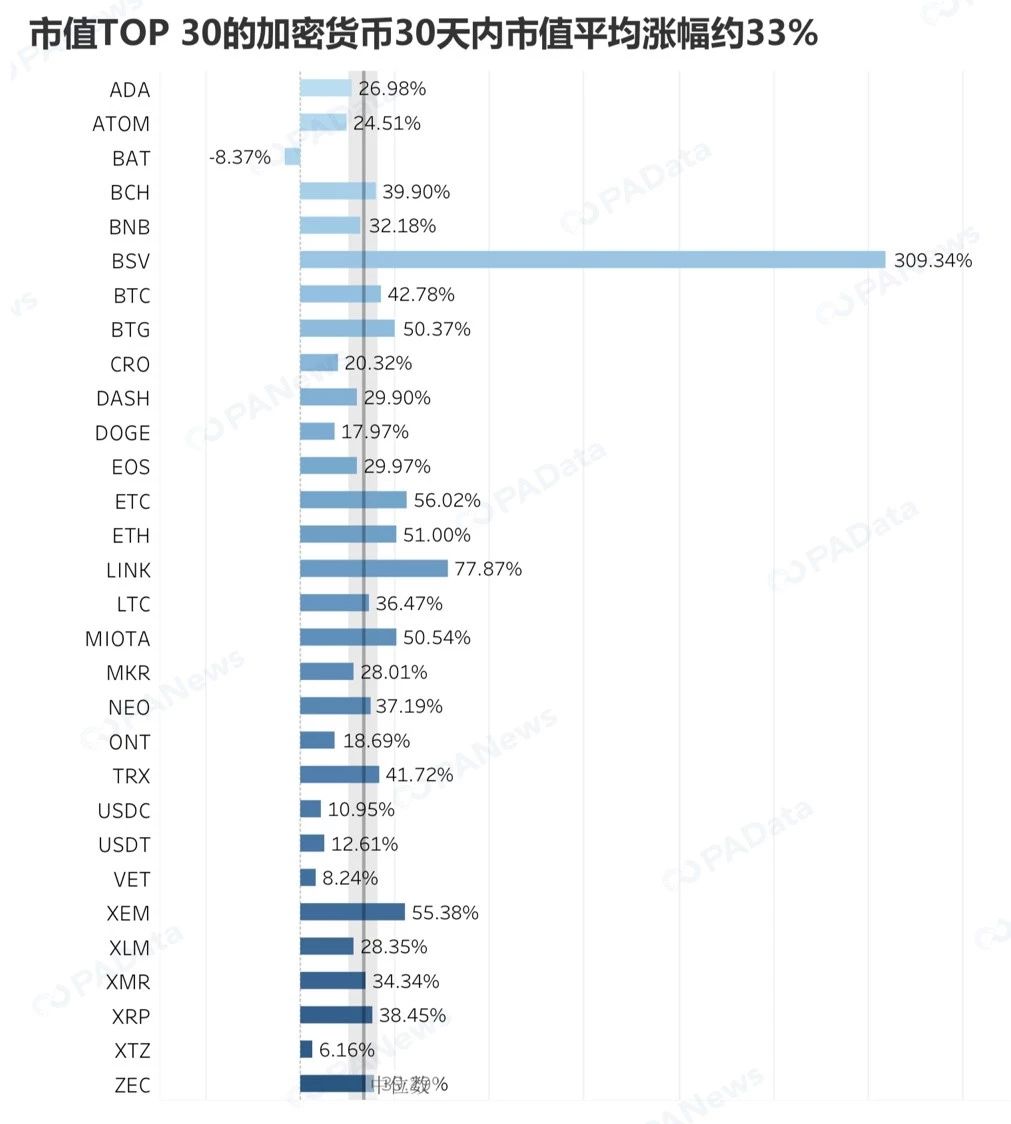
In the past 30 days, only the market value of BAT in the TOP 30 cryptocurrency fell by 8.37%. This is an attempt to solve the problem of advertisement display and user incentives in browsers, but the reason for the decline in the market is still unclear. In addition to the 29 project tokens, the market value has risen, the highest increase is the BSV, the market value has tripled in the past 30 days. BTG, ETC, ETH, LINK, MIOTA and XEM are also worth more than 50% of the market value.
Overall, under the general trend of the market, the TOP 30 cryptocurrency averaged nearly 33% (including 95% CI) in the past 30 days.
BSV surges by more than 300%, BTC has the least volatility
The TOP 30 cryptocurrency has not been issued in the past period (2019/03/25-2019/06/04), so the currency price is basically similar to the market value.
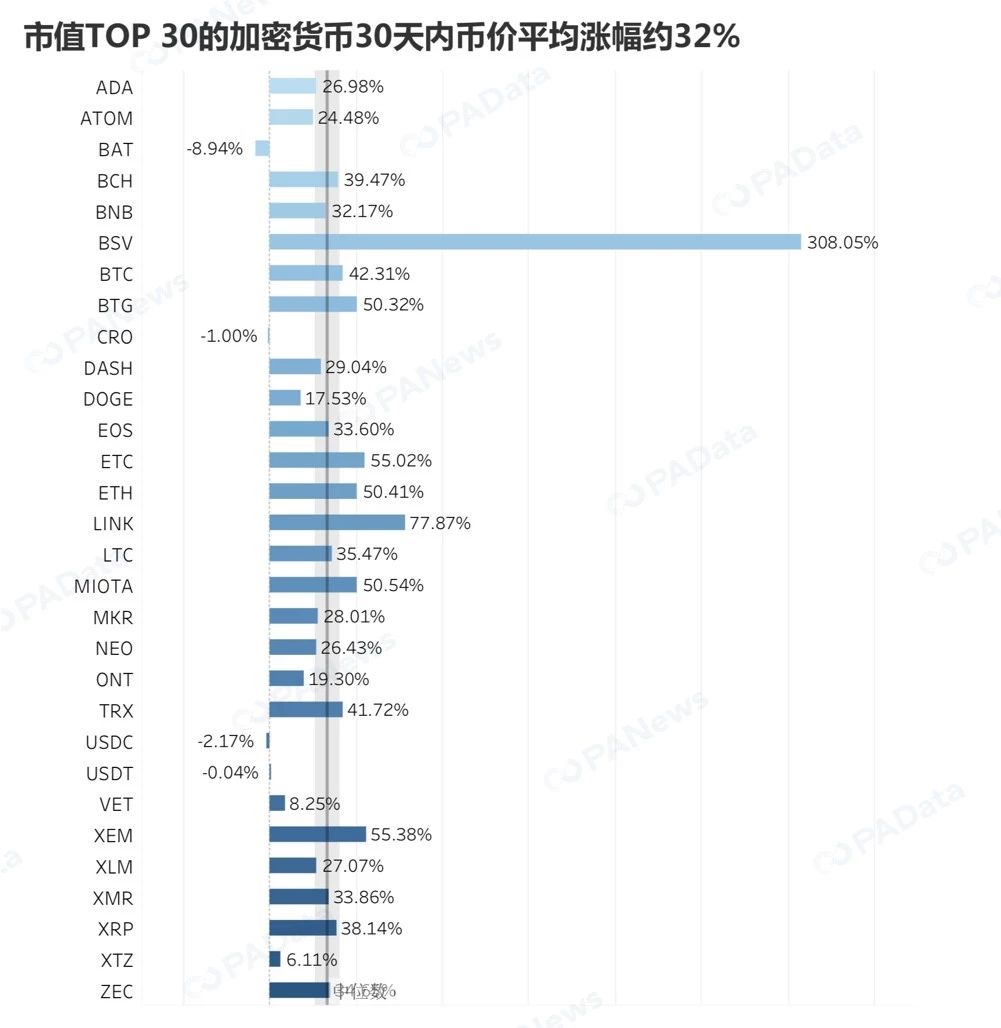
From the perspective of currency performance, BSV is the most up-and-coming currency in this round of Mavericks. In the past 30 days, the price of the currency has soared by 308%, from the closing price of $5.16 on May 3 to the closing price of $221 on June 3. This is equivalent to "eat" to the daily limit in the A-shares for one month in a row.
In addition to the skyrocketing BSV, other mainstream currencies have increased by about 32% (including 95% CI) in the past 30 days. Among them, BTC rose by about 42.31%, and BTG (50.32%), ETC (55.02%), ETH (50.41%), LINK (77.87%), MIOTA (50.54%) and XEM (55.38%) increased by more than BTC. One cryptocurrency.
If it is not a stable currency, only the price of BAT and CRO in the cryptocurrency of the market value of TOP 30 has fallen in the past 30 days, of which BAT has dropped by 8.94%.
In addition, there is no correlation between the market value and the stability of the currency price, that is, the higher the market value, the larger the plate, does not mean that the cryptocurrency is more stable. In addition to the stable currency, BTC is the smallest volatility of the market value of TOP 30. The average daily volatility in the past 30 days is only 5.96%, far below the average of 9% (including 95% CI). The volatility of Dogecoin, with a market capitalization of 28, is second only to BTC, with an average of 6.58% over the past 30 days. The volatility of MKR is also relatively low, with an average of 6.88% over the past 30 days.
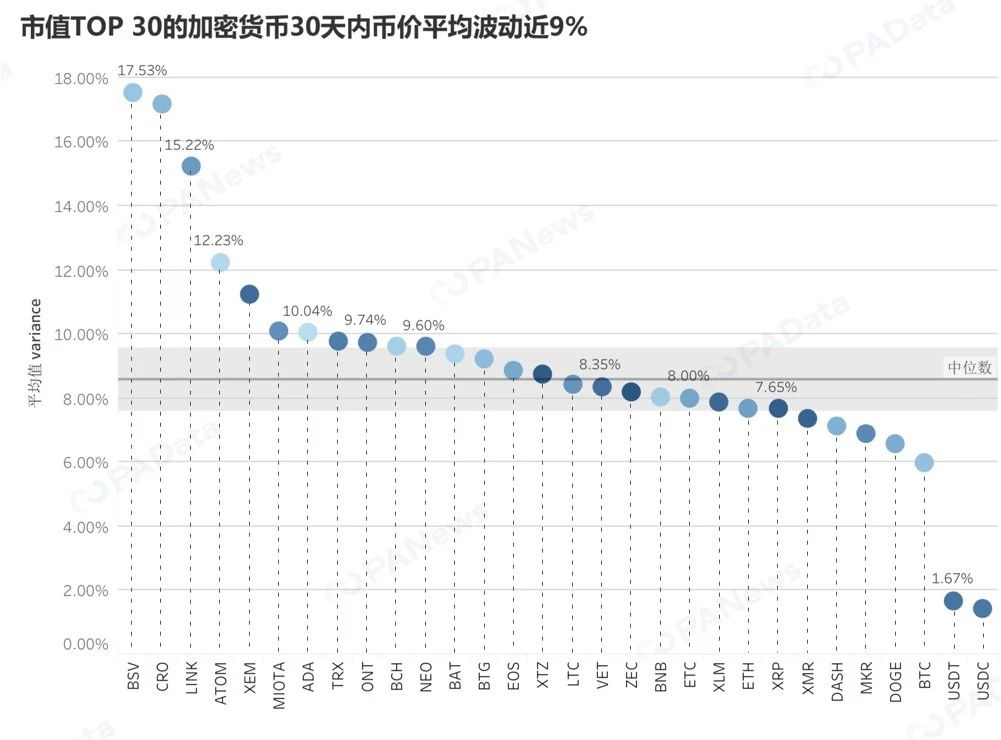
The highest volatility in the past 30 days is still BSV, with an average daily fluctuation of 17.53%. The driving force behind the BSV rise was mainly due to the impact of CW's claim to obtain the original Bitcoin white paper and most of the original Bitcoin code (version 0.1) US copyright registration news on May 21, but this sudden news can provide continuous increase. The kinetic energy is debatable. In addition, CRO, LINK, ATOM, XEM, MIOTA, and ADA have more than 10% fluctuations in the past 30 days, which is a highly volatile cryptocurrency.
The active address of BTC reached 610,000, and the difficulty of mining was raised by 11.26%.
What is the fundamentals of the transaction after Bitcoin opens the uptrend channel? According to the data of BitInfoCharts, since March this year, when the price of coins continues to rise, the number of active addresses and the number of transactions have also increased. In May of this year, the average number of active addresses was about 370,000, and the number of transactions was about 690,000, which was 100,000 and 170,000 times more than the bear market in December last year.
However, a senior cryptocurrency investor told PANews: "This wave is mainly the result of the large-scale domestic and foreign Lianzhuang pull." So in terms of time series, the number of active addresses and the number of transactions are not the same as the price of the currency. Time has gradually increased. This is different from the increase in the number of active addresses in the bull market from the end of 2017 to the beginning of 2018. This Mavericks market does not represent the expansion of the actual market size/user group.
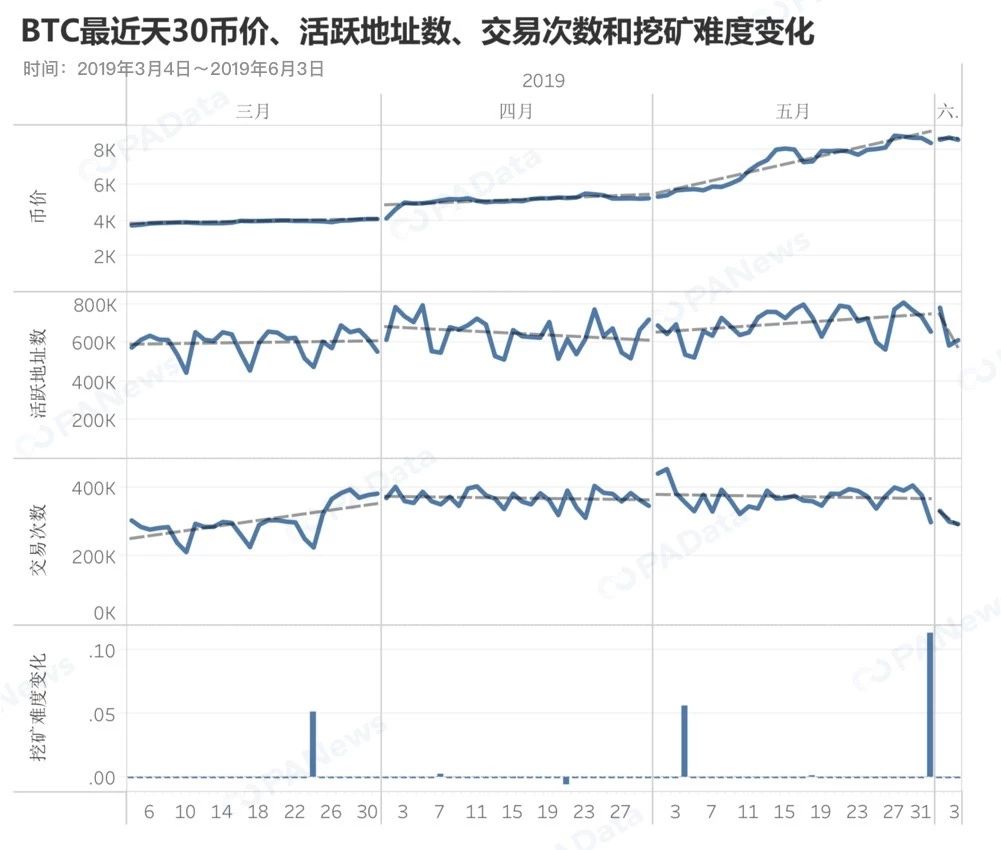
In addition, according to BTC.com data, the latest adjustment of BTC mining difficulty occurred on May 31, and the difficulty was raised by 11.26%, and the increase was above the historical average (median) level. The last difficulty adjustment over the historical average (median) level occurred on January 1, 2019, when it was raised by 10.03%, while the last difficulty over 11.26% occurred on July 29, 2018, when it was raised by 14.88. %.
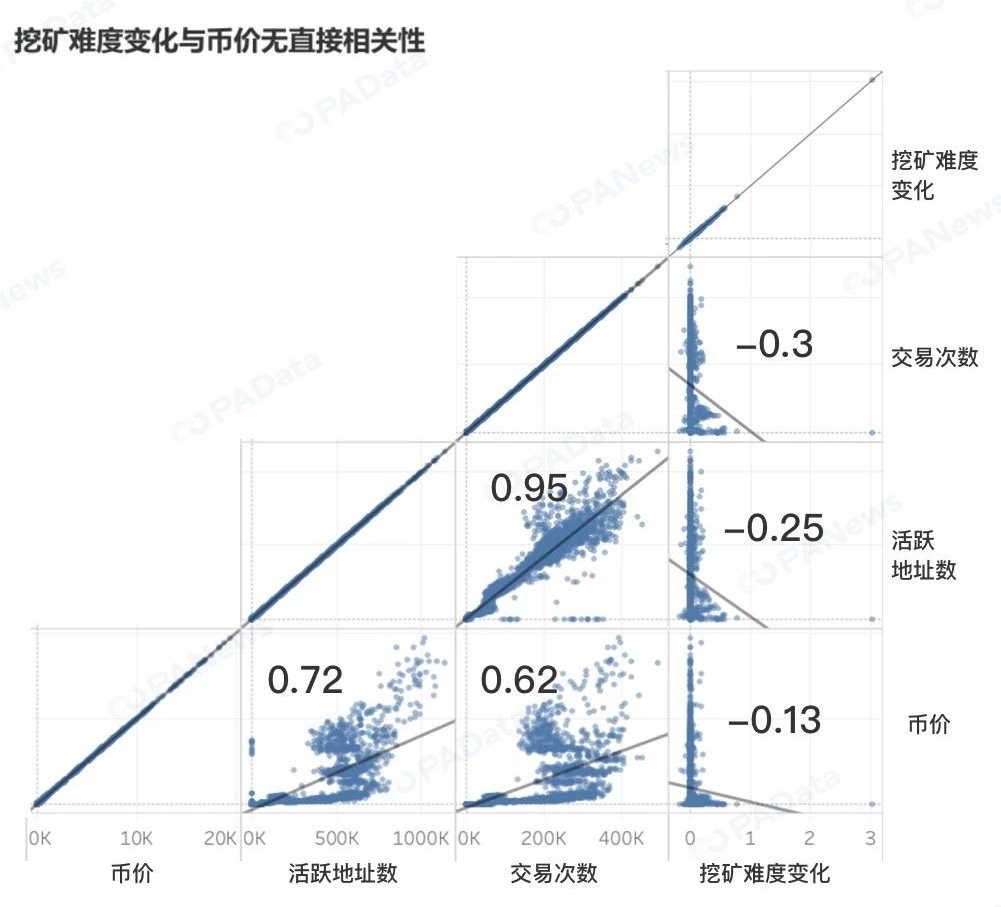
However, the increase in the difficulty of mining does not mean that the price of the currency is rising or is about to rise. According to the correlation analysis, there is no direct correlation between the extent of the difficulty of mining and the price of the currency, the number of active addresses and the number of transactions.
[1] Since the difficulty adjustment record on February 24, 2010 (0% is considered unadjusted), the median difficulty adjustment is 7.57%.
We will continue to update Blocking; if you have any questions or suggestions, please contact us!
Was this article helpful?
93 out of 132 found this helpful
Related articles
- Lightning network capacity plummeted by 13%. When will this most anticipated expansion solution be able to get rid of the simple "belief support"?
- In the second half of 2019, where is the wind vent?
- G20 began to implement a unified encryption asset standard
- Gu Yanxi: Fnality, a milestone in the evolution of financial market infrastructure
- Thailand's blockchain regulation policy and practice (Part 2)
- Yang Dong: Urgent need to strengthen supervision and governance of blockchain technology
- Russia considers setting up an encryption trading center on the Sino-Russian border


