Weekly Cryptocurrency Market Summary (09.09-09.15) NFT Market Continues to Be Lackluster, When Will the Winter End?
Weekly Cryptocurrency Market Summary NFT Market Remains Lackluster, Winter End UncertainAuthor: Jonas, Foresight Ventures
A. Market Outlook
1. Macro Liquidity
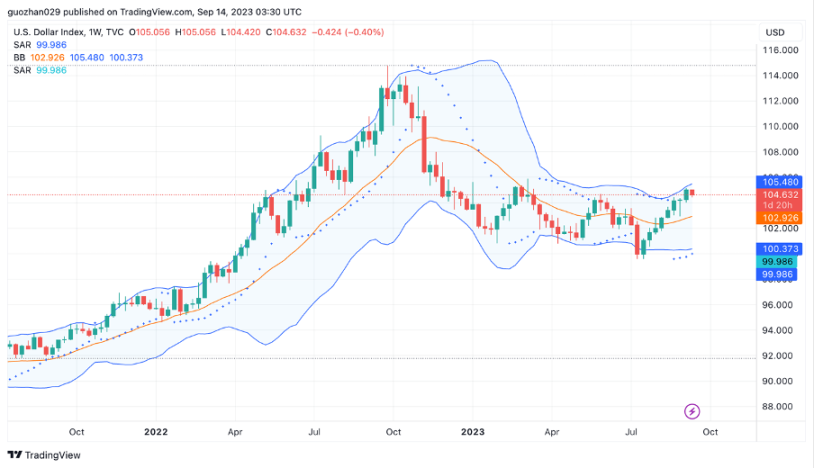
Monetary liquidity is tightening. International oil prices have surged to a 10-month high, and U.S. inflation has accelerated again in August, with the year-on-year growth rate of overall CPI rebounding for the second consecutive month. The difficulty in reducing inflation may require the Federal Reserve to maintain high interest rates for a longer period of time, and market expectations for a rate hike in November have increased. U.S. bond yields have risen, further pushing the U.S. dollar to its highest level in 6 months. U.S. stocks have collectively declined, and cryptocurrencies have rebounded following the overselling of U.S. stocks.
2. Overall Market Performance
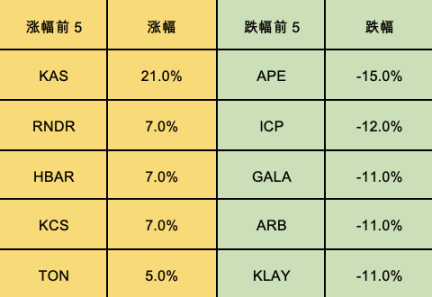
Top 100 market cap gainers:
- End of support, survival of the fittest, the battle of NFT exchanges
- Wu’s Weekly Picks CoinEX attacked, FTX’s coin selling rules, Binance US layoffs, and Top 10 news (September 9-15)
- Analyzing the two pairs of rivals – Sushiswap and Uniswap, LooksRare and OpenSea, explaining what vampire attacks are.
This week, the market started to rebound after overselling, and BTC dominance increased. The court allowed FTX Exchange to liquidate $3.4 billion worth of token assets, which is overall bearish for the next few months. The market lacks hotspots and is short squeezing around contract small tickets.
KAS: KasLianGuai is a new public chain that uses POW mining, and the project has progressed smoothly in recent times. The token has been listed on the well-known mining pool antpool; the token has been listed on the Bybit Exchange; NowLianGuaiyments has opened a payment channel.
SOL: The U.S. court has approved the sale of $3.4 billion in assets by the bankrupt FTX Exchange to repay user debts. Up to $200 million in assets can be sold each week, with a significant impact of about $700 million on SOL. However, all SOL tokens have been locked and pledged, and it is expected that linear unlocking will occur from 2025 to 2027.
MKR: A 1:12000 split will be conducted in the future, and the token will be renamed NGT, and the stablecoin DAI will be changed to NST. The underlying lending protocol will be proportionally distributed to the borrowers of collateral SLianGuaiRK. MKR has optimized the EDSR proposal, adjusting the maximum deposit interest rate from 8% to 5%.
3. BTC Market Performance
1) On-chain data
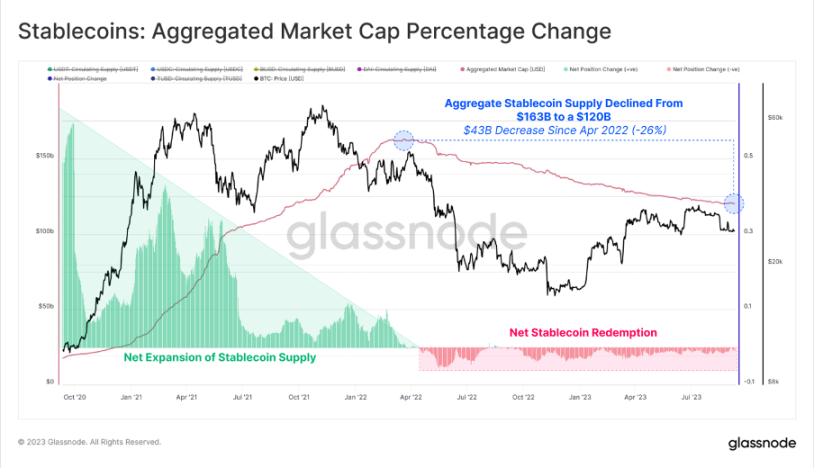
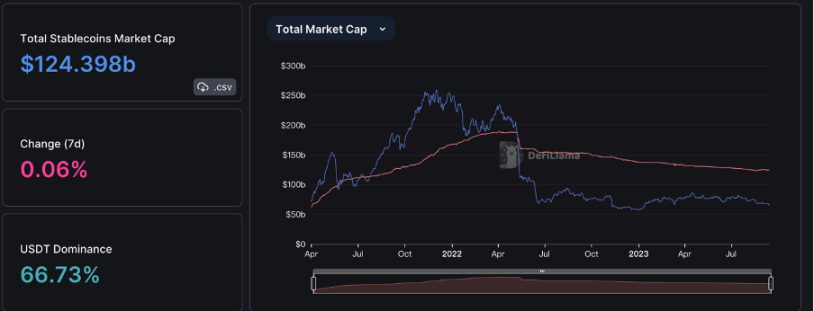
Market liquidity continues to dry up, with trading volume reaching its lowest point in history. Since late August, funds have been flowing out. Among them, stablecoins have decreased by a total of 26% since the peak in March 2022. This is the result of capital withdrawal in a bear market and reflects the opportunity cost of higher interest rates against the backdrop of U.S. rate hikes. BTC network settlement volume is at a historical low, similar to the market level in 2020.
Overall stablecoin remains stable. The current BTC price is becoming more attractive to U.S. investors, and for the third consecutive week, the total market value of USDT and USDC has been increasing, indicating that there are still many funds eager to try.
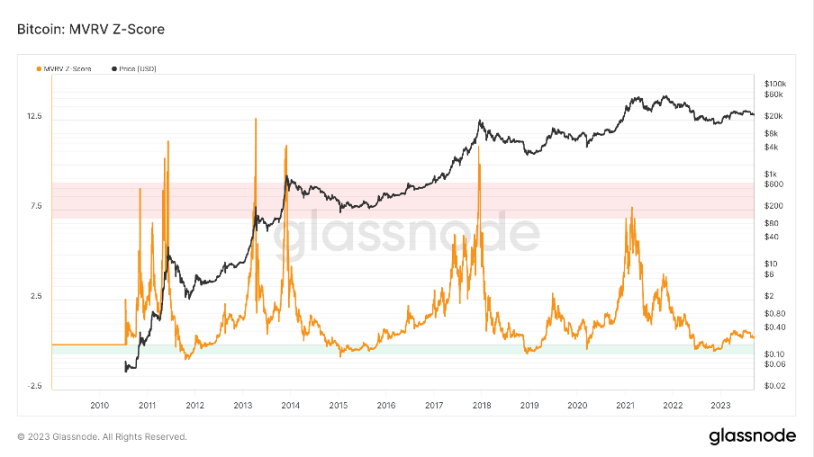
The long-term trend indicator MVRV-ZScore is based on the total cost of the market and reflects the overall profitability of the market. When the indicator is greater than 6, it is in the top range; when the indicator is less than 2, it is in the bottom range. MVRV falling below the key level of 1 indicates that holders are generally in a loss state. The current indicator is 0.44, indicating a recovery phase.
2) Futures Market
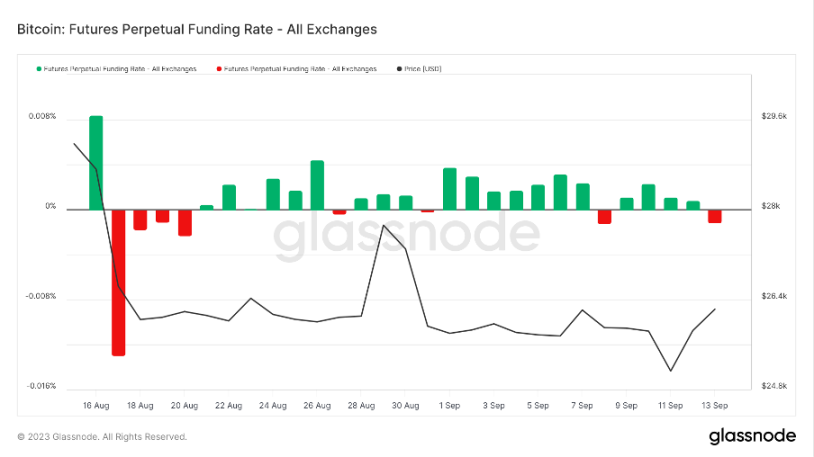
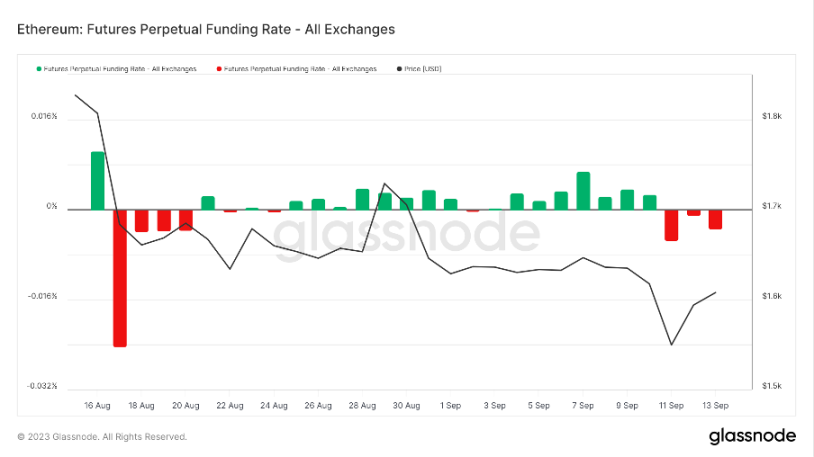
Funding rate: The rate is biased negative this week, indicating a possible short-term bottom of the market. Rates of 0.05-0.1% indicate more long leverage and may indicate a short-term top of the market; rates of -0.1-0% indicate more short leverage and may indicate a short-term bottom of the market.
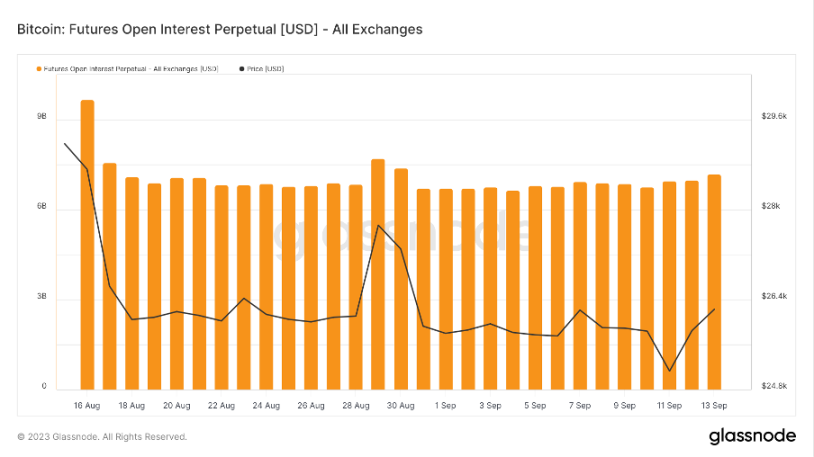
Open interest: BTC’s total open interest has increased slightly this week, indicating speculative funds entering the market.
Long/short ratio: 1.2. Retail investors have a strong bearish sentiment. Retail sentiment is often a contrarian indicator, with below 0.7 indicating panic and above 2.0 indicating greed. The fluctuation of the long/short ratio data weakens its significance as a reference.
3) Spot Market
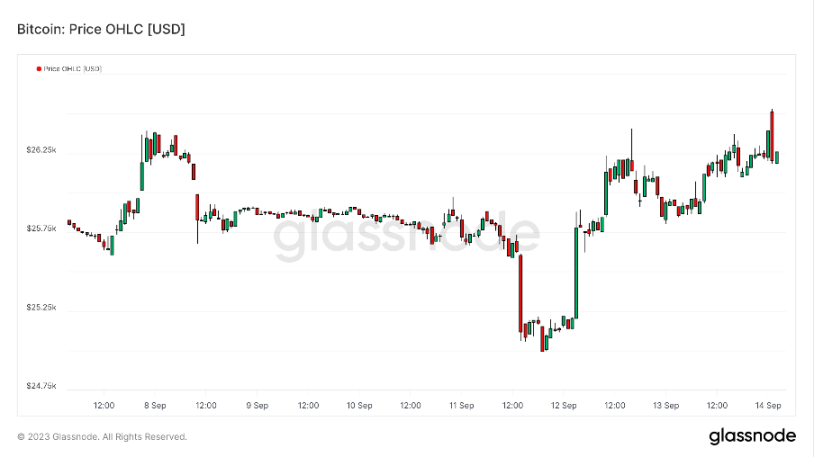
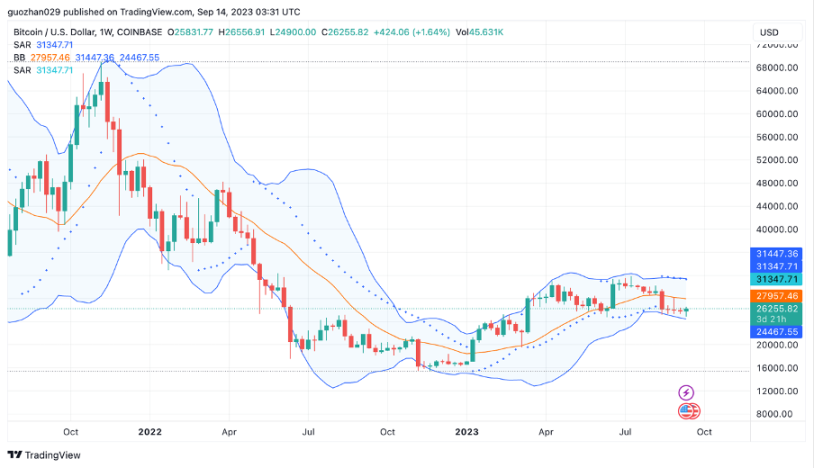
BTC has entered the B-wave rebound in the downward cycle this week. The current sentiment of retail investors in the futures market is bearish, indicating a possible short-term bottom or a squeeze in prices. The court has allowed FTX exchange to liquidate $3.4 billion in token assets, which may have an overall bearish impact in the coming months. The real bull market may still be more than six months away, so it is recommended to gradually increase positions during market declines.
B. Market Data
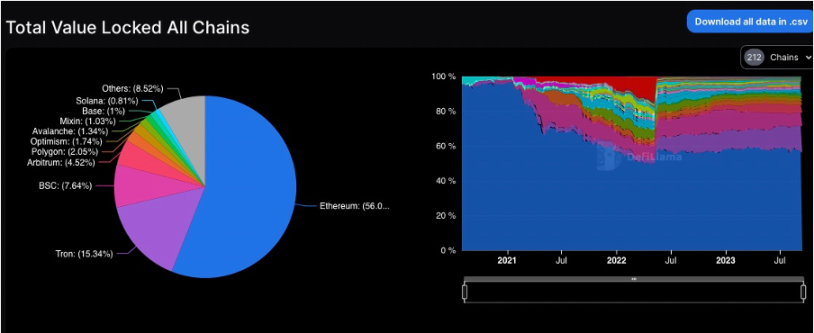
1. Total Lock-up Amount of Public Chains
2. TVL distribution of various public chains
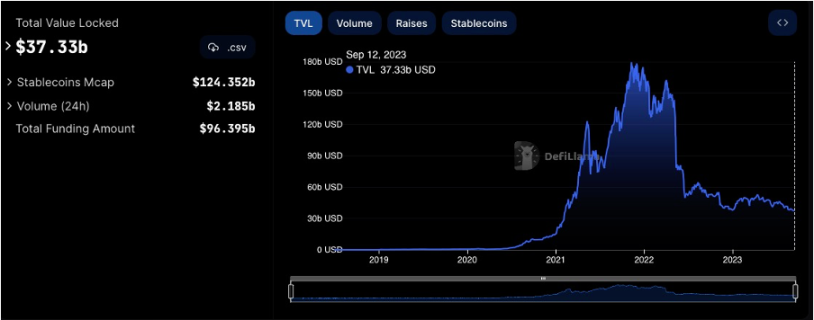
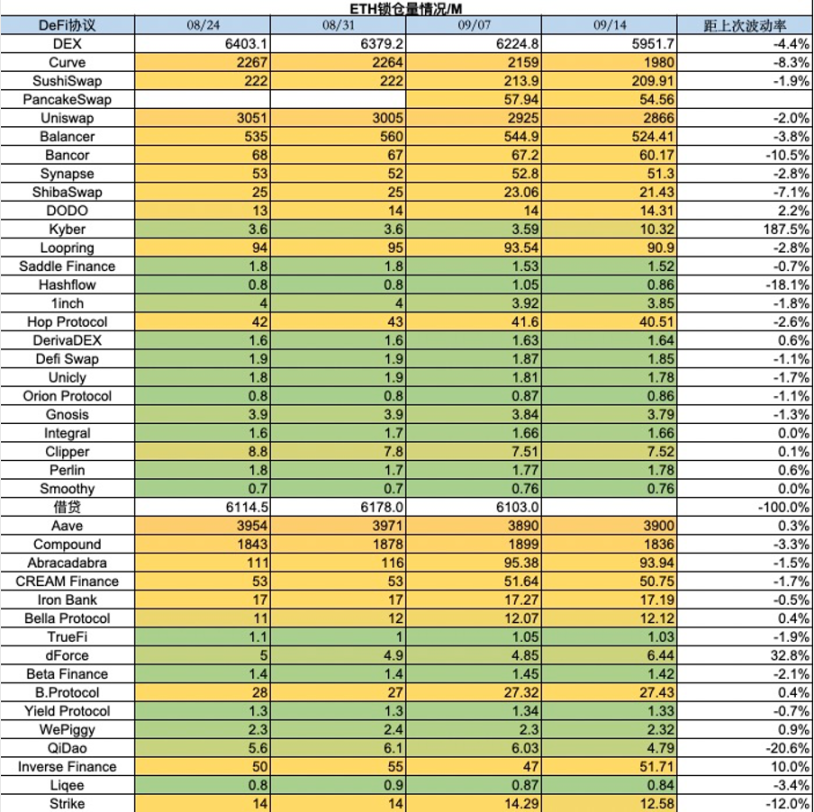
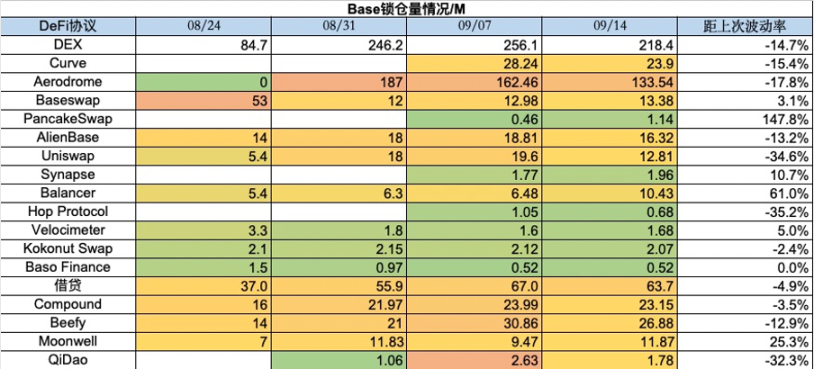
This week, the overall TVL decreased by 0.5 billion, with a decrease of 1.3%. In recent weeks, TVL has continued to decline. This week, the ETH chain decreased by 2.9%. Except for the TRON chain, other chains also experienced a general decline. The market’s tepid sentiment continues. BASE chain, which has performed well in recent weeks, also declined by 9.8% this week. However, at the same time, it surpassed the overall protocol count of the SOLANA chain, with a total of 116 protocols on the BASE chain.
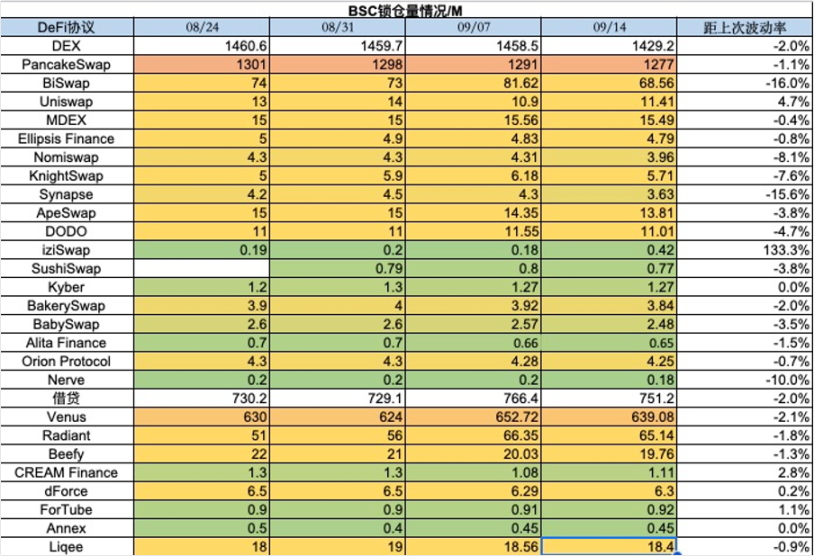
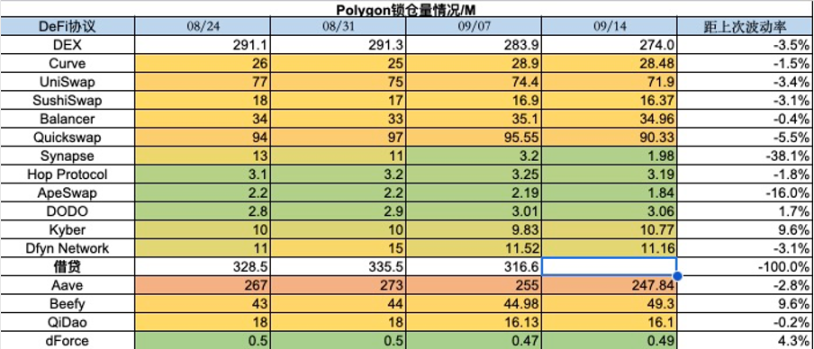
3. Lock-up volume of protocols on various chains
1) ETH lock-up volume
2) BSC lock-up volume
3) Polygon lock-up volume
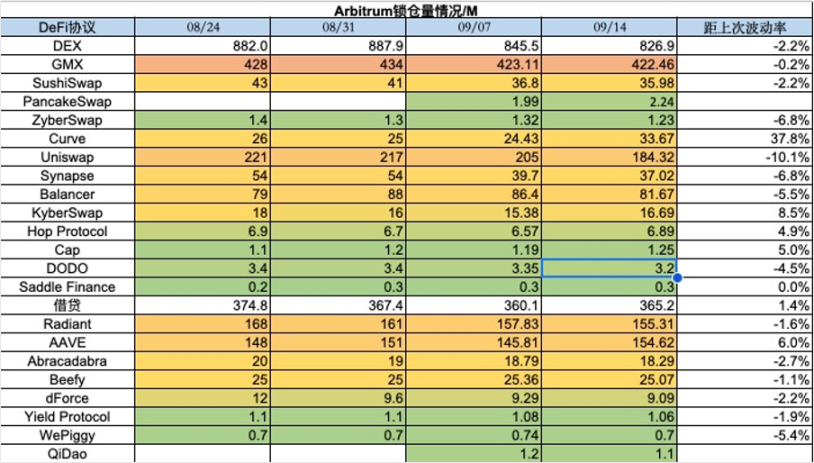
4) Arbitrum lock-up volume
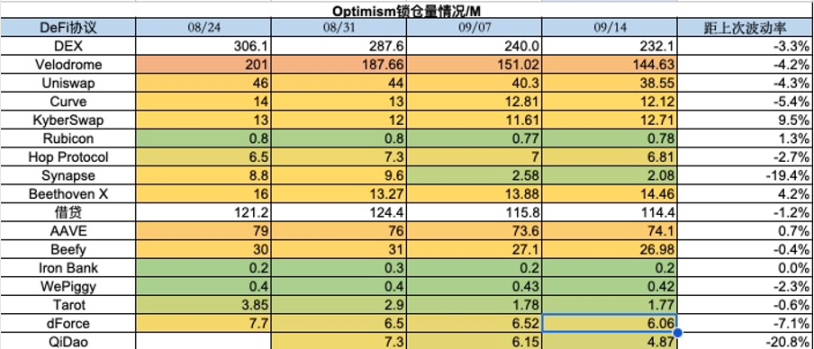
5) Optimism lock-up volume
6) Base lock-up volume
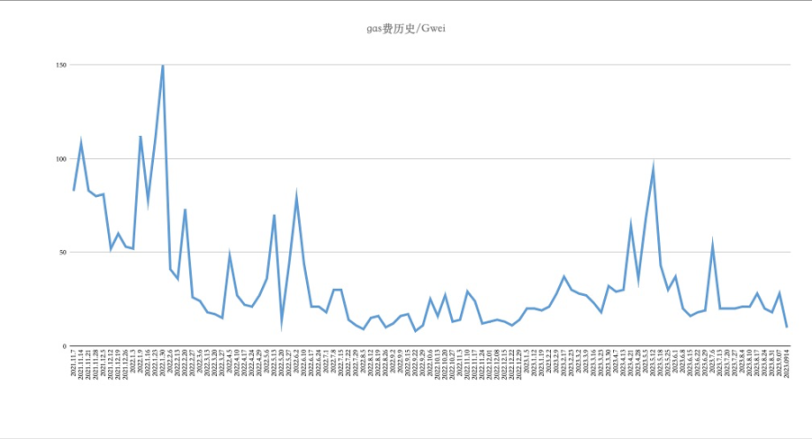
4. Historical ETH Gas Fee
The on-chain transfer fee is about 0.97, the Uniswap transaction fee is about 3.31, and the Opensea transaction fee is about $1.28. This week, gas fees experienced a significant decline. Although the past week witnessed a slight increase in BTC, on-chain applications and transactions have not yet recovered, and the NFT market remains sluggish. In terms of gas consumption, Uniswap still occupies the top position, accounting for 12.98% of the entire market.
5. NFT Market Data Changes
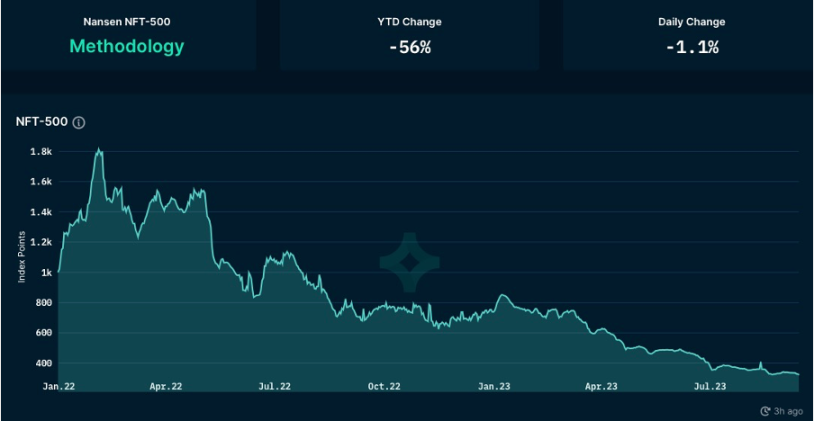
1) NFT-500 Index
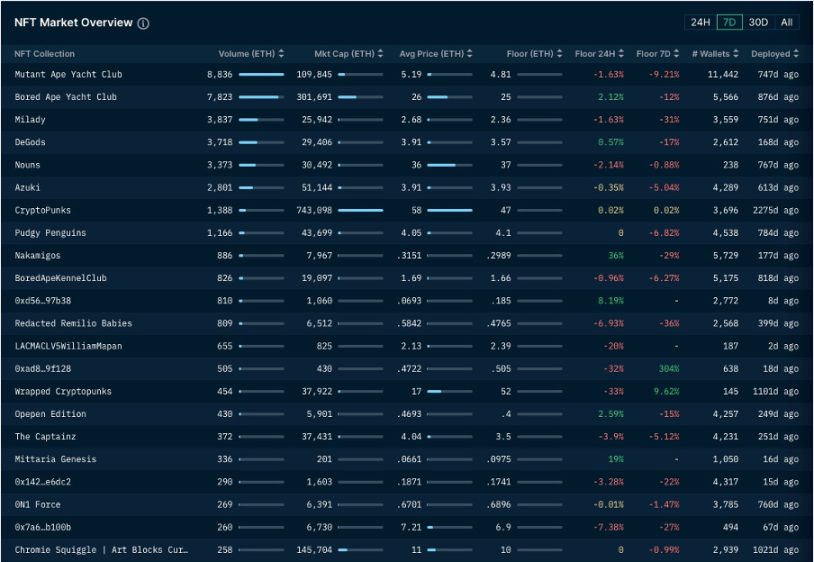
2) NFT Market Situation
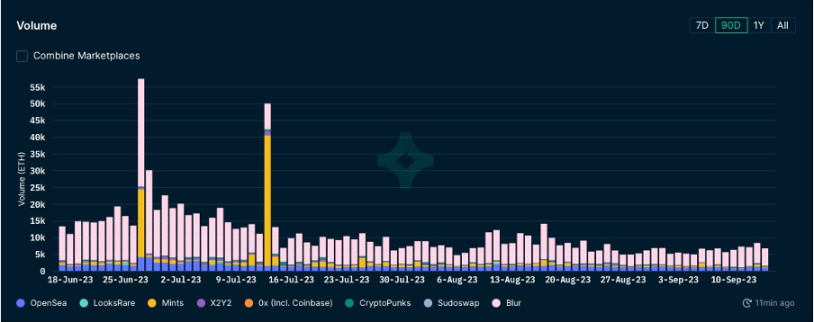
3) NFT Trading Market Share
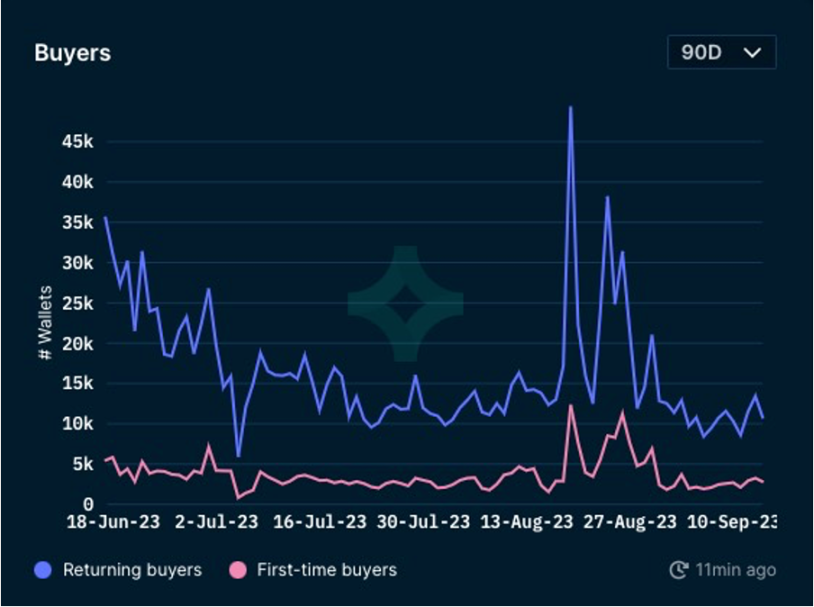
4) NFT Buyer Analysis
This week, the floor price of top blue-chip projects has dropped across the board. BAYC has experienced a 12% drop, MAYC also dropped by 9%, and Milady has dropped by as much as 31%. The total number of wallets and repeat buyers are both showing a downward trend. The overall market sentiment is extremely subdued, and the number of first-time buyers is also significantly affected by the depressed market.
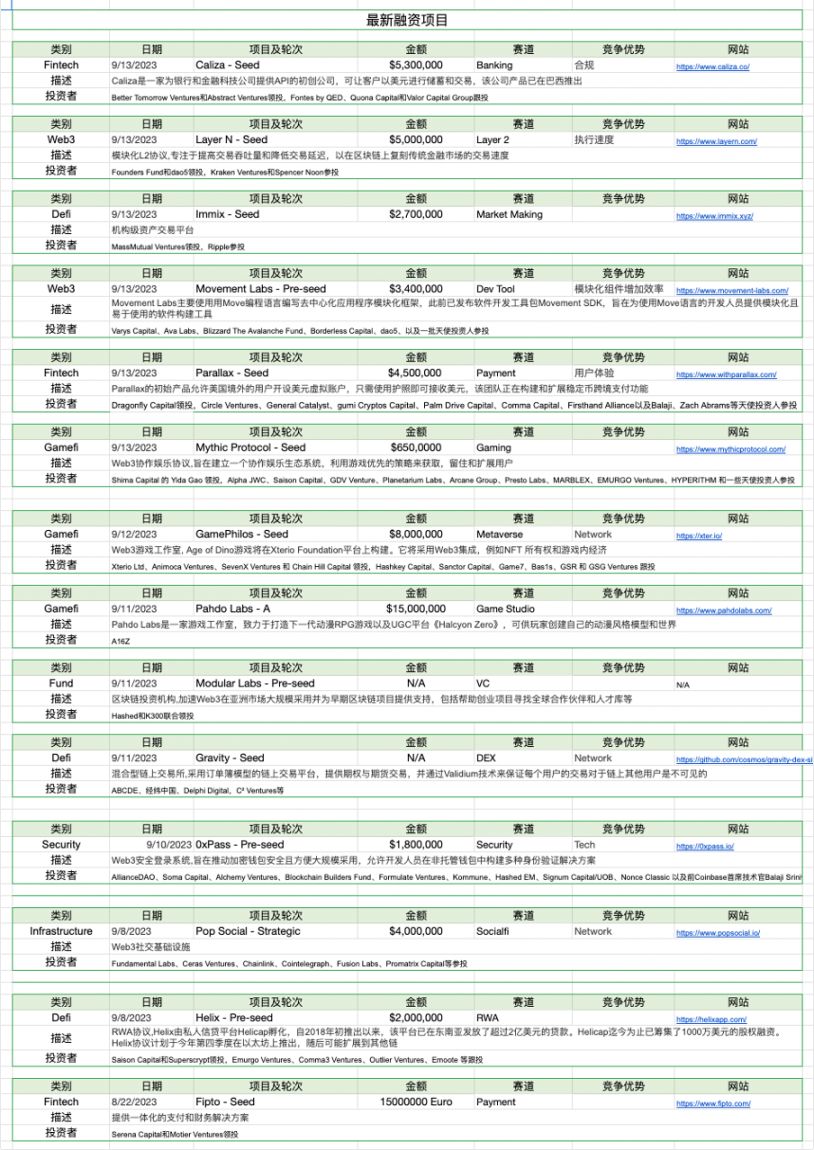
5) Latest Financing Situation of Projects
We will continue to update Blocking; if you have any questions or suggestions, please contact us!
Was this article helpful?
93 out of 132 found this helpful
Related articles
- Analysis of the current status of the four mainstream Layer2 solutions Arbtrium occupies more than half of the market share, while Zora’s monthly number of creators has increased by over 97%.
- LianGuai Morning News | Bitcoin network fees increased by 40% this week, with an average of 30 BTC per day.
- Fuel NFT and Market Ecosystem Inventory
- Will the arrival of various ‘X’ RC-20 standards be the future of Bitcoin?
- Bitfinex Cryptocurrency market funds outflow reached $55 billion in August.
- Under the bold political reforms, can El Salvador, which embraces Bitcoin, replicate Singapore’s successful path?
- Comprehensive Analysis of Bitcoin ETF
