5 indicators and 4 ratios for cryptocurrency fundamental analysis

This article uses five indicators and four ratios to help you understand the basic principles of the cryptocurrency market. Currently, I use these metrics on the Bitcoin network and have a directional discussion of the investment plan.
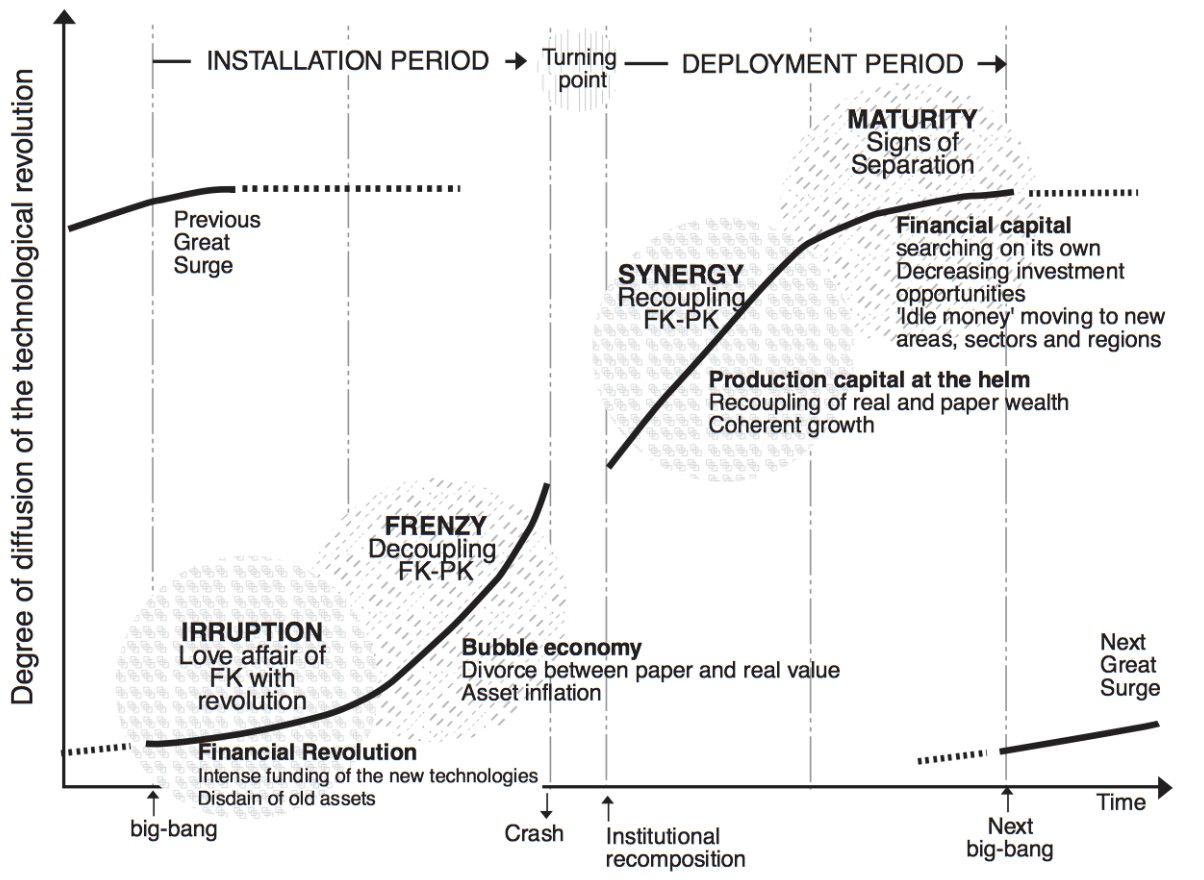
Many companies use a discounted cash flow (DCF) model to value a project. I've read some top-level cryptocurrency fund reports, based on the model and some assumptions, for a bottom-up analysis of the revenue generated by a particular crypto asset. For example, here is a great EOS analysis and evaluation model. I think this is a good approach, especially when the market is mature and transitions from the crazy phase to the synergy phase (see below) according to the technical revolutionary model of Carlota Perez. But for now, I think that this method will not be of much use in view of the current economic cycle, and I prefer to use actual data to calculate relative value.
- China's central bank's digital currency "gets better"; Litecoin successfully halved
- From the perspective of ecology, income, advantages and disadvantages, what does the Staking concept bring to the industry?
- The bank sent Bitcoin to employees and is now serving cryptocurrency companies.
Figure 1 Cycle of technology trends (Source: Perez's "Technology Revolution and Financial Capital")
I believe that we have just finished the split stage and started a new phase of the crazy phase of the long wave economic cycle, which I call the era of autonomy. In the mad phase, price and value are completely detached, which is why people call this era a “golden age”, which is completely different from the “golden age”.
Many people have experienced the Internet boom of the 1990s, and people have tried to propose a new valuation model for the new economy, which was considered page views. If you want to try to assess the value of a network company at the time, the discounted cash flow model does not help you. At this point, you can invest in the technological revolution or propose a new framework for modeling these assets.
Since we are in the early stages of the avid phase, it makes no sense to try and evaluate these encrypted assets from the DCF model. Most companies don't even have income or profit (or not a lot). After 10-20 years, when we are in the synergy or maturity stage, it makes sense to use the DCF model. Even though these encrypted assets do not yet have cash flow, they still have potential value.
At this stage, I think the most important thing is to build our framework using relative value and focus on making directional decisions based on the following major reserve cryptographic assets, Bitcoin. Investors usually have to buy bitcoin before they can invest in any other crypto asset. Therefore, tracking the use of reserve assets can provide a large amount of overall information about the encryption market. We need to think of these cryptographic assets as a network and propose a model for how we evaluate the network. We also have some experience in this area.
1. Network Effect & Metcalfe's Law
Most cryptographic assets have a network effect. Network effects are attributes of an asset or collection. As users increase, their value to existing users increases. Metcalfe's law states that the value of the network is proportional to the square of the number of connected users. This basic version has proven to be wrong, and the network value is more likely to be an s-curve than just an n2 quadratic curve. Most cryptographic assets are networks and have a network effect, and user and usability are important considerations when considering how to value assets. Most of the indicators in the basic analysis framework of this paper focus on the users, usage, and utility of the indicator, followed by the ratio of price to utility.
2. 5 indicators and 4 ratios
The following are the 2 categories of the five indicators, namely the direction indicator, the current use indicator, and then we also have two types of four ratios, the current valuation ratio and the long-term valuation ratio.
2.1. Directional indicators
These indicators show the continued direction of the two main short-term indicators, which are the most sensitive and short-lived of the five indicators.
NVT Direction Indicator – This shows the direction of the valuation ratio, either moving in the direction of increasing relative value or moving in the direction of losing relative value.
Related Direction Indicators – Shows whether the correlation of encrypted assets has increased or decreased. If the correlation of encrypted assets is getting stronger, it usually means a bear market, and the lower the asset correlation, the more the encryption market is.
2.2. Current usage indicators
These metrics measure direct network usage and utility. These indicators indicate that the current network utility is expressed as: 1) the number of independent users per day; 2) the daily transaction amount (US$); and 3) the mining fee, which is the income generated by the network. If the encrypted network is used by more people every day and is used to move more value, its intrinsic value will increase.
Unique Addresses (Daily) – This shows the unique address used in daily transactions and is a relative indicator. If the trend of the number of unique addresses is increasing, this is a bull market for the encryption market.
Transaction Value (Daily) – Shows the sum of the daily dollar valuations for each transaction, which is a relative indicator. If the volume of transactions increases, this is bullish for the encryption market.
Mining costs (daily) – the cost of the miners for the transaction. If the cost is moderate, this is bullish for the encryption market. If the cost is very low, such as less than 20 cents, or very high, such as above $20, this is a dangerous sign for the encryption market, indicating a problem and further investigation is needed.
2.3. Current valuation ratio
These ratios track current relative network values, which are similar to the price-to-earnings ratio of the stock market and are one of the core valuation indicators for cryptocurrency analysis. The MVRV ratio is a similar but more complex ratio because it tracks the transaction price at the time of the last trade, which allows you to understand the speed of the trade.
NVT ratio : less than or equal to 55 in the bull market, greater than or equal to 75 in the bear market;
MVRV ratio : less than or equal to 1.2 when underestimated, and greater than or equal to 3.2 when overestimated.
2.4. Long-term valuation ratio
These ratios track long-term relative network value. The Mayer multiple is based on the 200-day moving average. This gives a ratio of time to past transaction price. The P/E ratio shows the value ratio of the price to the miner's breakeven cost, which gives a ratio to the production cost.
Mayer multiple: bullish when less than or equal to 1.0, bearish when greater than or equal to 2.4;
Mining price-earnings ratio : bullish when less than or equal to 1.2, bearish when greater than or equal to 3.2.
3. Interpretation
It is important to learn how to use these metrics and ratios to guide your decision making and investment plans. Here are a few different modes that let you know how to use this metric and how to interpret it.
3.1. In the downward trend of the network, its early indicators indicate that there may be a trend reversal
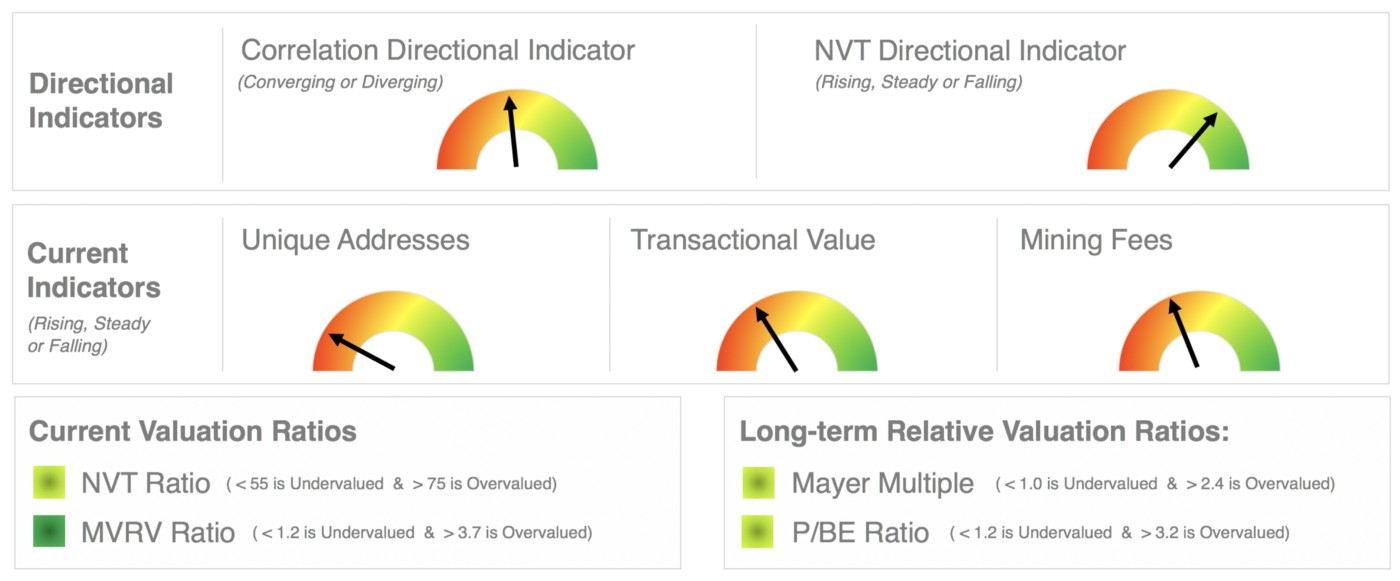
Figure 2 Fundamental analysis of July 28, 2019
The dashboard above shows that network usage and utility are declining, as you can see in the current metrics. However, its usage rate may be close to the trend reversal. The NVT direction indicator you see is green, which means that either the usage is rising or the price has dropped enough that the NVT ratio begins to show more relative value. In the ratio, all ratios are green or dark green, indicating the existence of relative value. In the long-term relative valuation ratio, you won't get dark green unless you are at the end of the bear market cycle and the market is terrible. We saw dark green earlier this year, but we are unlikely to see this again for a while.
3.2. An overrated network
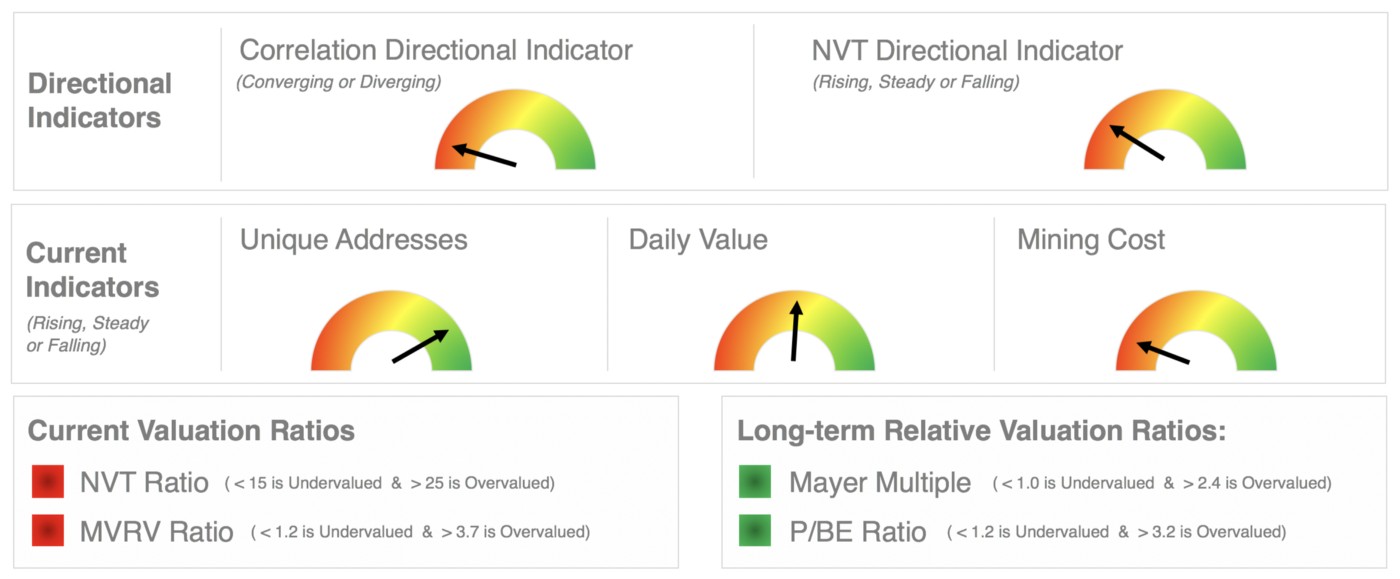
Figure 3 Note: The dashboard shows the indicators as of February 10, 2019.
The market shown above has collapsed and has taken a lot of down pricing, but the valuation is too high, still in a bear market, and may turn up because of the increase in usage. At the end of the winter of cryptocurrency, you will eventually begin to see the deep value of the long-term ratio. This may last for a while until there are real signs of returning to the market. When the current valuation ratio catches up with the long-term valuation ratio, you will know when to enter the market.
3.3. Networks that show an upward trend in network utility and depth value
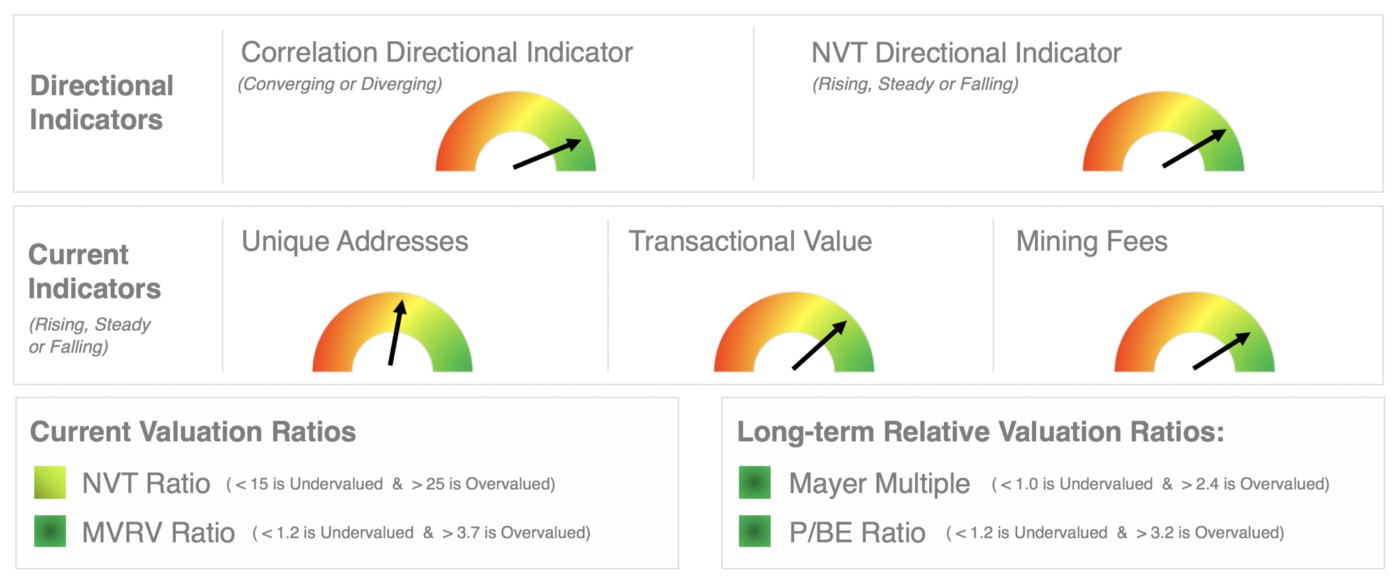
Figure 4 Note: The dashboard shows the indicators as of March 11, 2019
The above picture shows that a market has now bottomed out, indicating that its value is underestimated, while network utility is showing utility and use to grow in the network. This is how the cryptocurrency market begins to bottom out and prepare for the reversal of the uptrend. Prices have fallen so much that all ratios show relative value, and current indicators show improvements in usage and utility. In addition, the direction indicator shows positive activity. This is the reversal of the trend after the cryptocurrency in winter. Now, as usage increases, investors can consider starting to invest more or just more.
3.4. Network trends that are rising faster than usage
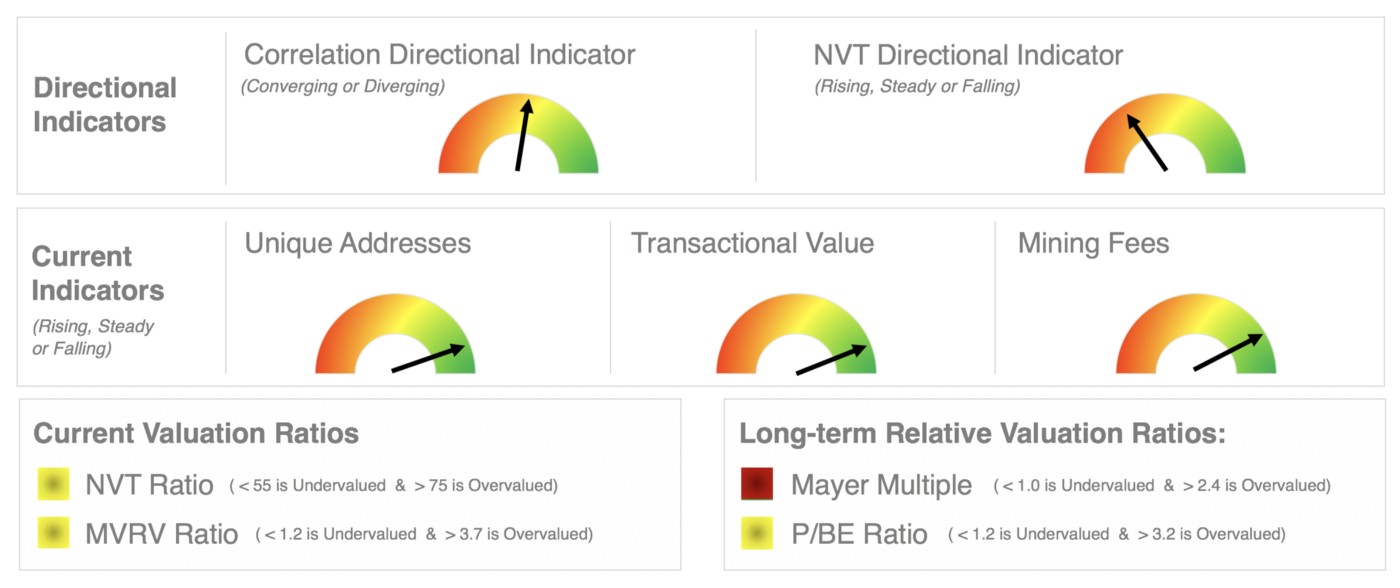
Figure 5 Note: Dashboard showing indicators for June 26, 2019
The market shown above shows the utility through additional use, but it may run too far, too fast, and need to be integrated. Current indicators show that usage is rising and is on a positive upward trend. However, the current valuation ratio shows that prices are rising faster than usage. You will also notice that the NVT direction also shows this. With these yellow ratios and red long-term valuation ratios, you may be able to close your position and make a profit.
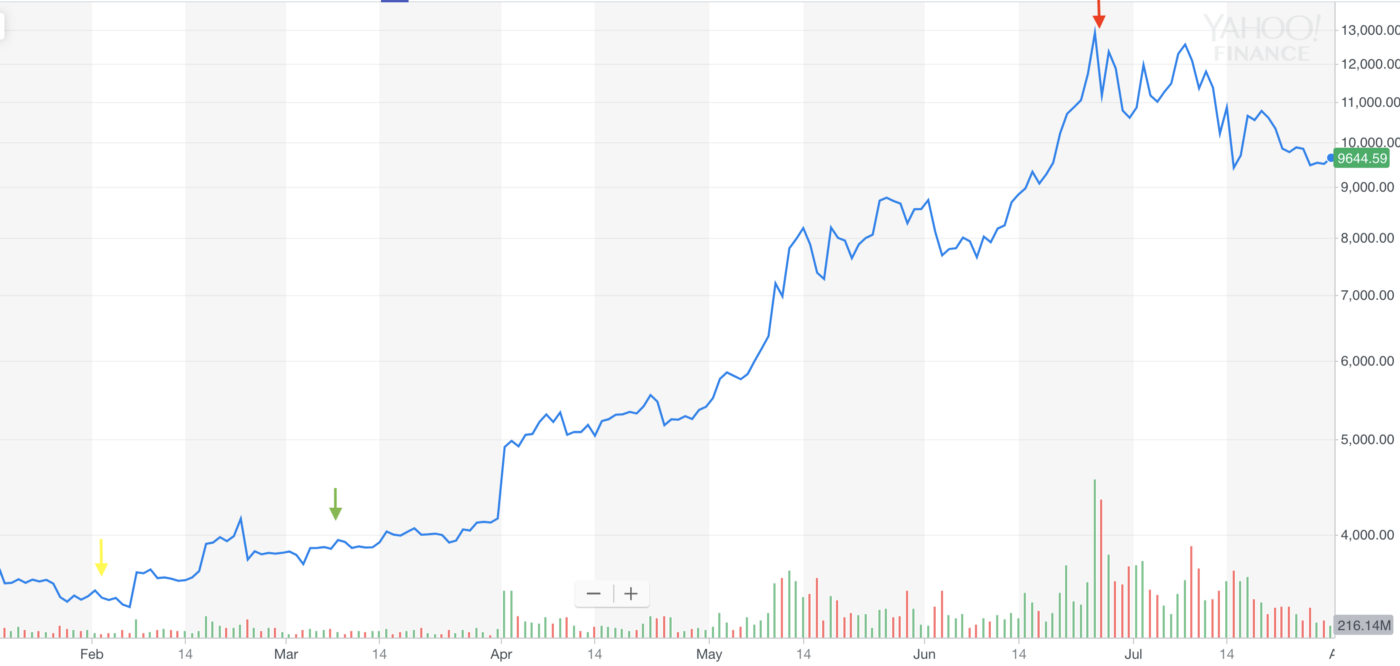
Figure 6 BTC historical price
If you look back at the history of bitcoin transactions, the fundamentals will help your trade. Fundamental analysis of the Bitcoin network shows when bitcoin value is undervalued (usually from a large correction during a long-term bear market), when bitcoin usage is on the rise, or prices are rising too fast. This is illustrated by the date of the network indicator on the Bitcoin price chart.
4 Conclusion
This paper uses these five indicators and four ratios in the core framework of fundamental analysis. We use a layered approach to basic analysis, which is the first layer. These metrics are only extracted from the Bitcoin network and used to make the first wave direction decision.
Now, the relevance of crypto assets has been reduced, usage has increased, and crypto assets have also shown value, which means that the end of encryption winter, a new bull market cycle has begun. Bitcoin's price action has risen strongly through several key resistance levels, as evidenced by this. As we continue this cycle, it is important to use the direction indicator as the most sensitive indicator of time. The current usage indicator warns when usage and utility slow down, and the valuation ratio warns when the price may be overestimated. With this, fundamental analysis should provide investors with more data to make informed investment decisions.
Source: Hackernoon
Author: Jake Ryan
Translation: Bitker Institute
Website: https://hackernoon.com/crypto-fundamental-analysis-part-ii-ix7fe31e3
Disclaimer: This article was compiled by Bitker Research Institute. The Bitker Institute focuses on theoretical exploration, technology development, and secondary market analysis in the blockchain industry.
We will continue to update Blocking; if you have any questions or suggestions, please contact us!
Was this article helpful?
93 out of 132 found this helpful
Related articles
- How to mitigate the effects of manipulation when investing in cryptocurrencies?
- Babbitt column | Central bank digital currency is a kind of "nickel coin"
- Popular science | mining industry panorama
- Interpretation of the central bank's digital currency: to replace cash, mainly for small retail scenes
- Regarding the fact that Litecoin did not have any development progress in 2019, founder Charlie Lee responded
- Babbitt column | How will the digital currency "China team" change the future?
- If the Indian encryption ban is approved, 40,000 BTCs will enter the market.


