60 sets of data reveal the global changes in the Bitcoin mining landscape, market size, and energy consumption statistics.
60 data sets show global shifts in Bitcoin mining, market size, and energy usage.Source: Techopedia; Translation: WEEX Exchange
In the fast-paced world of digital currency, Bitcoin has become a phenomenon, attracting the attention of global investors. The core of this revolutionary cryptocurrency is a process called “mining,” which drives the operation of Bitcoin and has a significant impact on the entire blockchain ecosystem. This article will delve into Bitcoin mining and energy consumption statistics, and why “mining” is crucial for the development of Bitcoin and the environment.
Whether you are an experienced investor or a newcomer to the cryptocurrency field, understanding the ins and outs of Bitcoin mining is essential to grasp the true potential of this digital asset. Therefore, let us explore the fascinating world of Bitcoin mining, elucidate its importance, and provide you with key information you need to know.
Compilation of Bitcoin Mining Statistics
-
In May 2023, the global annual electricity consumption for Bitcoin mining is estimated to be about 95.58 terawatt-hours (TWh).
-
It is estimated that Bitcoin consumes 60%-77% of the global electricity consumption for cryptocurrencies.
-
Bitcoin mining has a total market value of 8.11 billion US dollars.
-
Bitcoin miners earn a daily income of 27.7 million US dollars.
-
The United States has the largest Bitcoin mining industry in the world, accounting for over 38% of the total network hash rate.
Bitcoin Mining Energy Consumption Statistics
Bitcoin mining energy consumption has become a widely discussed and scrutinized issue. With the popularity and soaring value of Bitcoin, the energy required for mining new coins and maintaining the blockchain has also increased.
According to The New York Times, in Bitcoin’s early days when its followers were limited, a desktop computer could effortlessly mine cryptocurrency in a matter of seconds. However, nowadays, it takes about “9 years of typical household electricity consumption” to mine a single Bitcoin. In May 2023, Bitcoin mining is projected to consume approximately 95.58 TWh of electricity; its annual electricity consumption for 2022 reached 204.5 TWh, surpassing the national electricity consumption of Finland.
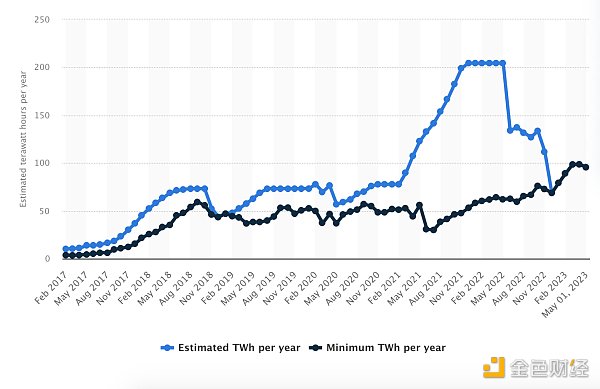
Figure 1: Estimated electricity consumption for Bitcoin mining, minimum electricity consumption (TWh/year)
According to a report by the White House, the total energy consumption of Bitcoin mining in the United States in 2022 reached 50 billion kilowatt-hours (kWh), highlighting the enormous scale of energy usage. The electricity consumed by Bitcoin mining exceeds the total energy consumption of all the computers running in the United States. Of course, the electricity consumed by Bitcoin mining is also included in the national electricity consumption data.
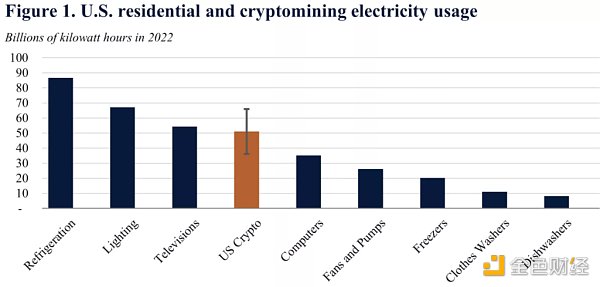
Figure 2: Comparison of electricity consumption in American households and cryptocurrency mining
The above figure shows that the electricity consumption of different household scenarios in the United States, from high to low, are: cooling, lighting, television, Crypto, computer, fan and water pump, freezer, washing machine, dishwasher (as of August 2022, Bitcoin is expected to account for 60%-77% of all Crypto electricity consumption, WEEX note)
A Bitcoin transaction requires 1,449 kilowatt-hours of electricity to be recorded (mined), which is roughly equivalent to the electricity consumption of an average American household for 50 days. In terms of currency, the average cost of 1 kilowatt-hour of electricity in the United States is 12 cents, which means that recording a Bitcoin transaction consumes approximately $173 in electricity.
The energy consumed by Bitcoin mining accounts for about 0.5% of the world’s total energy consumption, more than 7 times the total electricity consumption of Google’s global operations. If the energy consumption of the Bitcoin network is compared with the electricity consumption of various countries, it ranks 34th in the world. (Just below the Netherlands, higher than Kazakhstan, editor’s note)
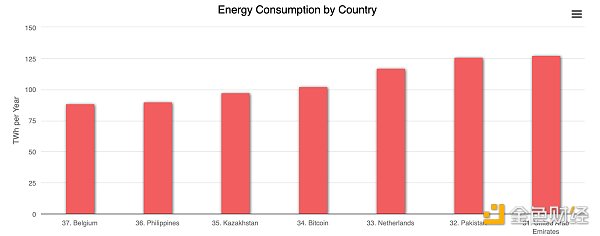
Figure 3: Ranking of energy consumption in various countries
The energy consumption of a single Bitcoin transaction is equivalent to the energy consumption of nearly 100,000 Visa card transactions. In May 2023, the electricity consumption per Bitcoin transaction reached 703.25 kilowatt-hours, while the electricity consumption of a Visa card transaction was only 148.63 kilowatt-hours.
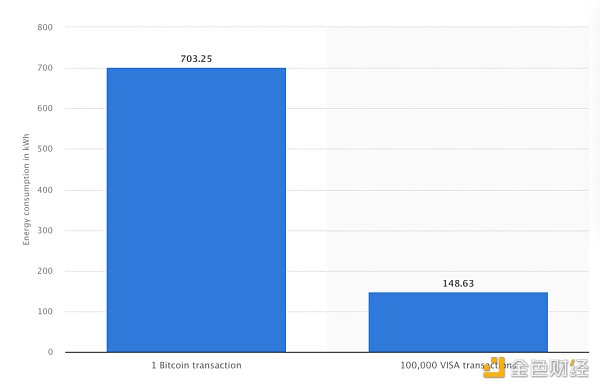
Figure 4: Energy consumption of Bitcoin transactions vs. Visa card transactions
1) How to calculate the energy consumption of Bitcoin mining?
Determining the exact energy consumption of Bitcoin mining is challenging because there are many factors involved, including:
-
The decentralized nature of Bitcoin mining
-
Lack of standardized reporting requirements
-
Dynamic and constantly changing mining patterns
-
Different sources of electricity used by miners
-
The private and confidential nature of mining operations
Accurately estimating energy usage often relies on assumptions, approximations, and statistical models based on available data. The infographic published by Digiconomist reveals the challenges in accurately measuring Bitcoin’s energy consumption. Given that electricity costs are a significant factor in ongoing expenses, the total power consumption of the Bitcoin network is closely related to miners’ income.
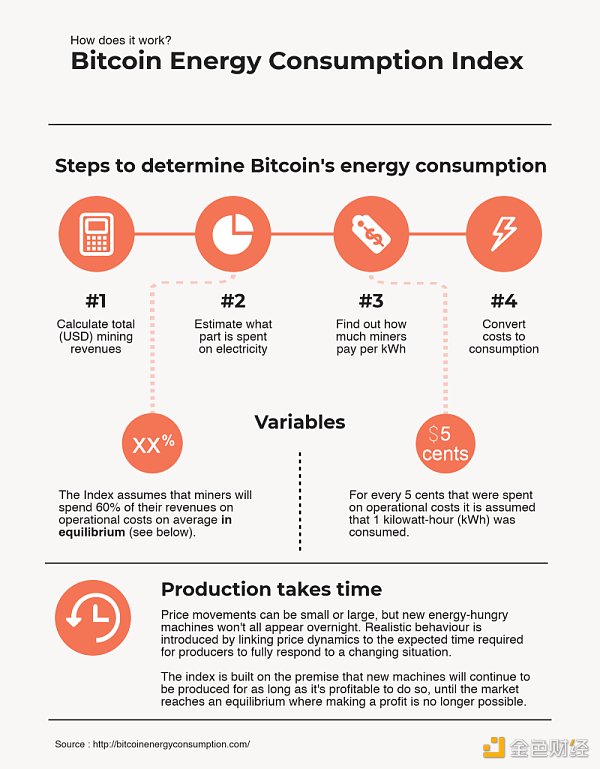
Figure 5: Steps to determine the energy consumption of Bitcoin mining
2) Bitcoin mining farms and energy consumption data in the United States
The New York Times listed 34 Bitcoin mining farms, all of which are large-scale farms in the United States with high energy consumption. The operation of these farms can generate costs, such as increased electricity bills and significant carbon emissions, affecting nearby individuals. Among these 34 mining projects, the electricity consumption of each project is at least 30,000 times that of the average American household. These businesses consume a total of over 3,900 megawatts of electricity, which is almost equivalent to the electricity consumption of around 3 million households in the surrounding area.
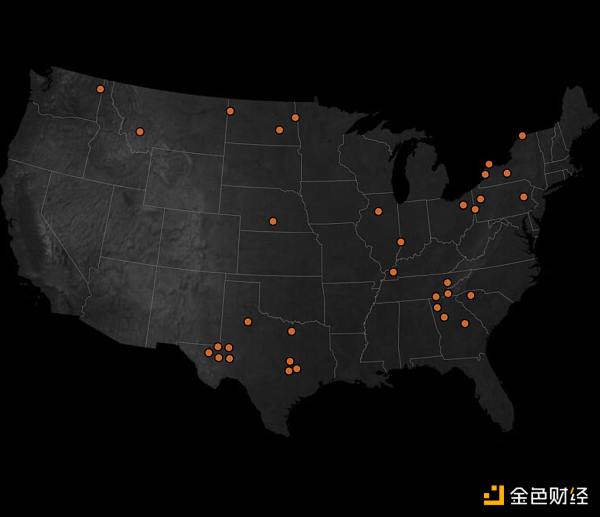
Figure 6: Distribution of large Bitcoin mining farms in the United States
A Bitcoin mining farm in Kearney, Nebraska consumes the same amount of electricity as about 73,000 households in the surrounding area. A mining farm in Dalton, Georgia consumes electricity equivalent to about 97,000 households in the surrounding area. The Riot Platform mining farm in Rockdale, Texas is the largest Bitcoin mining farm in the United States, with electricity consumption equivalent to about 300,000 households in the surrounding area.
The Riot farm is located near the Bitdeer farm and its total electricity consumption exceeds the total electricity consumption of all households within a 40-mile radius.
Cryptocurrency miners in Texas have secured long-term contracts that guarantee them significantly discounted electricity prices for up to ten years.
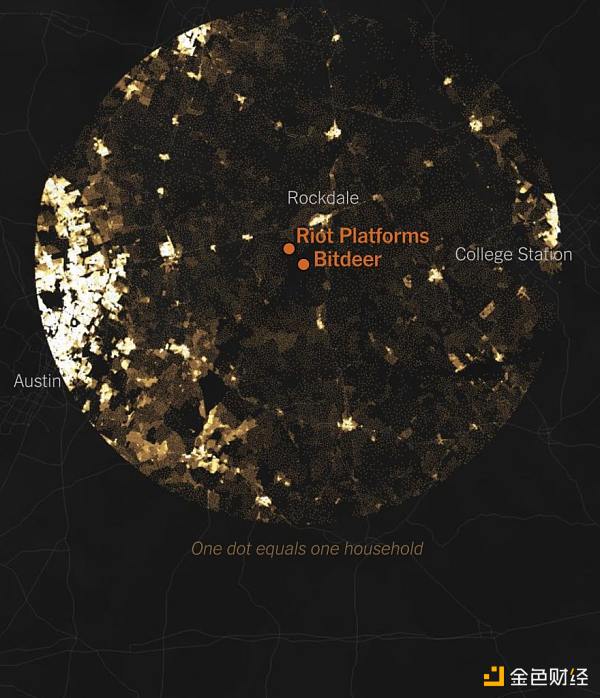
Figure 7: Distribution of Bitcoin mining farms in Texas
3) Climate Change, Bitcoin Mining, and Energy Consumption
As of August 2021, the average emission factor of the Bitcoin network is 557.76 gCO2/kWh, with an estimated power load demand of 13.39 GW. Bitcoin mining may emit about 65.4 million tons of carbon dioxide (MtCO2) per year.
The carbon footprint of Bitcoin mining can be estimated based on the power sources used by miners. The following graph represents the global carbon footprint of Bitcoin mining, which is similar to the emissions of countries like Greece (56.6 MtCO2 in 2019), accounting for 0.19% of the total global emissions.
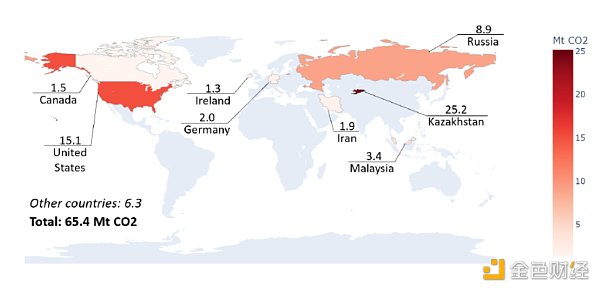
Figure 8: Carbon footprint of Bitcoin mining
As of May 2021, Bitcoin mining generates about 31,000 tons of electronic waste per year. By June 2022, this number has risen to 35,000 tons per year, equivalent to the annual electronic waste output of the entire Netherlands.
For example, when a natural gas power plant, Greenidge LLC, conducts behind-the-meter Bitcoin mining in New York State, it emits approximately 88,440 tons of carbon dioxide equivalent per year. Assuming a power plant’s electricity is entirely used for Bitcoin mining, the annual emissions would reach 656,983 tons of carbon dioxide equivalent.
About 79% of total greenhouse gas emissions come from electricity generation, making it the primary source of emissions. If a power plant operates at full capacity, its annual emissions would be equivalent to the emissions of about 140,000 cars or the emissions produced by burning 600 million pounds of coal.
4) Benefits of Bitcoin Mining Energy Consumption
To address the negative impact of Bitcoin mining, the Bitcoin Mining Council (BMC) – a global forum composed of mining companies that account for 48.4% of the total Bitcoin network hash rate – revealed that as of the fourth quarter of 2022, renewable energy accounted for 58.9% of Bitcoin mining electricity consumption. This is a significant increase compared to the estimated value of 36.8% reported in the first quarter of 2021.
In addition, a research paper released by the Bitcoin Clean Energy Initiative Memorandum states that Bitcoin mining machines are an ideal complement to renewable energy and storage technologies. The other main highlights of Bitcoin mining emphasized in the research paper include:
-
Bitcoin mining can accelerate the global transition to renewable energy.
-
Bitcoin mining can encourage investment in solar energy, while electricity costs may not change.
Bitcoin Mining Market Size and Revenue Statistics
Bitcoin mining, the process of verifying transactions and protecting network security, has evolved into a highly competitive industry, leading to exponential growth in market size and revenue. This market has become very profitable with numerous global participants, including individual miners and large-scale mining operators.
Meanwhile, the price of Bitcoin also broke through $65,000 in November 2021, reaching a historical high for cryptocurrencies. As of June 2023, the market value of Bitcoin reached $597.8 billion.
The maximum supply of Bitcoin is set at 21 million coins. This ensures scarcity and is an important factor in promoting the value proposition of Bitcoin. As of March 2023, over 19 million Bitcoins have been mined, leaving a remaining quantity of 2 million coins yet to be mined. Once the threshold of 21 million coins is reached, no new Bitcoins will be mined.
This scarcity, in turn, supports the total market value of Bitcoin mining, which is currently $8.11 billion.
1) Data on the Largest Bitcoin Mining Companies
A list compiled by ComLianGuainiesMarketCap includes the valuations of the 16 largest publicly traded Bitcoin mining companies. Among them, Marathon Digital Holdings is the largest Bitcoin miner with a market value of $2.27 billion.
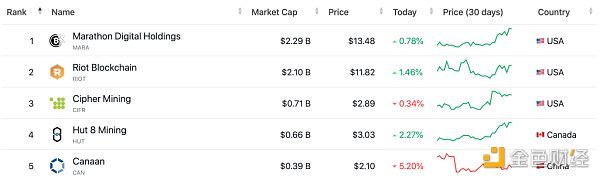
Figure 9: Top 5 Bitcoin Mining Company Market Values
It is worth noting that this list does not include some smaller publicly traded mining companies and many unlisted cryptocurrency mining companies.
In terms of revenue, Canaan is the top publicly traded mining company, with a reported total revenue of $650 million in 2022. The revenue of Chinese Bitcoin mining companies mainly comes from Bitcoin mining machine sales.
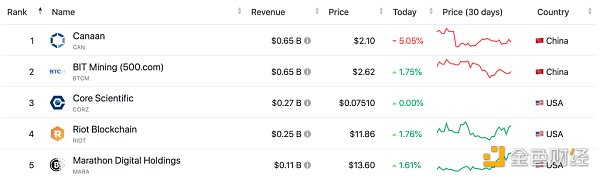
Figure 10: Top 5 Bitcoin Mining Company Revenues
In terms of earnings, Canaan is also the top publicly traded mining company, with a total earnings of $92.33 million in 2022. In 2021, the company’s profits significantly increased to $300 million, a significant improvement compared to a loss of $31.2 million in 2020.
2) Bitcoin Mining Revenue Data
As of June 26, 2023, Bitcoin miners generate a daily revenue of $27.7 million, a significant increase of 52.20% compared to the same period last year when it was $18.2 million. In April 2021, Bitcoin miners achieved the highest daily revenue since 2018, reaching $80.12 million (primarily due to the increase in BTC gas fees brought by Ordinals and BRC20, WEEX note).
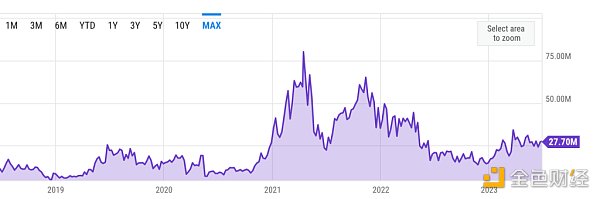
Figure 11: Bitcoin miner revenue change
According to Glassnode, on June 27, 2023, Bitcoin miners transferred a record-breaking $128 million worth of BTC to exchanges in a single transaction.
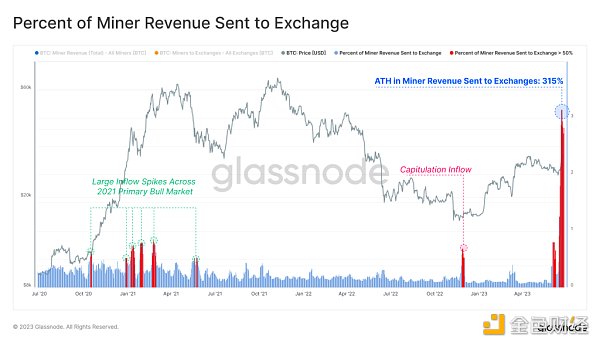
Figure 12: Bitcoin transferred to exchanges by miners
3) Sources of Bitcoin Mining Revenue
Miners’ revenue comes from two sources: Bitcoin block rewards and transaction fees.
Bitcoin rewards are obtained by miners who successfully mine blocks in the blockchain system. Miners add the rewards to the headers of the blocks to claim them.
Approximately every four years, the reward for mining a new block in the Bitcoin network is halved. When Bitcoin was introduced, the mining block reward was 50 bitcoins. As of June 2023, the mining reward for mining a new block is 6.25 bitcoins, with a new block being produced approximately every 10 minutes. The next halving is expected in 2024, when the block reward will be reduced to 3.125 BTC.
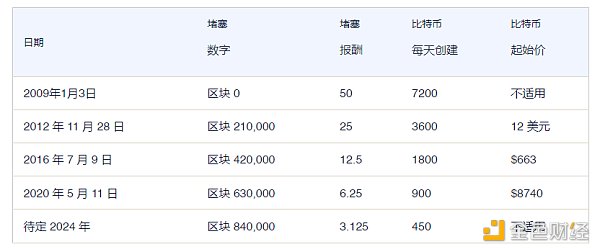
Figure 13: Bitcoin halvings over time
Bitcoin’s block reward halves approximately every 210,000 blocks until around 2140, when all 21 million bitcoins will have been mined. Once the block reward reaches 0, miners will only receive transaction fee rewards. Users pay transaction fees to have their transactions included in the Bitcoin blockchain by miners. Users can also incentivize miners to prioritize their transactions by increasing the transaction fees.
As of June 28, 2023, the average Bitcoin transaction fee is $2.226, higher than $1.168 12 months ago. This data has the potential to continue growing, similar to what happened in April 2021 when the peak reached nearly $62.79.

Figure 14: Bitcoin gas fees
The Bitcoin transaction fees may depend on several factors:
- Network congestion
- Transaction data size
- Required confirmation time
Fee calculations are typically based on transaction size (in bytes) rather than transaction amount. As of June 28, 2023, the average block size is 1.69 MB. Miners with higher hash rates have a better chance of adding new blocks to the blockchain, thereby earning block rewards and transaction fees.
In the context of Bitcoin mining, hash rate refers to the computational power or speed at which mining devices or networks can perform cryptographic calculations (known as hash operations).
Driven by profitability and returns, miners typically choose which coins to mine based on financial criteria, including factors such as daily reward amounts or the prices of different cryptocurrencies.
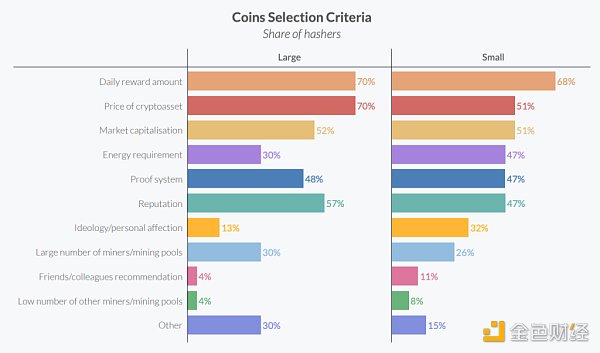
Figure 15: Token selection criteria
The hash rate index report for May 2023 shows an average hash rate price of $82.23/PH/day (equivalent to 0.00298 BTC/PH/day), an increase of 5.6% compared to the April average of $77.87/PH/day (equivalent to 0.00270 BTC/PH/day).
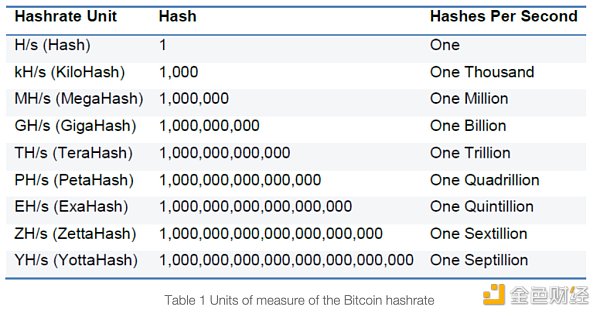
Figure 16: Bitcoin hash rate measurement units
In May 2023, miners collectively earned a total of 33,365 BTC (equivalent to $918.5 million), an increase of 20% compared to the 27,743 BTC (equivalent to $800.8 million) earned in April. Among these earnings, transaction fees contributed 4,540 BTC (equivalent to $125.8 million), an increase of 459% compared to 812 BTC (equivalent to $23.5 million) in April.
Bitcoin mining country statistics
From major countries like China and the United States to countries like Kazakhstan and Russia, different nations have an impact on the complex landscape of global Bitcoin mining.
1) China’s Bitcoin mining using hydroelectric power
Prior to the ban on Bitcoin mining in June 2021, China was an undisputed leader in terms of hash rate contribution and power consumption, accounting for nearly 50% of the network’s hash rate. This ban severely affected mining activities from China, resulting in a significant drop in hash rate.
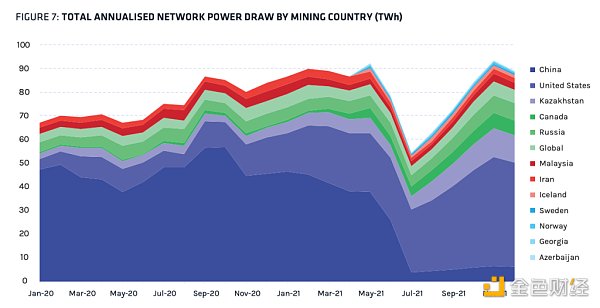
Figure 17: Mining electricity consumption by country (terawatt-hours)
According to the Cambridge Bitcoin Electricity Consumption Index (CBECI), China was once the world’s largest cryptocurrency mining center, accounting for 65% to 75% of the global Bitcoin network’s total hash rate during its peak. China’s monthly average hash rate share has declined from 75.5% in September 2019 to 22.3% in September 2021, a decrease of over 50%.
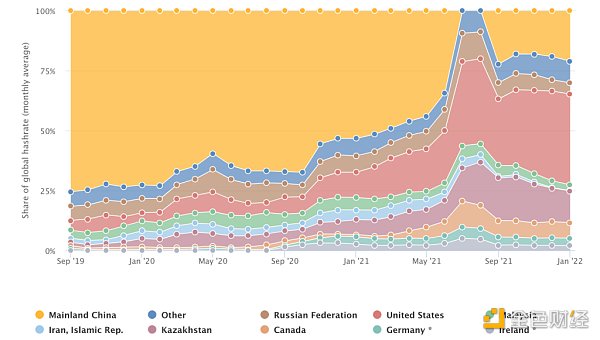
Figure 18: Evolution of the Bitcoin mining market landscape
During China’s summer flood season, certain regions have abundant hydroelectric resources and lower electricity costs. Miners take advantage of this and shift or expand their operations to areas with rich hydroelectric resources like Sichuan. At the start of the flood season in 2020, Sichuan accounted for 14.9% of China’s total hash rate, reaching a peak of 61.1% at one point. In contrast, Xinjiang, which relies heavily on coal power, saw its hash rate share decline from 55.1% at the start of the rainy season to a low of 9.6% during the same period.
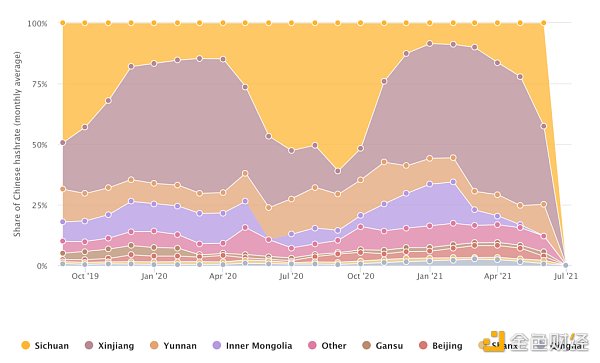
Figure 19: Bitcoin mining regions in China
2) Bitcoin Mining Statistics in the United States
The United States is the largest Bitcoin mining region in the world, accounting for over 38% of the total network hash rate. From January 2020 to January 2022, the share of Bitcoin mining in the United States has significantly increased from 4.5% to 37.8%.
Georgia has the highest share of hash power in the United States, accounting for 30.8% of the national share in December 2021. Texas ranks second with a share of 11.2%, followed by Kentucky with a share of 10.9%.
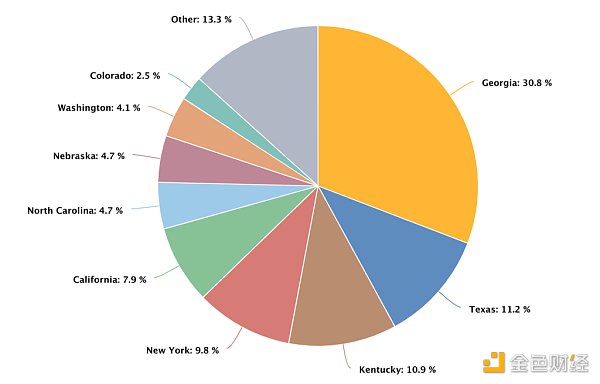
Figure 20: Bitcoin mining share in U.S. states
Hawaii has a mining cost of $54,862.05 and a profit of -$24,617.20, making it the most expensive state for mining Bitcoin.
The following figure shows the top 10 states with the highest cost of mining one Bitcoin (in order: Hawaii, Alaska, Connecticut, Rhode Island, Massachusetts, California, New Hampshire, Vermont, New York, New Jersey, WEEX annotation).
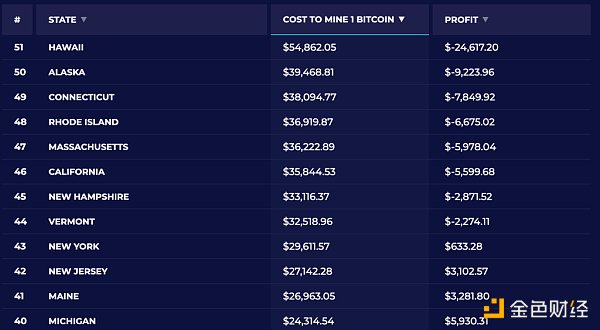
Figure 21: Top 10 states with mining cost in the United States
Louisiana has the lowest cost, with a total cost of $14,955.14 and a profit of $15,289.71.
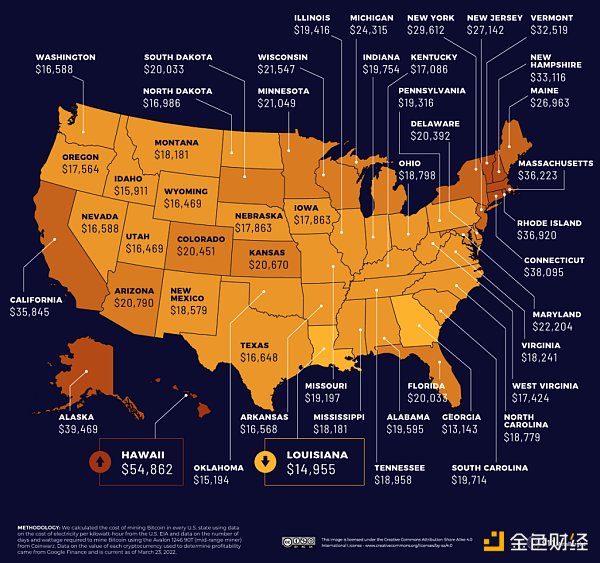
Figure 22: States with the lowest mining cost in the United States
3) Changes in the Global Bitcoin Mining Landscape
The shift in Chinese mining has changed the global mining landscape, resulting in countries such as Kazakhstan and Russia becoming major beneficiaries of hash power reallocation. According to data provided by the World Population Review, as of 2023, the hash power distribution in major Bitcoin mining regions is as follows:
-
United States: 35.4%
-
Kazakhstan: 18.1%
-
Russia: 11.23%
-
Canada: 9.55%
-
Ireland: 4.68%
-
Malaysia: 4.58%
-
Germany: 4.48%
-
Iran: 3.1%
After the ban was implemented, many Chinese miners relocated their operations to Kazakhstan due to its proximity and abundant fossil fuel resources.
In 2019, fossil fuels accounted for 84% of Kazakhstan’s electricity generation, while hydropower accounted for 12% and solar and wind energy installations contributed less than 2%. The northern region of Kazakhstan has abundant coal reserves, which power over 70% of the country’s power plants.
The electricity in Kazakhstan is provided by 155 power plants with different ownership modes. As of January 1, 2022, the total installed capacity of power plants in the country reached 23,957 megawatts, with an available capacity of 19,004 megawatts.
During the period from September 2019 to September 2021, Kazakhstan’s global Bitcoin mining share has significantly soared from 1.3% to a remarkable 24.3%. The country’s Bitcoin mining business has flourished due to the self-sufficiency and energy efficiency of coal.
However, according to a report from the Russian media “Kommersant” in April 2023, Russia has become the world’s second-largest Bitcoin mining region, second only to the United States.
The data center of Bitriver, a top Russian cryptocurrency mining company, is supported by Gazprom Neft, the country’s third-largest oil producer. It generates electricity directly from liquefied petroleum gas to meet the power demand for cryptocurrency mining.

Figure 23: Russian mining company Bitriver
Although the United States maintains a significant mining leading position with a power capacity of 3-4 gigawatts, Russia’s power capacity has reached 1 gigawatt from January to March 2023. The change in Russia’s ranking coincides with the implementation of tax and regulatory measures on cryptocurrency mining by the United States at the state and federal levels, making the mining industry in the United States face an unfriendly policy environment.
Bitcoin Mining vs. Other Resource Costs
Due to its performance challenges, Bitcoin is often likened to “digital gold” rather than a payment system. Therefore, Bitcoin mining can be compared to gold mining.
Approximately 3,531 tons of gold are mined globally each year, resulting in a total carbon dioxide emissions of 81 million tons. Comparing the carbon intensity of Bitcoin mining with that of physical gold mining, it is clear that the former exceeds the latter.
However, it is worth noting that this calculation includes mining fees, which do not exist in physical gold mining. In addition, an undesirable aspect of such a comparison is that we can stop mining physical gold, but Bitcoin mining cannot be stopped for a moment, as it is an indispensable part of the entire Bitcoin network.

Figure 24: Gold mining vs. Bitcoin mining
Depending on the specific resources and extraction methods, the energy costs of resource extraction may vary greatly. For example:
According to data from the United States Geological Survey (USGS), the energy consumption for copper mining to produce one ton of copper (GJ/t) ranges from 0.2 to 1.5 gigajoules, with copper’s electrical usage accounting for about 3/4 of the total consumption; producing one ton of aluminum requires approximately 17,000 kilowatt-hours (kWh) of electricity, and the electricity needed for aluminum production usually comes from thermal power plants with a maximum operating efficiency of about 30%.
In 2021, American power companies and independent power producers require the following resources to produce 1 kilowatt-hour (1 kWh) of electricity: 1.12 pounds of coal, 7.36 cubic feet of natural gas, 0.08 gallons of liquefied petroleum gas, and 0.82 pounds of petroleum coke (a black solid carbon material produced by cracking and coking petroleum under 500-550℃, editor’s note).
We will continue to update Blocking; if you have any questions or suggestions, please contact us!
Was this article helpful?
93 out of 132 found this helpful
Related articles
- Arweave’s Composability Experiment Exploring a Better NFT Market
- Should Polkadot’s market positioning and narrative be adjusted?
- The first debate of the Republican primary ended. Which candidates are friendly towards encryption?
- Wu’s Weekly Selection Tornado Cash Co-founder Arrested, HashKey to Open Retail Investors Next Week, and Top 10 News (0819-0825)
- Market Analysis There will be a sharp decline before the next rise, a bear market is approaching.
- The former secretary of the Fuzhou Municipal Party Committee, who supported mining, has been sentenced to life imprisonment, but it has also left us with many questions.
- The first debate of the Republican primary ended. Which candidates are friendly to cryptocurrencies?