Analysis | After 2028, bitcoin prices will never be less than $100,000
Economists such as Nouriel Roubini predict that the price of bitcoin will fall to zero within five years; and John McAfee's famous prediction is that by the end of 2020, the price of bitcoin will reach $1 million. Others' predictions are in these two intervals [1].
Overall, since the birth of Bitcoin in 2009, its price has been rising rapidly, and it has experienced many times of prosperity and depression. The rapid rise in bitcoin and its boom period seem to be driving McAfee and others to make very optimistic forecasts for future prices, and the recession seems to prompt other economists to predict that bitcoin prices will fall to zero.
In this paper, we will look at the historical price of Bitcoin from a logarithmic scale , and its price evolution can be understood as moving within a range defined by two time-based power laws (see figure below). Although the idea of using power law to simulate bitcoin prices is not new, in this article we give more support to this idea and provide some additional explanations.
- Blockchain Weekly | Industry Weekly Financing 9, National Supervision Continues to Voice Libra
- Looking at the blockchain application from the Shanghai Blockchain International Week Demo Day
- France prevents Libra from doing business in Europe; Coinbase is expected to launch the IEO platform
[Note: The logarithmic scale is a non-linear measure that is used when there is a large range of differences. The logarithmic scale is based on the order of magnitude, not the general linear scale, so the quotient between each scale is a fixed value. ]

This model allows us to make broad predictions about the long-term future price of Bitcoin, such as:
- Bitcoin prices will reach $100,000 no later than 2021 and no later than 2028. After 2028, its price will never fall below $100,000 ;
- Bitcoin prices will reach $1 million no earlier than 2028 and no later than 2037. After 2037, its price will never fall below $1 million .
In addition, we can see from the above figure that the price range of Bitcoin can be divided into two bands: one of the bands is below the price forecast (green), which is relatively narrow; The other is wider (red), above the price forecast . The price of Bitcoin is roughly the same in both bands. This means that large bubbles and bubble bursts may continue to exist .
The above predictions may look broad, but they are accurate enough to compete with the predictions of others. This price model should also help to clarify the point in time when entering or exiting the market .
I am confident that in the long run, bitcoin prices will indeed evolve as described in this article. I believe that Bitcoin's upside potential is greater than its downside potential in the face of huge external shocks .
Different ways of looking at prices
The first bitcoin I can find on the exchange is $0.05 on the Mt Gox exchange on July 17, 2010. Before that, a lot of Bitcoin was traded at a lower price, such as in 2020. On May 22, Laszlo Hanyecz bought two pizzas for 10,000 BTC, and the converted bitcoin price was $0.0025 .
At the time of this writing, the price of BTC was around $10,000, which is about 4 million times higher than Laszlo Hanyecz's valuation of BTC at the time.
It is very unusual for a financial instrument to experience so many orders of magnitude. In fact, observing the curve of bitcoin prices over time can be somewhat puzzling. The chart below shows the price changes for Bitcoin prices from July 17, 2010 to the time of writing. A similar chart can be found on any website that lists bitcoin prices.
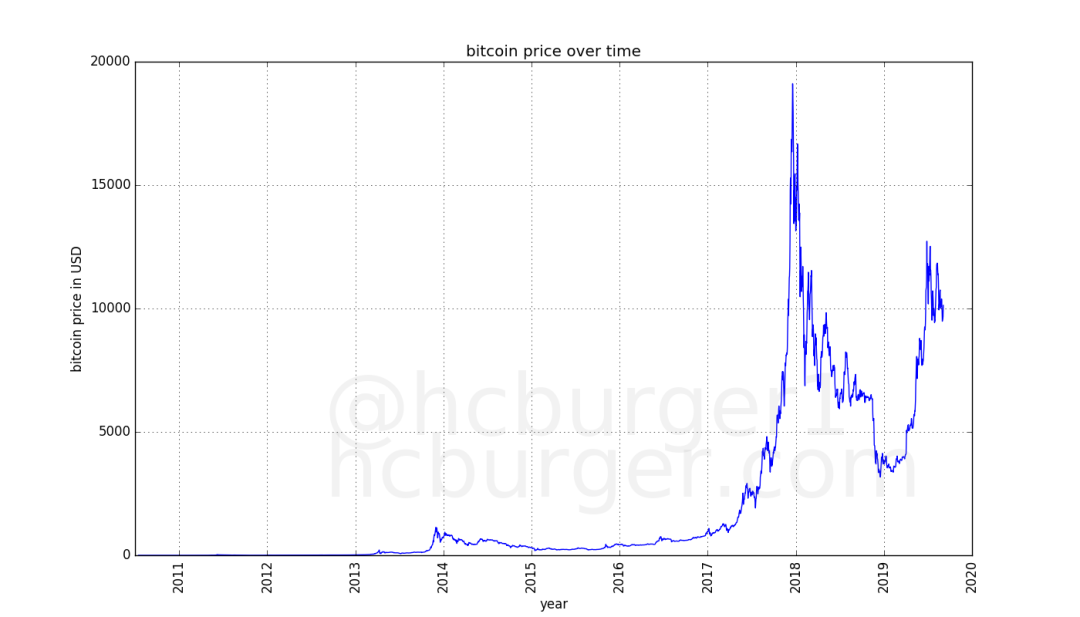
The reason for this effect is that it is inconvenient to use linear scales for any financial instrument that has experienced so many orders of magnitude change . Logarithmic scales are more useful than linear scales! [2] The logarithmic scale gives the spacing from 0.01 to 0.1 and from 1,000 to 10,000.
From a logarithmic scale perspective, the larger picture of the evolution of bitcoin prices has become more visible, as shown in the following figure:
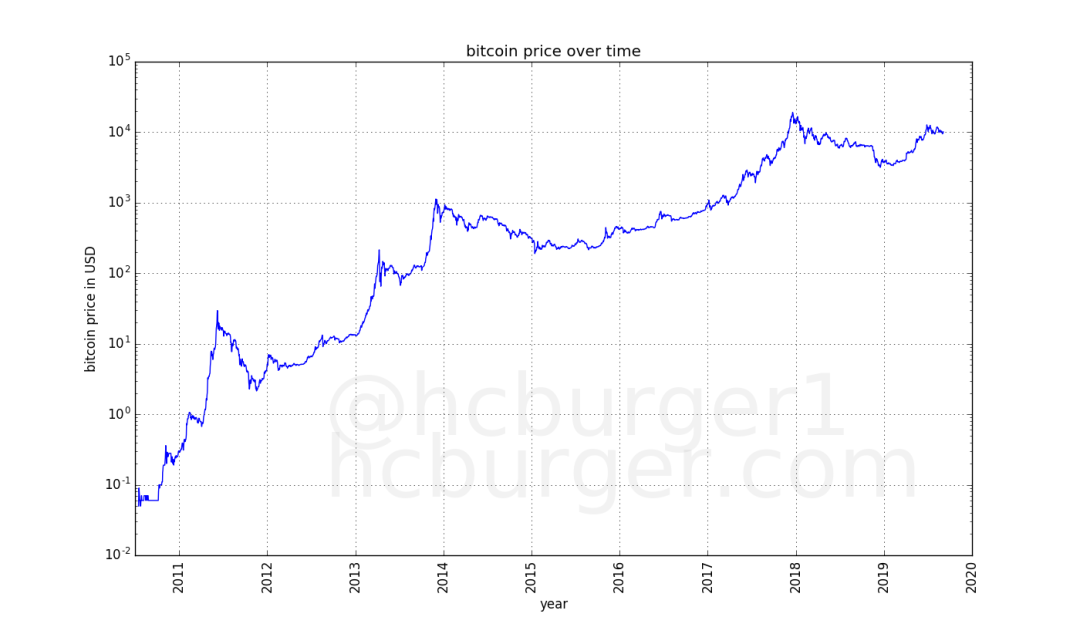
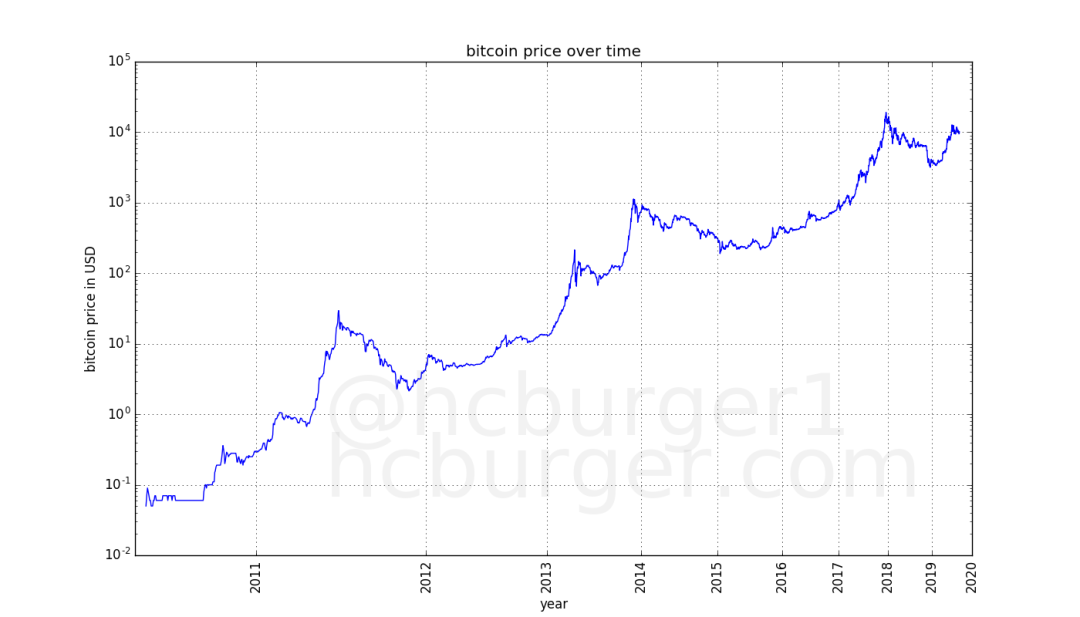
In the figure above, the price (y-axis) is scaled in logarithmic scale, while the time (x-axis) is not scaled. Let's see what happens when the x-axis is also scaled by logarithmic scale, which is the case in the so-called log-log plot ([3]):
Linear regression
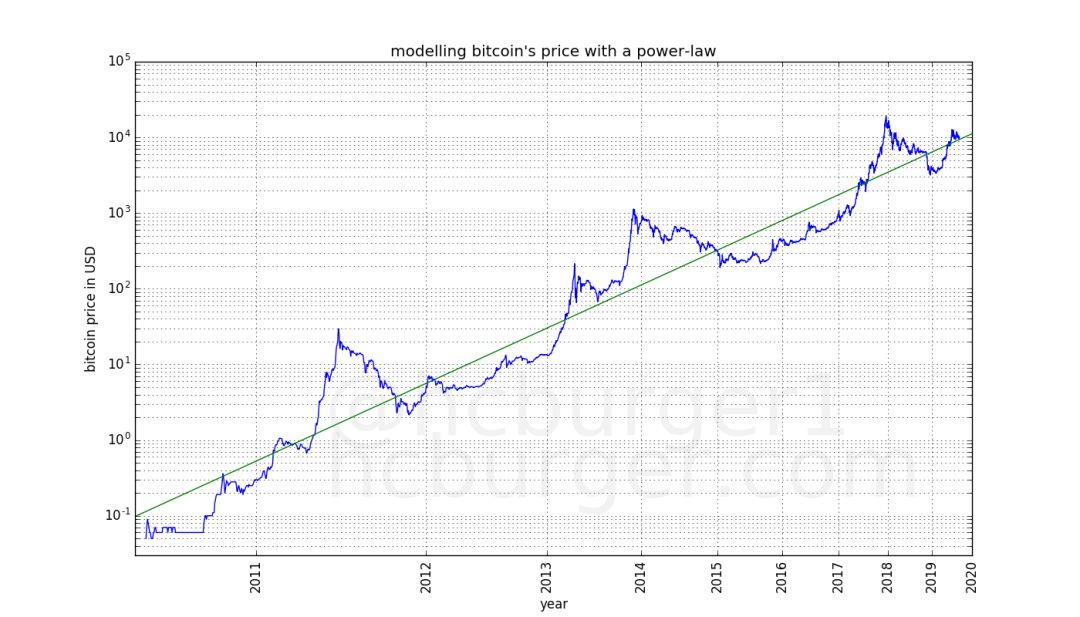

Note: By linear regression in logarithmic space, we obtain a nonlinear power law that predicts the price of bitcoin.
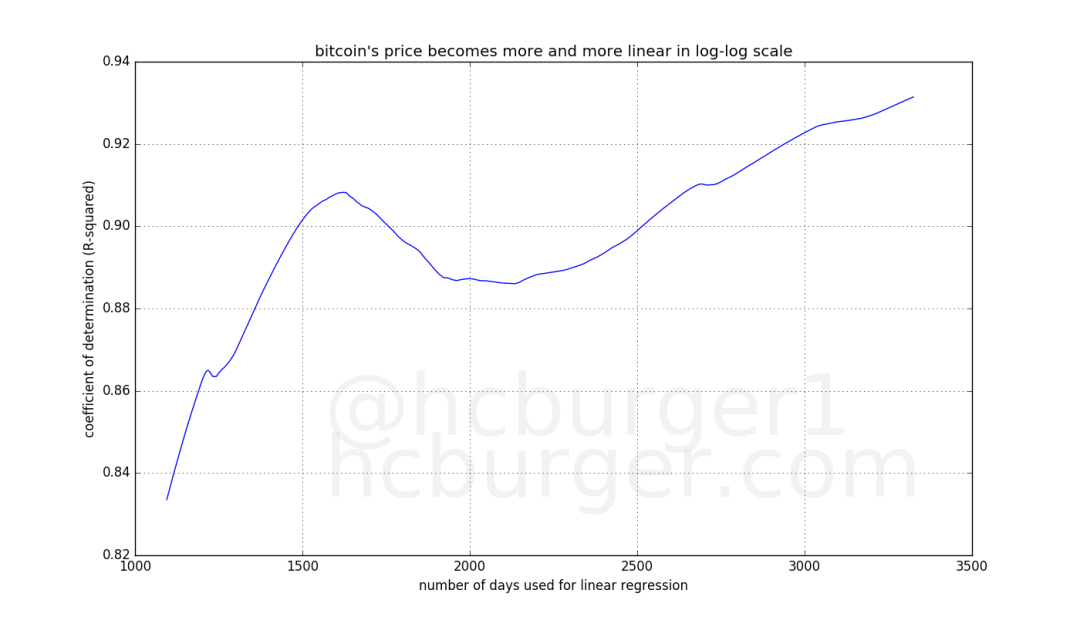
Visually, the linear regression approach is a good way to trace the historical price of Bitcoin. Interestingly, the post on reddit was written about a year ago, but the results of linear regression are still very similar. At the same time, the coefficient of determination (also known as goodness of fit , [6]) is higher, 0.93139763, indicating that the model fits well.
In the image below, we can see how the coefficient of evolution evolves over time. Surprisingly, over time, the coefficient of determination (goodness of fit) is increasingly linear:
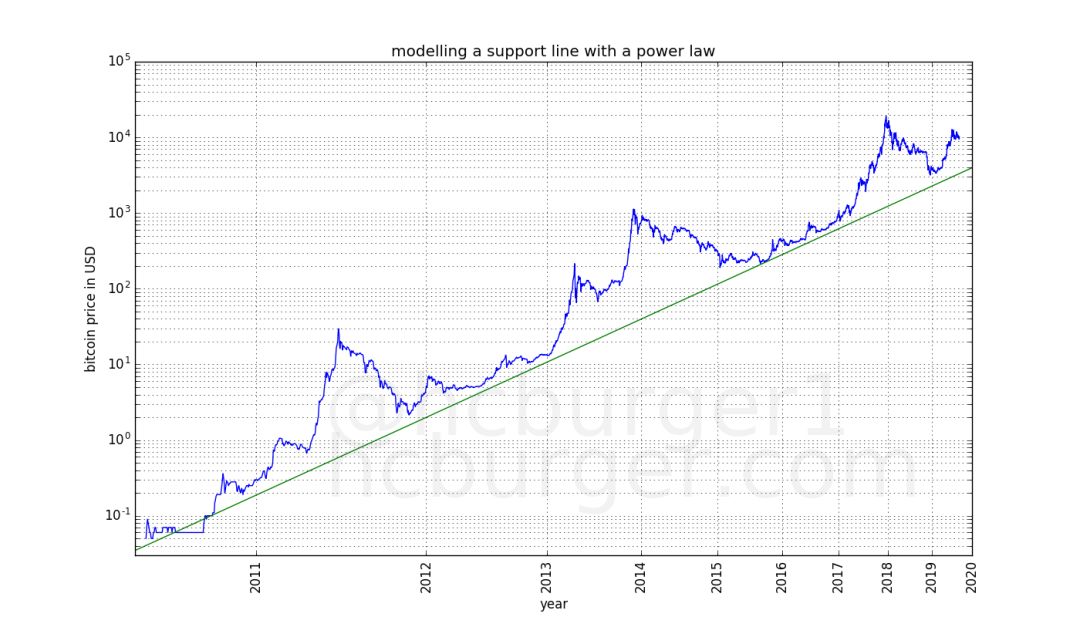
If we move the above fit a little down (but don't change the slope) , we will find that a support line seems to be very effective (except for 2010, when the price did not break through this line), see the picture below:
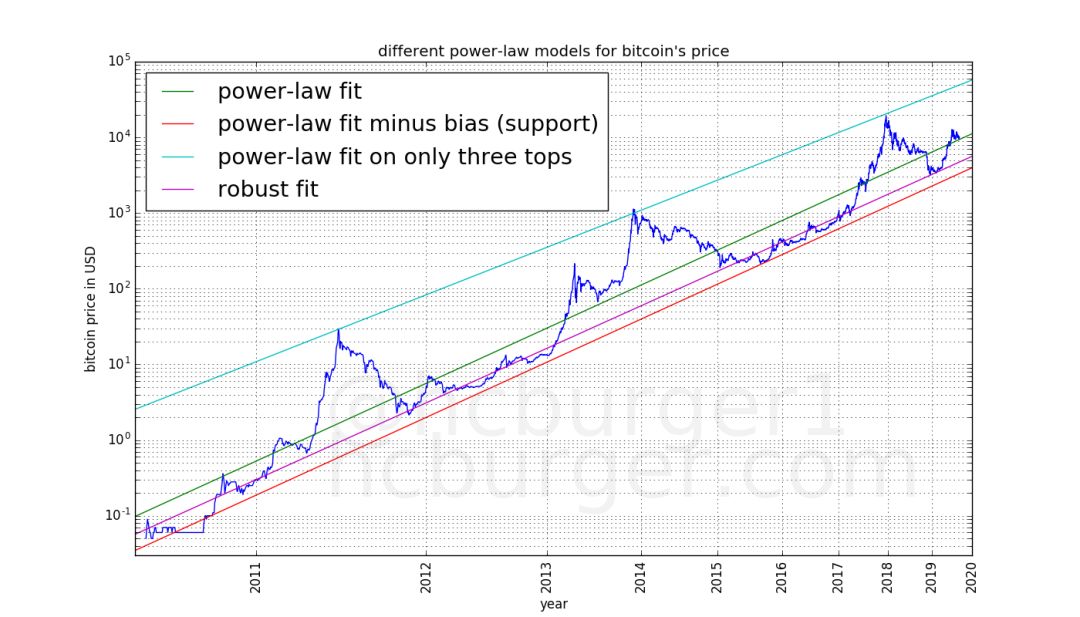
We can also try to linearly regress only the top three bitcoin price peaks in 2011, 2013 and 2017 . Interestingly, this fit is very efficient: the linear regression results for all three data points are very close to the previous line, see the following figure:
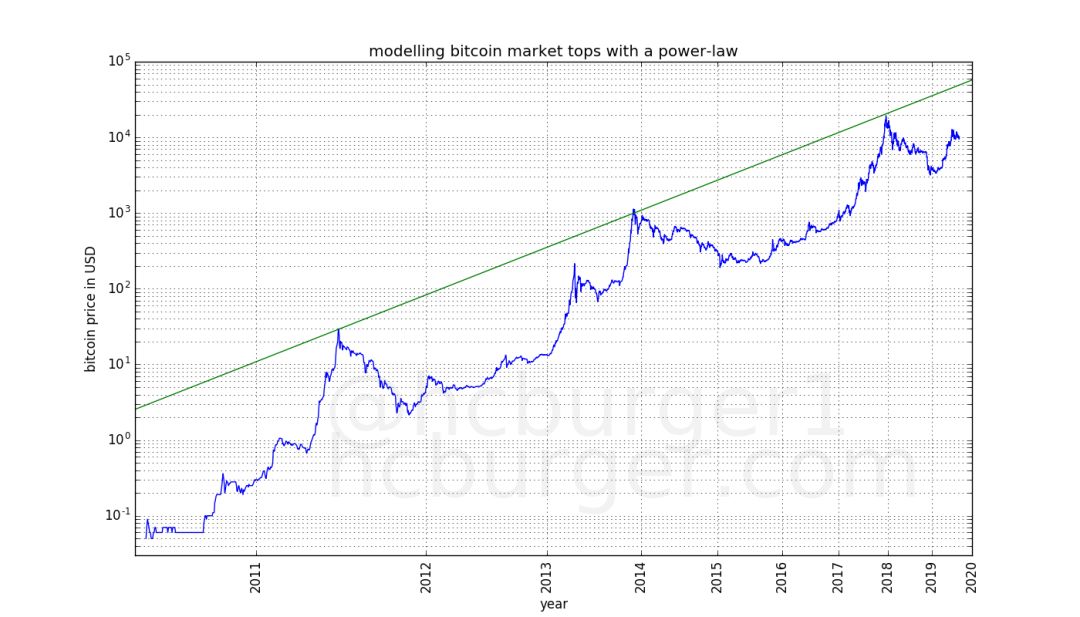
This suggests that the bitcoin bull market is relatively modest compared to the overall trend line . This may be expected, as people will expect bitcoin volatility to become smaller as the market matures and order books become more numerous.
We now have two power laws to determine the price trend of Bitcoin: the support line below and the line above the market peak.
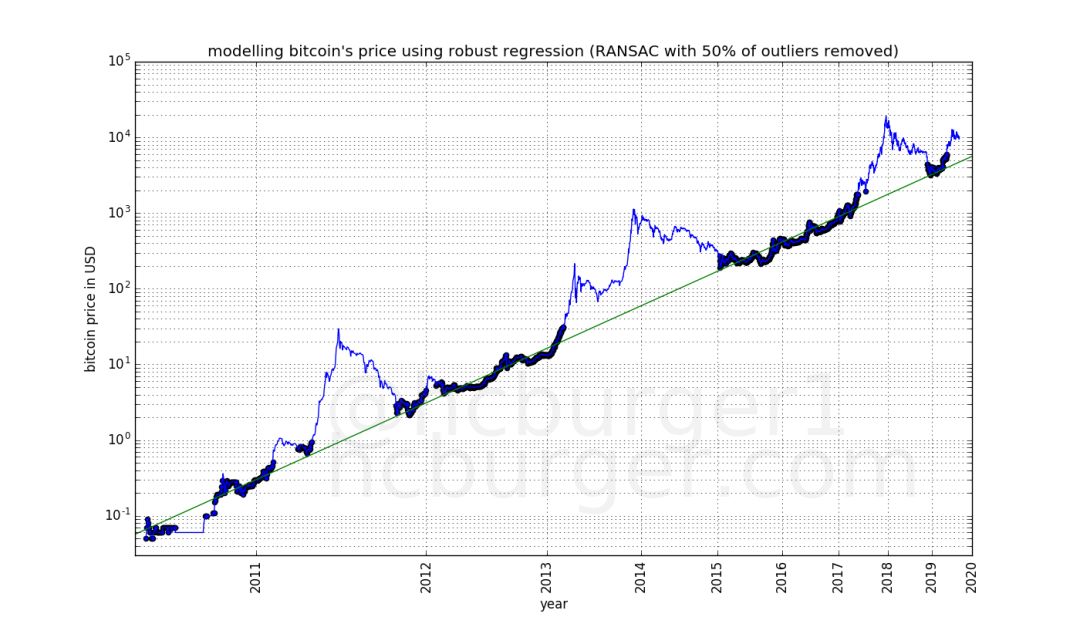
Now let's see which data points are best for this model. We will use the random sampling algorithm RANSAC , which is an iterative form of removing outliers:
First, linear regression is performed on all data points; then, the data points that least match the data are removed, and linear regression is performed again [7]. When 50% of the data points are removed, we will stop linear regression. The figure below shows the result:
- One of them is the normal mode , in which the price is well defined by the power law;
- The other is the bull market model , in which the bitcoin price may be much higher than the normal mode and the price fluctuates more.
Bitcoin prices are equal in time in both modes .
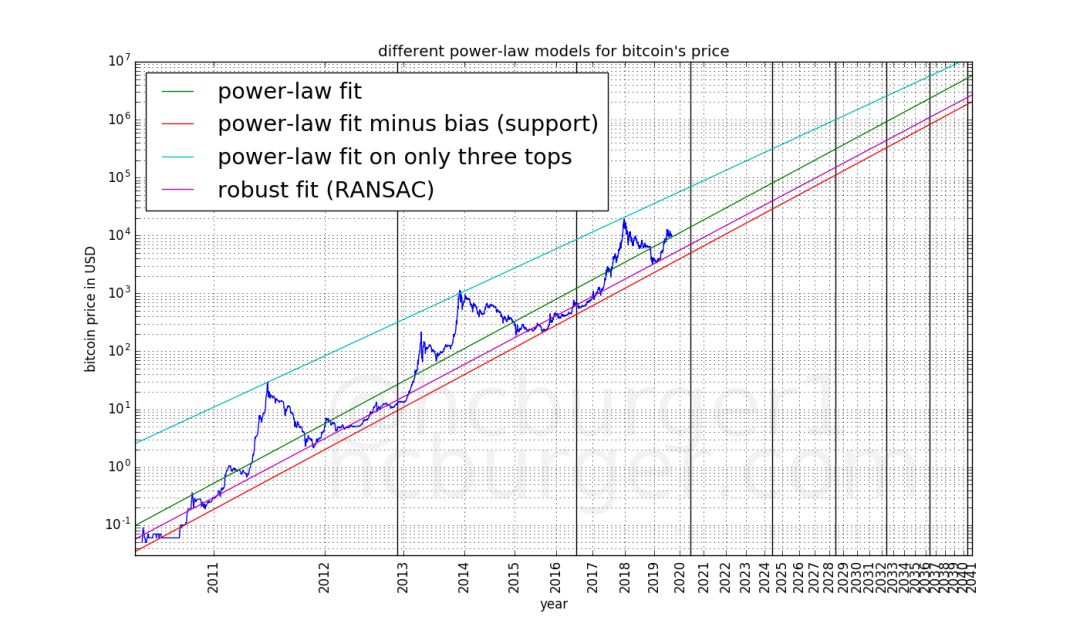
Finally, let's merge all the models mentioned earlier into one:
Price forecast based on the model
We can further divide it into two bands: one band corresponds to "normal mode" and the other band corresponds to "bull mode" . So far, Bitcoin prices have been in the “normal mode” band for half of the time and the “bull mode” band for the other half. See below:
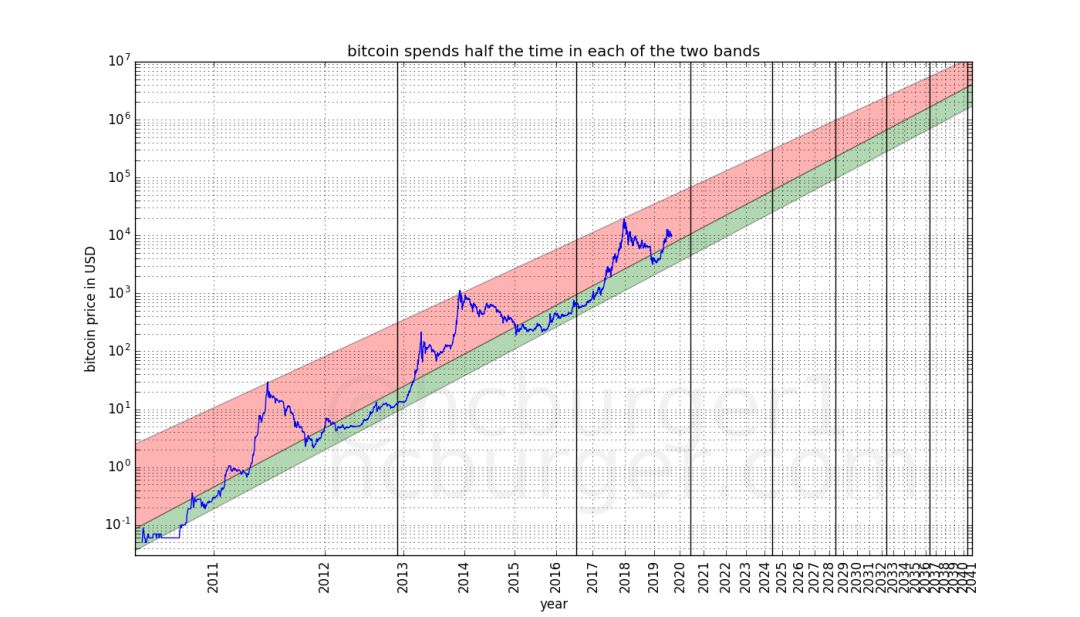
It also predicts that bitcoin prices will not reach $100,000 by 2021, but prices will not fall below $100,000 by 2028. It also predicts that prices will not reach $1 million by 2028, but after 2037, prices will not be less than $1 million. The model predicts that prices will continue to rise, albeit at a slower pace .
Since the band above shows a wide range of bands and the price increase will slow down, this means that unlucky investors will have to wait longer and longer to recover their initial investment.
For example, investors who bought Bitcoin at the peak of the 2011 bubble only had to wait for about two years, and by 2013 the bitcoin price had risen permanently; however, investors who bought Bitcoin during the peak of the 2013 bubble, I have been waiting for about 4 years, and in 2017, the price has risen from that price and stayed above that price.
The model predicts that the price level at the peak of the 2017 bubble will not be reached until the end of 2023, about six years later.
So far, every four-year halving period has a bubble, and bitcoin prices will be overtaken by bubbles in the next period. However, due to the above-mentioned slowdown and wide band range, this situation may not continue to appear in the future . For example, the model predicts the following scenarios:
- The price at the beginning of 2022 was about $150,000, which is the fourth half-year halving period for halving bitcoin;
- By mid-2028, the price will be less than $150,000, which is the sixth four-year period.
Such a situation will provide support for Bitcoin critics, but as long as people are prepared, they should not be particularly worried.
Why does Bitcoin follow a power law? Should we expect it to continue to follow? Bitcoin's observation of power law is clearly specific to bitcoin. In addition, in addition to time, there are other factors that should affect the price of Bitcoin, such as its scarcity.
However, the scarcity of Bitcoin is procedural and therefore time based. Therefore, for this simple time-based model, it is not impossible to continue in the future .
- Https://blockonomi.com/bitcoin-price-predictions-2019/
- https://en.wikipedia.org/wiki/Logarithmic_scale
- https://en.wikipedia.org/wiki/Log%E2%80%93log_plot
- https://en.wikipedia.org/wiki/Linear_regression
- https://www.reddit.com/r/Bitcoin/comments/9cqi0k/bitcoin_power_law_over_10_year_period_all_the_way/
- https://en.wikipedia.org/wiki/Coefficient_of_determination
- https://en.wikipedia.org/wiki/Random_sample_consensus
Original: Harold Christopher Burger
Edit: Summer
Source: Unitimes
We will continue to update Blocking; if you have any questions or suggestions, please contact us!
Was this article helpful?
93 out of 132 found this helpful
Related articles
- OTC market research: the “paradise” of money launderers?
- Another country announced that it will be on the blockchain legal digital currency, it will not be the last one
- Bitcoin | Inbound capacity issues in lightning networks
- Bitcoin's power and difficulty are rising, and high-coin prices are rising, attracting new influx
- Babbitt column | Ren Zhengfei talks about "coin" for the first time, the world has no confidence in the dollar
- Dry goods | Central Bank Digital Currency Events
- Sudden! OKEx Korea will remove 5 kinds of anonymous coins, or related to the new FATF regulations.