BTC halved | From MA, Z-Score, Reserve Risk, analyze whether it is a good time to enter the market
Currently, most people think that halving Bitcoin will bring a big bull market. This part of people is mainly empiricism from the previous two halving trends. As can be seen from the figure below, Bitcoin has halved twice before on November 28, 2012 and July 9, 2016. After the first halving, the historical high price was refreshed after 367 days, and the currency price soared by 9260%. After the second halving, the historical high price was refreshed again after 526 days, and the currency price soared by 2976%.
Therefore, even if compared with the previous two halving cycles, the emergence of factors such as the bitcoin market value in 2020 and the gradual prosperity of the derivatives market will lead to the steady stabilization of bitcoin volatility, but many people still believe that The third halving will definitely increase by more than 10 times.
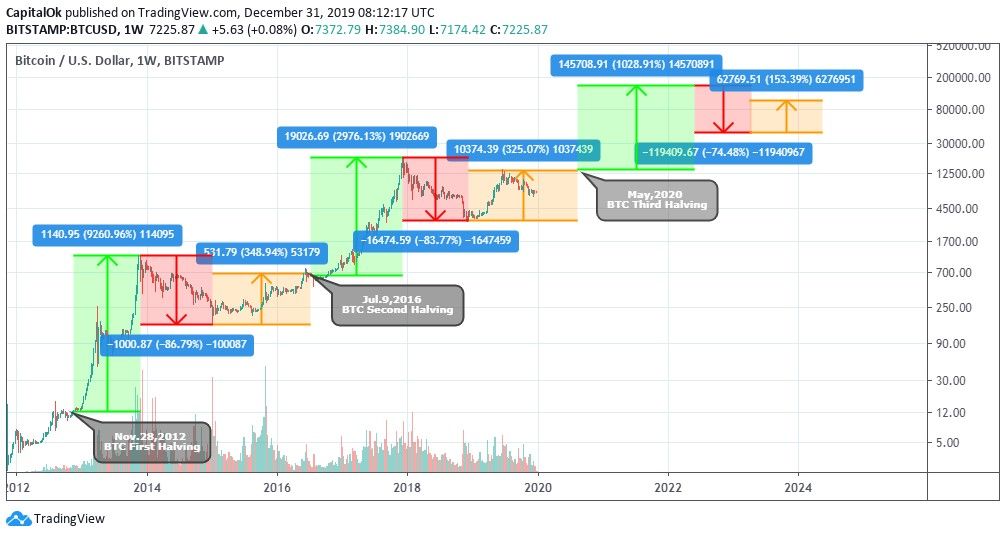
Figure 1: Bitcoin fluctuation cycle
- EOS drops on the altar: millions of TPS have not been fulfilled, "VOICE" is silent
- Inventory: 2019's biggest winners and losers in the crypto industry
- Fuzhou strives to exceed 430 billion yuan in digital economy in 2020, and accelerates the layout of the blockchain industry
Leaving aside empiricism, this article will use the Moving Average (MA), Atman Model (Z-score), and Reserve Risk to give you a thorough understanding of whether it is a good time to enter Bitcoin.
Moving average (MA)
Moving average (MA) is to average the currency price (index) over a certain period of time and connect the average values at different times to form a MA to observe the trend of currency prices. This indicator is more inclined to believe that historical prices have a stronger impact on future trends. MA is more common in 5 days / 10 days; 30 days / 60 days; 120 days / 240 days MA indicators, which are aimed at short-term, medium-term and long-term investments, respectively. In this article, we choose to use the half-cycle of bitcoin-two-year MA and MA * 5 technical indicators as an analysis tool, which mainly shows in which periods of buying and selling bitcoin can generate huge benefits.
Bitcoin Investor Tool = MA 730 (BTC USD ) & MA 730 * 5 (BTC USD )
The drawing is shown below. It can be seen from the figure that when the price drops below the 2-year moving average (green line), buying bitcoin will generate an excess return; when the price exceeds the 2-year moving average x 5 (red line), it is selling bitcoin Best time. As for why there is such an obvious opportunity to get on and off the bus, the main reason is as shown in the above figure (Figure 1), with Bitcoin as the axis of halving, it will experience obvious market cycle fluctuations-skyrocketing, correction, consolidation Overly pessimistic caused by excessive excitement of market participants and excessive contraction of prices. It can be seen from Figure 2 that the green depressions (the best time for admission) are all about one year before halving. The best time to halve in 2020 is between December 2018 and April 2019. There is currently a chance to generate and enter a second green depression.
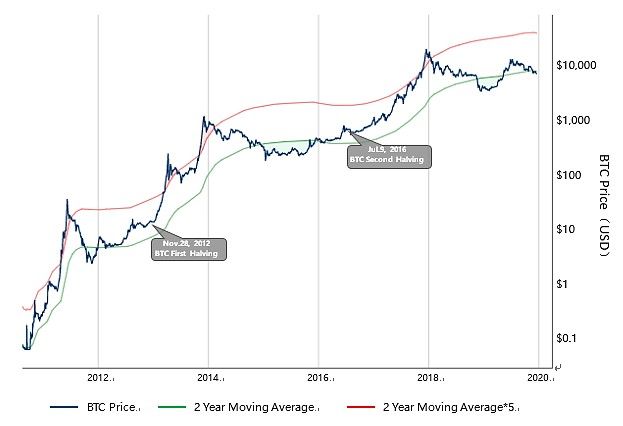
Figure 2: Bitcoin 2y MA & 2y MA * 5
Atman model (Z-score)
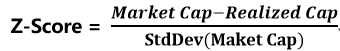
The Atman model (Z-score) can display the top of the market with higher accuracy. This indicator is more inclined to discover the true value of Bitcoin through OTC transactions. The formula is as follows:
Market Cap (market value) is expressed as the current price of Bitcoin multiplied by the number of coins in circulation; Realized Cap (fair value) represents the price of each bitcoin when it was last transferred, that is, the last transfer from one address to another Price, then weight all unit prices and quantities and take the average. The average is then multiplied by the total amount of circulation to obtain the Realized Cap. Realized Cap can usually represent the price of large over-the-counter transactions. According to BTC.com data, as of January 3, 2020, the top 0.000349% of addresses had 15.14% of Bitcoin. The bitcoin market is still a highly concentrated market, and large off-exchange transaction prices can to a certain extent represent the fair price of bitcoin.
Z-Score is calculated by dividing the difference between market value and fair value by the standard deviation of the two. Z-Score can be used to determine the period of extreme overvaluation and extreme trough of the Bitcoin market value relative to its fair value. As can be seen from Figure 3, when the market value of Z-Score is abnormally higher than the fair value, it will enter the red area, indicating that it has reached the top of the current market cycle. Z-Score will enter the green zone when the fair value is abnormally higher than the market value, indicating that the bottom of the current market cycle has been reached. The green area is currently approaching.
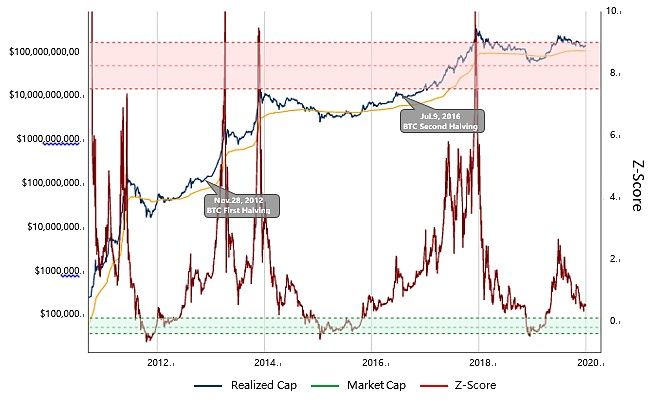
Figure 3: Bitcoin Z-score model
Reserve Risk
Reserve Risk provides entry / exit recommendations by measuring risk and return. This indicator tends to attribute the value of Bitcoin to long-term holders' firm holdings. The risks mainly depend on the destruction of CoinSky. Among them, the coin days = the number of bitcoins * the number of days that the coins are placed in an address. Once the bitcoin is transferred, the coin days are destroyed. For example, I bought 1 bitcoin and kept it in my wallet for 7 days, then I sold it, and when it was transferred from my wallet to a new buyer's wallet, it was destroyed for 7 currency days. The larger the value of Coin Tian destruction, it means that the number of long-term Bitcoin holders in this period is decreasing, and the risk of holding Bitcoin is increasing at this time.
The following figure shows the destruction of currency days with different holding periods. The low is 1 day and 7 days, and the high is 3 years and 5 years. Short-term holding represents demand; long-term holding represents supply. As can be seen from the figure, the growth of each round of coin prices is driven by new demand for coin hoarding.
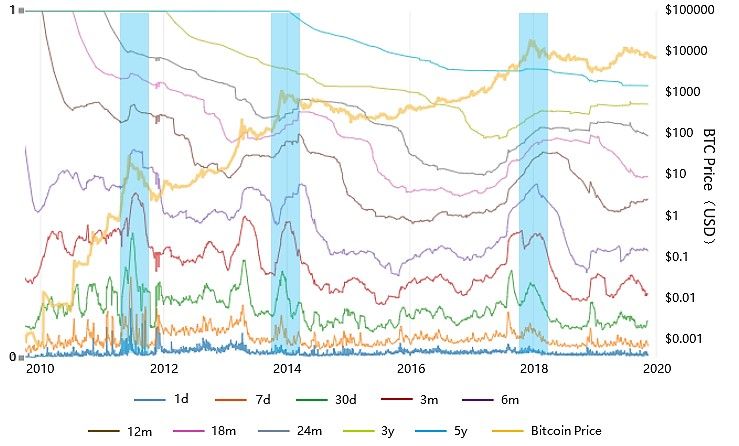
Figure 4: Destroyed days of different holding periods
We converted the destruction data of Bintian into assets held at different periods, and the conversion results are shown in the following figure. It can more directly reflect that with each round of coin price growth, the number of coins stored also increases. Among them, the 1d data can be approximated as the daily on-chain transaction volume.
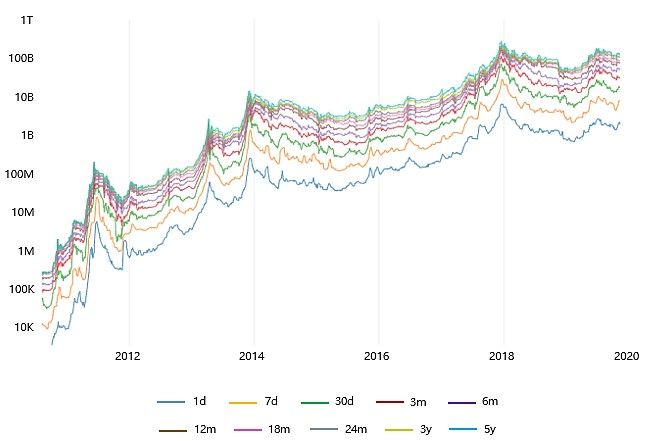
Figure 5: Bitcoin assets with different holding periods
The assets held at different periods are defined as HODL Bank. We believe that the reserve risk is inversely proportional to HODL Bank and proportional to the currency price. That is, the more coins are stored, the lower the reserve risk; the higher the currency price, the higher the reserve risk. The formula is as follows:
Reserve Risk = Bitcoin Price / HODL Bank
The currency price, Reserve Risk and HODL Bank are plotted in Figure 5. It can be seen that each time the Reserve Risk value enters the red area, it is a market high; when it enters the green area, it is a good time to store coins. And it is currently in the green coin hoarding area.
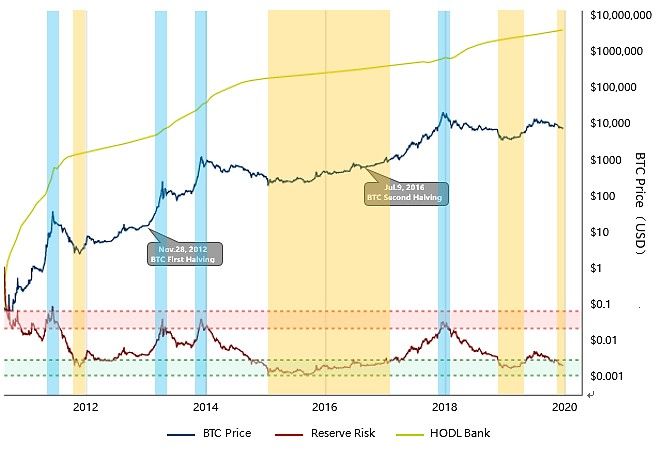
Figure 6: Reserve Risk
Above, we analyzed the current market cycle of Bitcoin from three technical indicators: moving average (MA), Atman model (Z-score), and Reserve Risk. Obviously this is the second best entry opportunity in this cycle since the beginning of 2019. However, it should be noted that the rise of Bitcoin after halving has a tendency to gradually lengthen, and it is expected that this cycle will need to be completed in 2022 to obtain a large gain.
We will continue to update Blocking; if you have any questions or suggestions, please contact us!
Was this article helpful?
93 out of 132 found this helpful
Related articles
- Ants start rendering blockchains: three major strategic speedup leads?
- Babbitt Column | Blockchain industry to land, these areas still need to be greatly improved
- Ethereum price history: from 2015 to 2020
- 66% of Bitcoin transactions have adopted Segregated Witness (SegWit), more mainstream exchanges will support
- Viewpoints | Difficult to Buy Insurance? Buying insurance in the blockchain era will be as easy as taxiing in the internet era
- Bitcoin: 2020 debut
- New Diss Chain in Blockchain Industry: Fundamentalism vs Industrial Trends