Research Report | Cryptographic Liquidity Analysis: BTC, ETH and Stabilizing Coins are the most liquid assets
main conclusion:
1. Slippage is a better indicator of liquidity than trading volume.
2. The most liquid assets (BTC) and the least liquid assets (DENT), the difference between the two is more than 600 times.
3. Assets with higher market value and stable currency have better liquidity.
1. How to measure liquidity
To measure liquidity, this report uses slippage indicators to measure the impact of a purchase order on prices.
- Suspected fraud or trading volume is zero? Inventory the reasons why the year's encryption project disappeared
- Does Tether manipulate the market?
- Cross-border big frame: C-position of "emerging" station, "classical" sides
1.1. Slippage definition
Slippage is the difference between the expected transaction price and the actual transaction price. Orders with good depth and high liquidity have lower slippage points, while orders with deeper intersections and lower liquidity have high slippage points.
1.2. Calculation of slippage
First, we take a high-precision snapshot of the order every hour. Then, we calculate the slippage of the $10,000 order and average the data for the slippage for more than a month. For more details, please see the following sections.
1.3. Slippage vs. Trading Volume
Slippage is an ex ante indicator of liquidity, while trading volume is an ex post indicator. Using trading volume to measure liquidity can also lead to negative incentives for false trading volumes. We believe that slippage is a better measure.
2. Data set
The data set for this report includes assets, sources, time periods, and precision.
2.1. Assets
Base assets include BTC trading pairs and USDT based trading pairs. If an asset has two trading pairs, BTC and USDT, we use the trading volume weight to obtain the slippage of the asset.
2.2. Data source
In this report, we used Binance's August 2019 data. Versions after the report may include data from other transaction pairs.
2.3. Precision
Use different precision order data.
3. The liquidity distribution of cryptocurrency
Liquidity follows a power exponential distribution, in which more than 80% of assets slippage is greater than 5%, and more than 60% of assets slippage is greater than 1%.
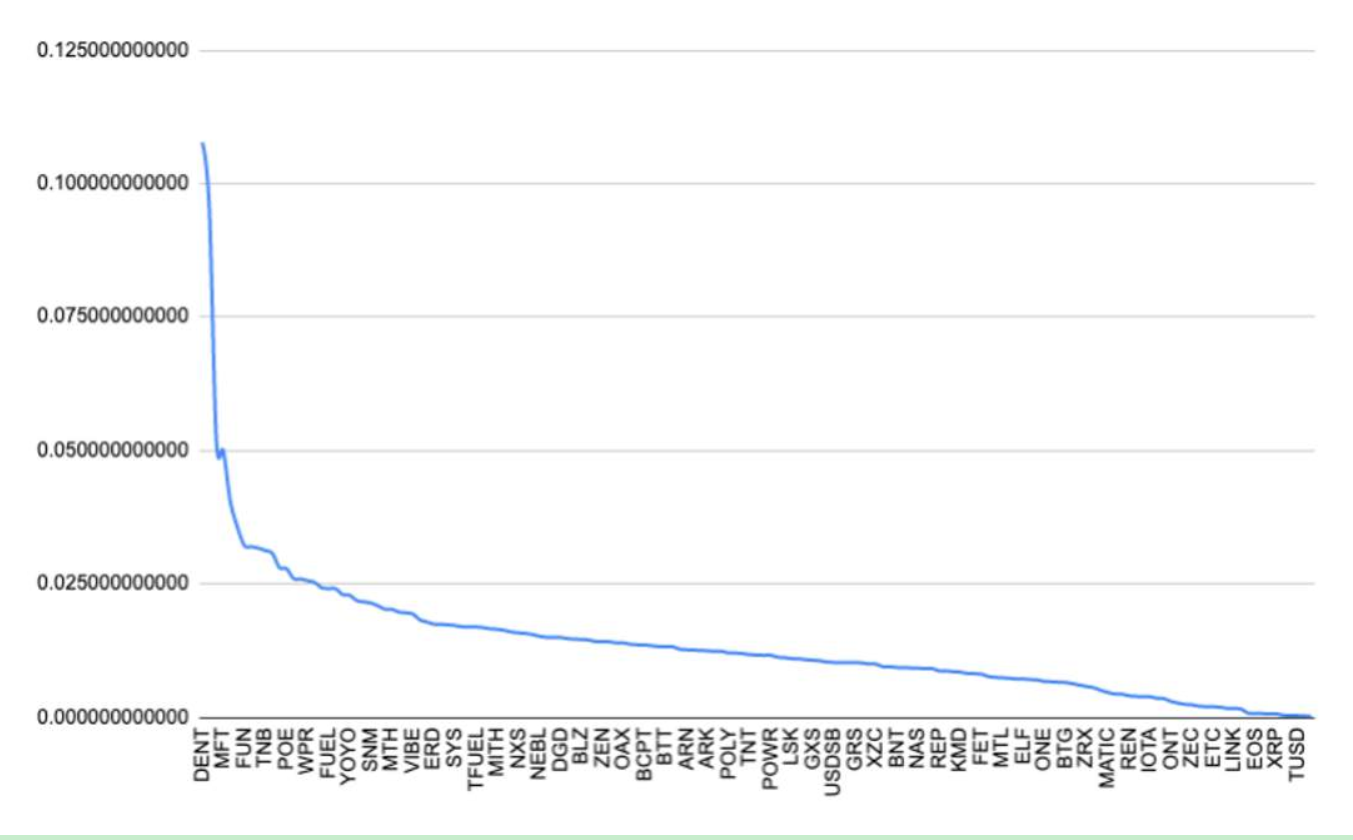
Figure 1 Liquidity distribution of cryptocurrency
4. Top 20 cryptocurrencies for liquidity
BTC, ETH and Stabilizing Coins are the most liquid assets. Even the most liquid tokens, the slippage between them is very large. The slippage of the 11th asset is twice the number 10th. Bitcoin slippage is 15 times better than the 20th asset.
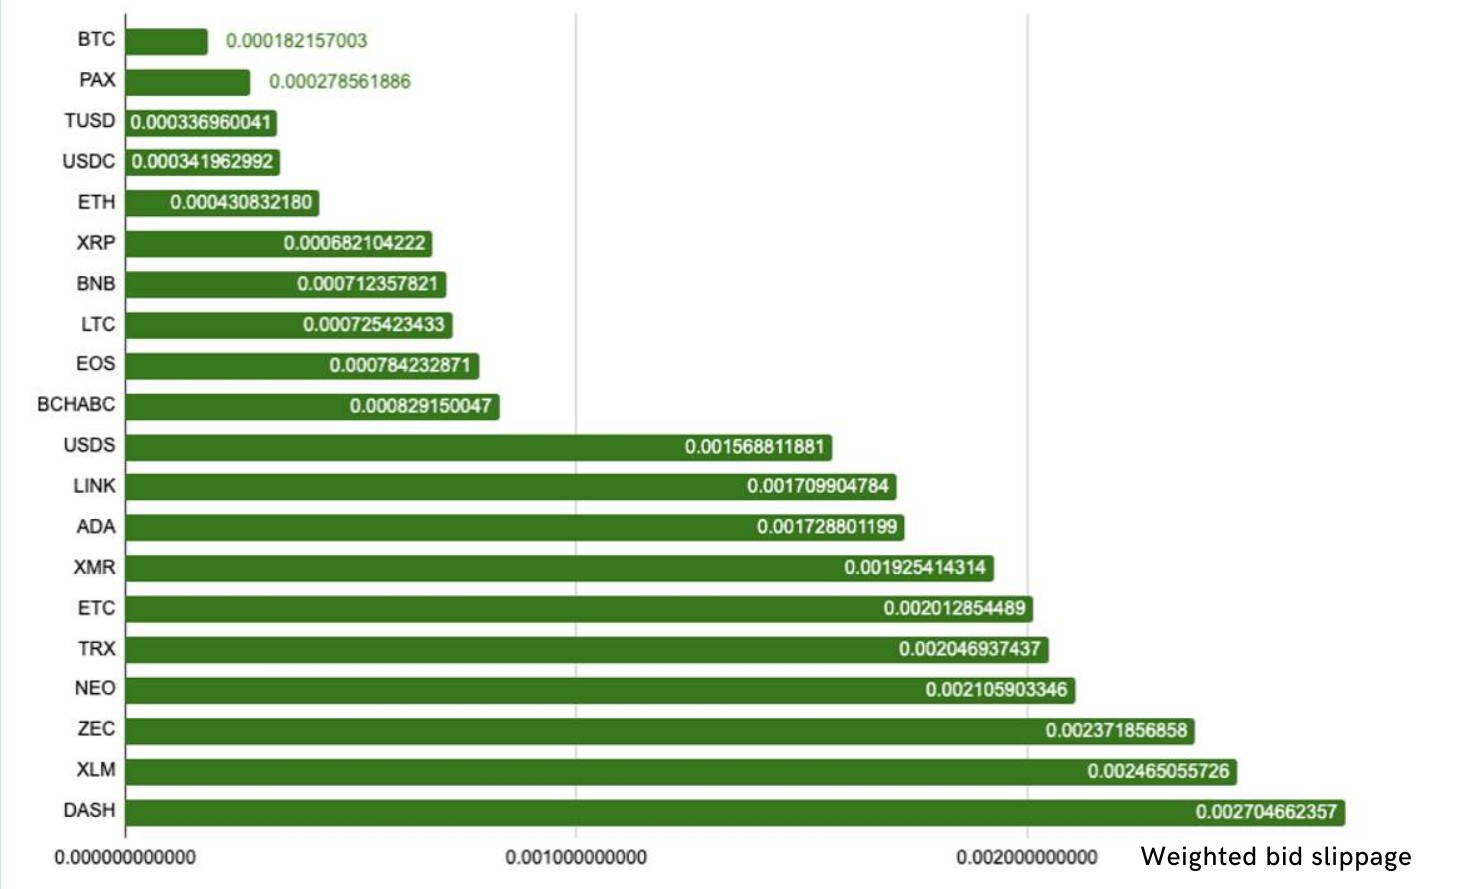
Figure 2 Top 20 digital currencies in liquidity
5. The cryptocurrency of the liquidation ranking countdown 20
There is a clear deficiency in the liquidity of long tail assets. One of the fundamental reasons for the liquidity problem is the lack of effective market makers. Professional market makers have no incentive to perform technology integration and maintain long-tailed assets with poor liquidity.
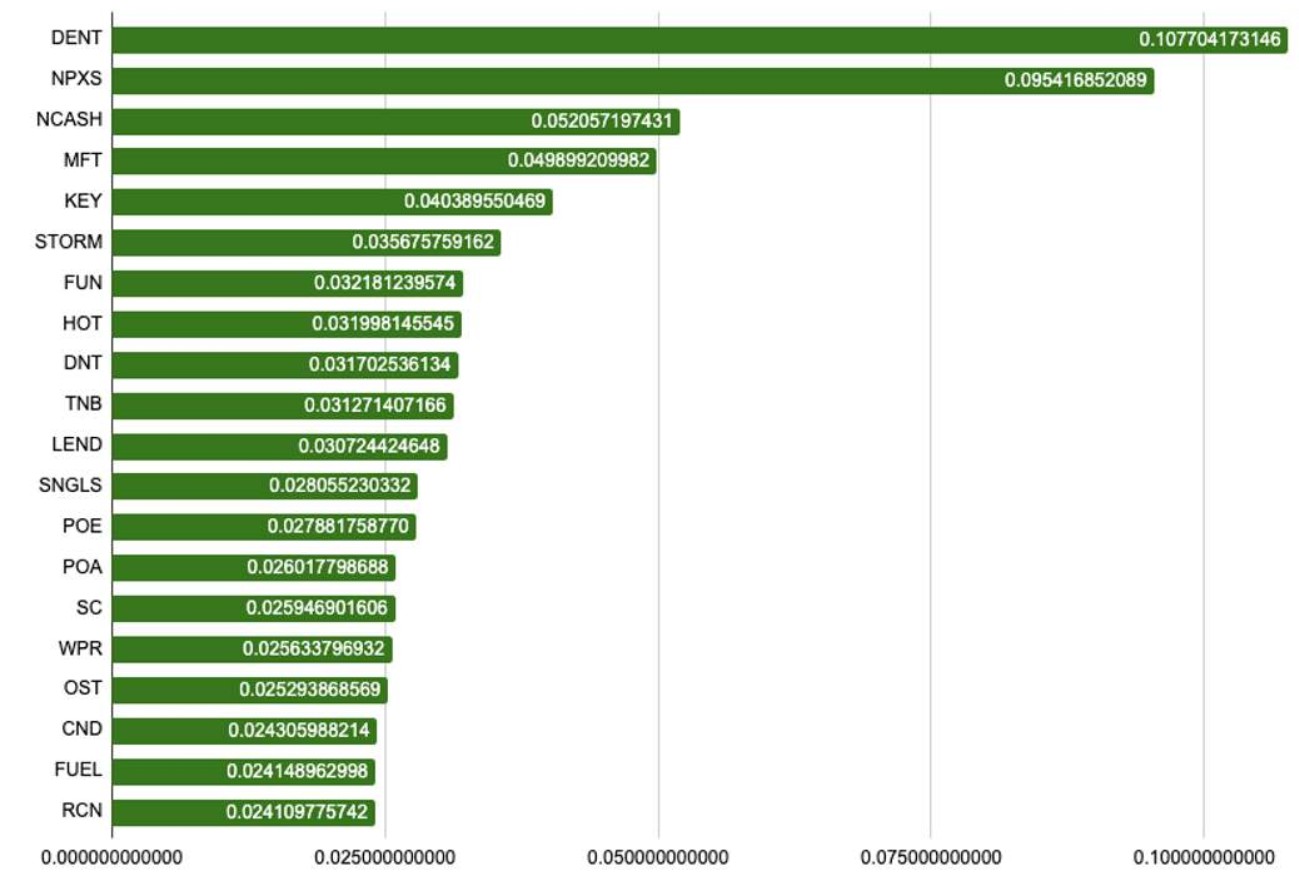
Figure 3 Digital currency with a bottom 20 liquidity ranking
6. Analysis of the correlation between liquidity and market value
There is a strong positive correlation between liquidity and market capitalization. Taking August as an example, the correlation coefficient between liquidity and market value is 0.76. However, there are also abnormal cases. Although the market value of Harmony Protocol (ONE) and Matic Network (MATIC) is very low, their slippage is also very low, while DogeCoin (DOGE) and Dent (DENT) have lower market value, but the slippage is compared. high.
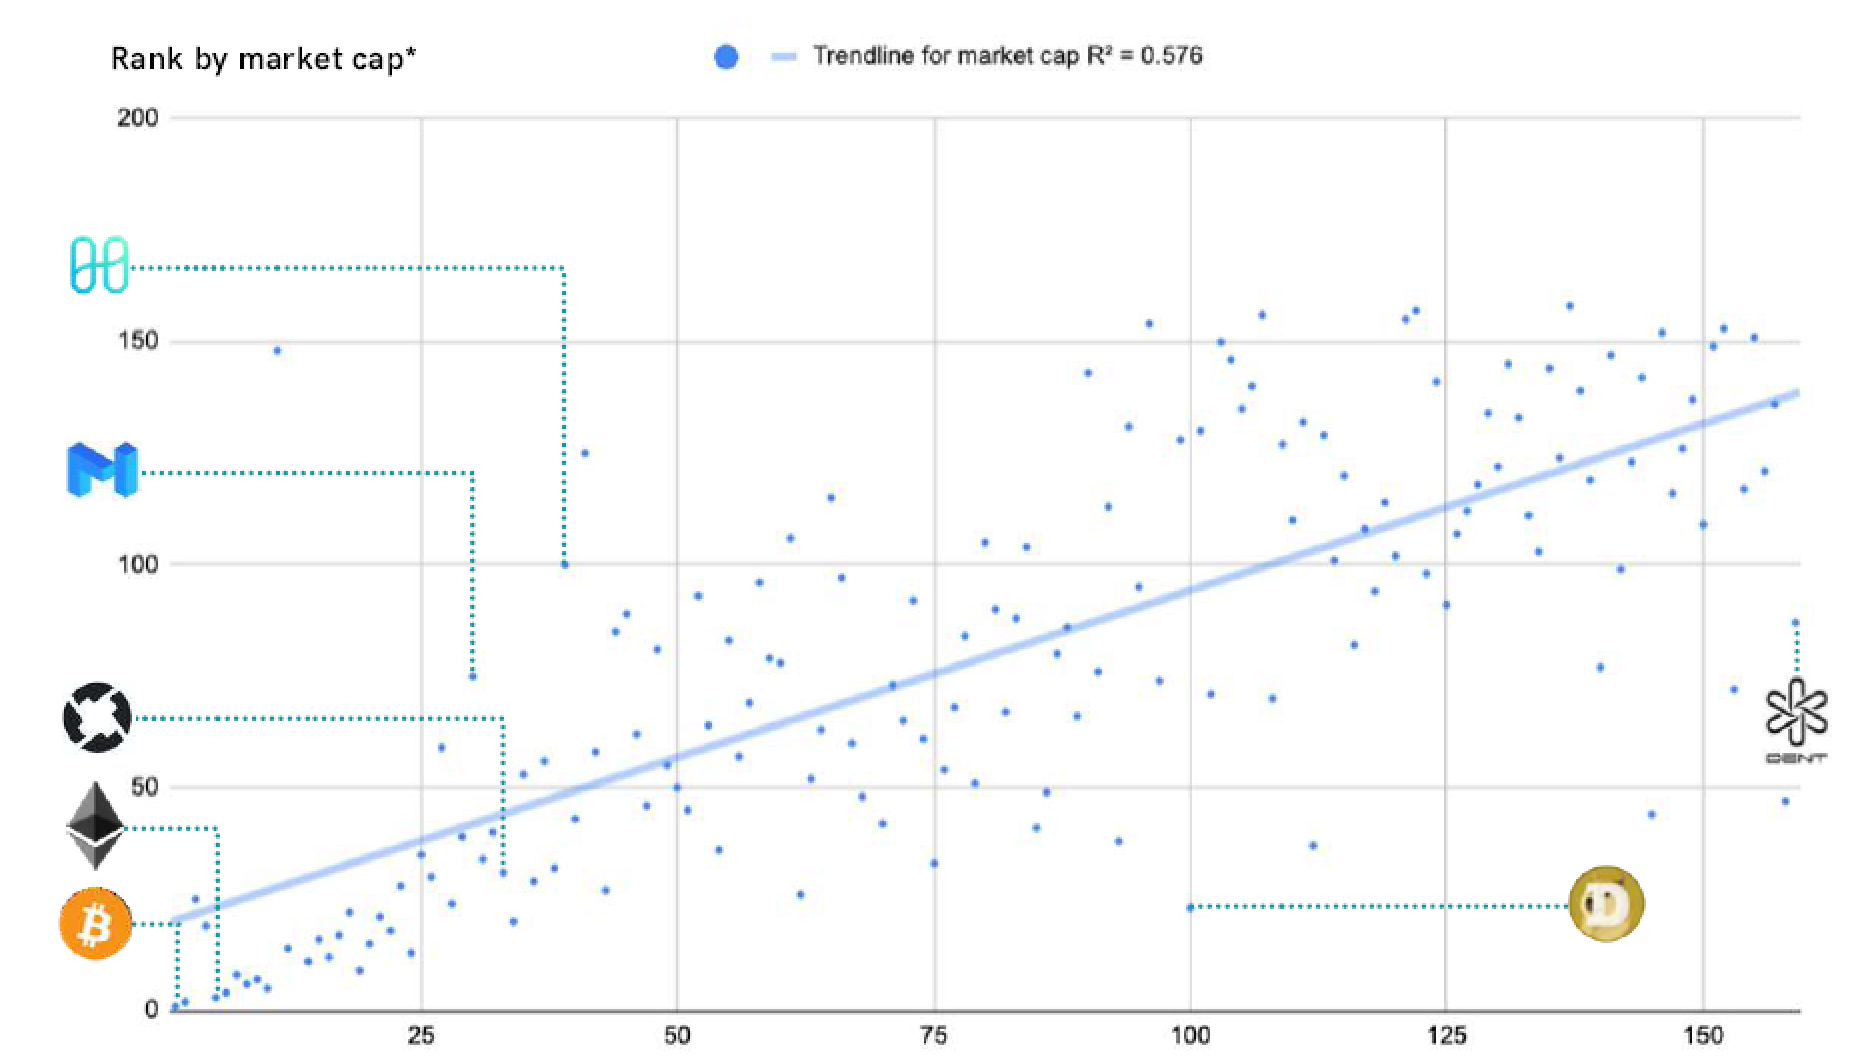
Figure 4 Correlation between market capitalization and liquidity in the top 150 (Source: coinmarketcap.com)
7. Analysis of the correlation between liquidity and price fluctuations
There is no significant relationship between price volatility and liquidity. Changes in prices in August 2019 are not related to liquidity, as cryptocurrencies tend to fluctuate in the same direction in the short term.
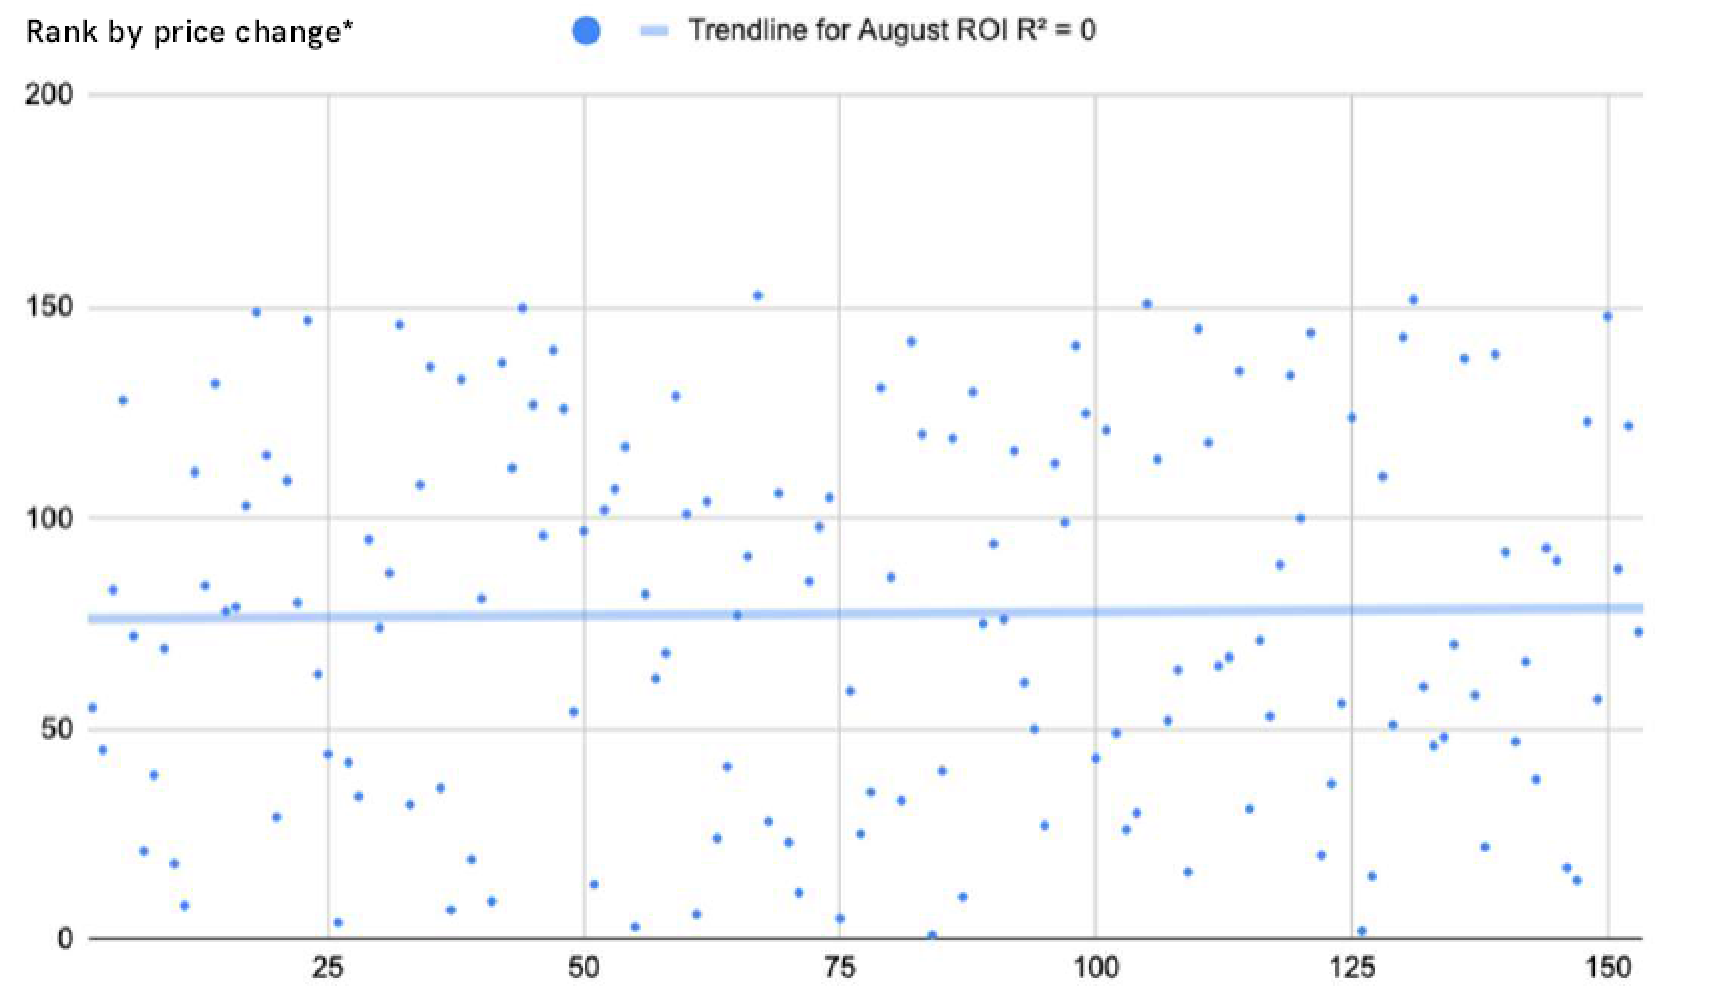
Figure 5 Correlation between price fluctuations and liquidity in the top 150
8. The method used by the model
8.1. Calculation of slippage
We use the WebSocket API of the Binnance Exchange to obtain different order data and complete transaction data for each single transaction. This allows us to re-simulate the orders and transactions for August 2019.
. Then we take a snapshot of the order every hour and calculate the slippage between the middle price and the execution price percentage difference, where:
Intermediate price = (lowest sell order price + highest buy order price) /
Execution price = actual transaction price of $10,000 order
We calculate the sell order slippage and the buy slippage, average the two, and then export the snapshot slippage for each trade pair.
8.2. Regression analysis
Since we take an order snapshot every hour, we have 720-744 slippage data for a given month. Then, the arithmetic average of the data for more than one month is calculated to calculate the monthly average slippage of each transaction pair.
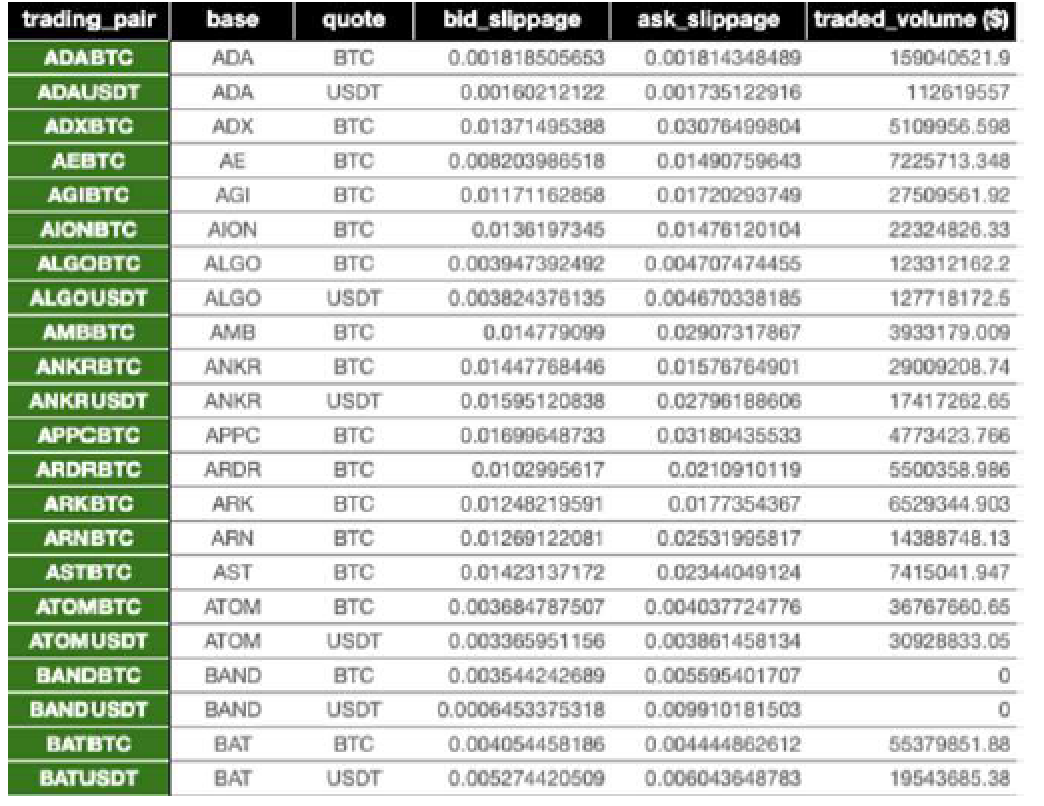
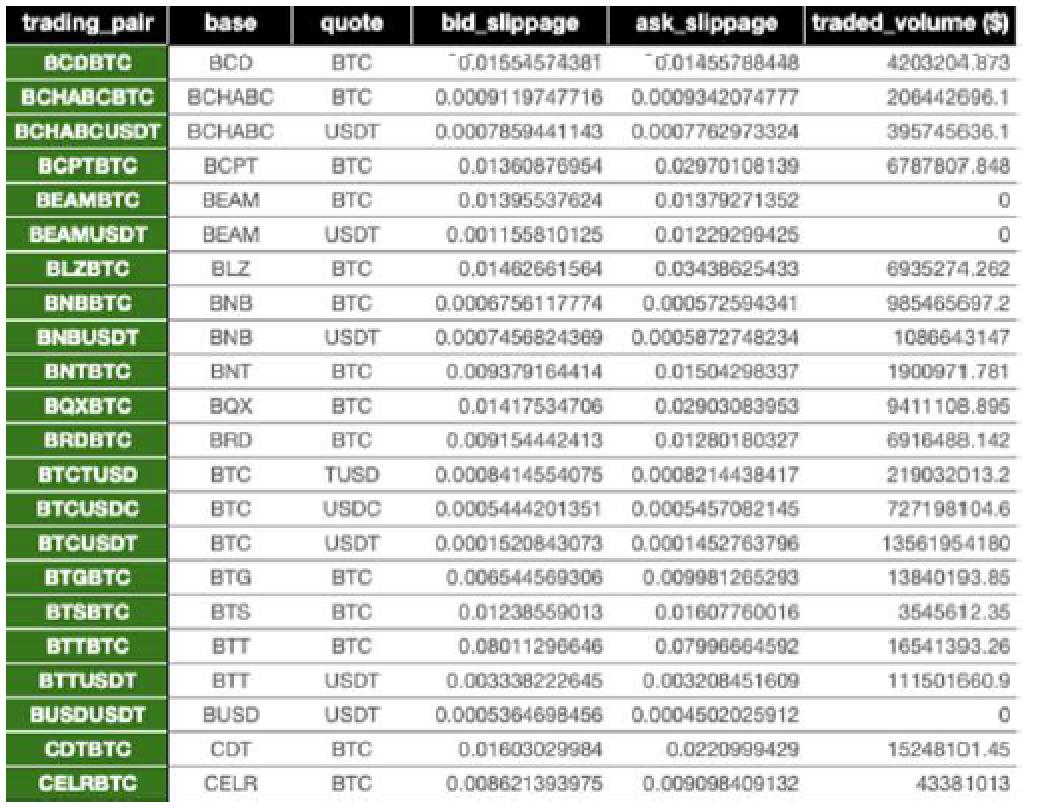
9. Appendix: Raw Data
Author: Hummingbot
Compilation: Dcoin Coin Research Institute
We will continue to update Blocking; if you have any questions or suggestions, please contact us!
Was this article helpful?
93 out of 132 found this helpful
Related articles
- A number of mining machines approached the shutdown line, and only half a year later, the mining machine has to sell it?
- I understand the current status of blockchain games: To what extent is it going to happen, will there be hope in the future?
- In Devcon 5, Osaka, I saw Ethereum's diverse DeFi ecology.
- Introduction to Blockchain | Cryptography in Bitcoin: Fundamentals of Digital Signature and Transfer
- Wang Xing Mi will V Shen Shen Nanpeng, the US group "touch chain" fire cooking oil
- The first securities based on the cryptocurrency market was approved! Grayscale: The agency is still curious about cryptocurrencies
- Encrypted currency investment and Bo silly theory: Who is the last fool?


