Outlier Ventures Data-Driven Token Design and Optimization
Outlier Ventures Token Design and OptimizationDr. Achim Struve | Speaker
Sissi | Translator
Editor’s Note:
In the token ecosystem, achieving sustainable development is crucial. Outlier Ventures’ latest video provides a comprehensive perspective on the key issues facing the token ecosystem and offers practical solutions and tools to address these challenges.
- EIP-7377 An excellent solution for migrating from EOA to smart contract wallets before the popularization of account abstraction.
- LianGuai Daily | Sequoia Capital reduces the size of its cryptocurrency fund to $200 million; French privacy regulatory agency launches investigation into Worldcoin.
- African Gold Rush I Help Chinese Citizens with Worldcoin KYC, Earning up to 20,000 RMB per day
The video emphasizes the principles and methods of token engineering, which provide a new perspective for planning and constructing token systems. Additionally, a series of practical tools such as agent-based simulation tools, QTM, etc., are introduced. These tools can provide valuable information at different stages and help projects make wise decisions. With the help of these auxiliary tools, Web3 startups have the opportunity to achieve sustainable growth.
Outlier Ventures’ video brings us a new understanding, highlighting the crucial role of token engineering and related tools in project teams’ response to changes. These tools have proven to be powerful weapons for adapting to the ever-changing token ecosystem. This understanding is formed through in-depth research and practice of the token ecosystem, enabling participants to better understand the dynamics of the ecosystem and make wiser and more visionary decisions. The following is a translation and summary of the content of the video. For more content on token engineering, please refer to previous articles in this public account.
Three Stages of Token Design and Optimization
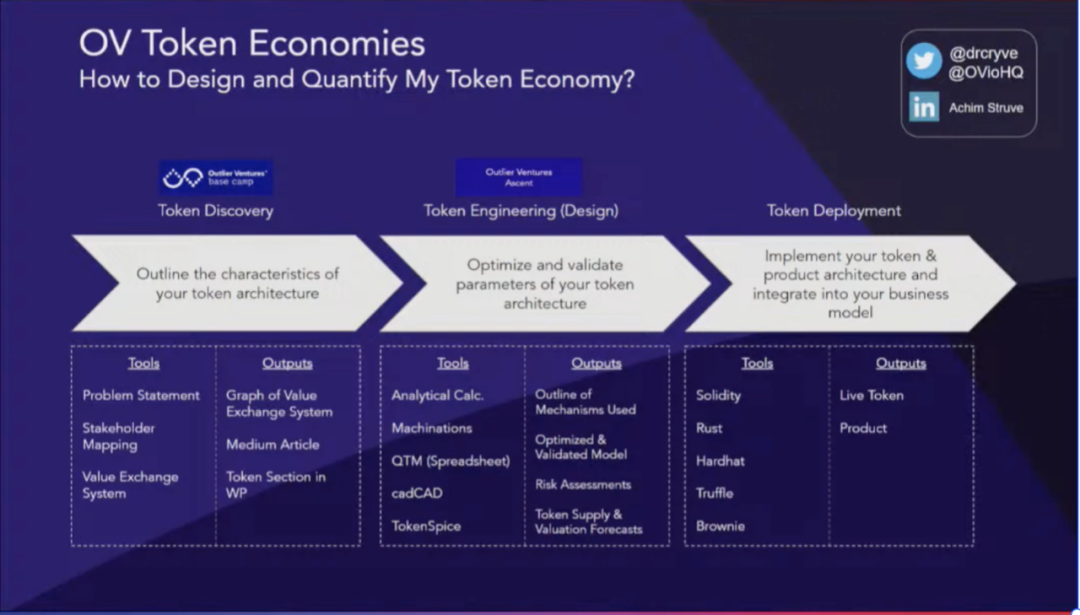
Discovery Stage
In building a successful token ecosystem, key steps need to be taken at the macro level of the ecosystem. First, the problem must be clearly defined, and the challenges faced must be clearly stated. Second, the flow of value between stakeholders needs to be clearly defined to ensure the robustness and balance of the ecosystem. At the same time, a thorough discussion and consideration of the entire ecosystem and the rationality of its tokens, including the reasonable use of tokens, are required. In addition, high-level planning is also indispensable, covering how to effectively use tokens and design solutions for various aspects. These key steps are essential elements in building a successful token ecosystem.
Design Stage
In the construction of the token ecosystem, parameterization is another key step that involves the use of quantitative tools such as spreadsheets and simulation tools like cadCAD, Token Spice, Machinations, etc. These tools can help people obtain optimized and validated models for risk analysis and prediction, thus gaining in-depth understanding of the trends in token supply and valuation. Through these quantitative tools, a better understanding of the operation of the ecosystem can be achieved, providing strong support for its design and optimization.
Deployment Stage
The deployment stage is crucial, as it translates the previous theoretical analysis and design into practice by actually deploying the ecosystem onto the blockchain. In this stage, various tools are used, including different programming languages such as Solidity, Rust, etc., and deployment environments such as Hardhat. Through this process, the final result is the actual ecosystem token or product, enabling it to be realized and operated on the blockchain.
Token Design Tools
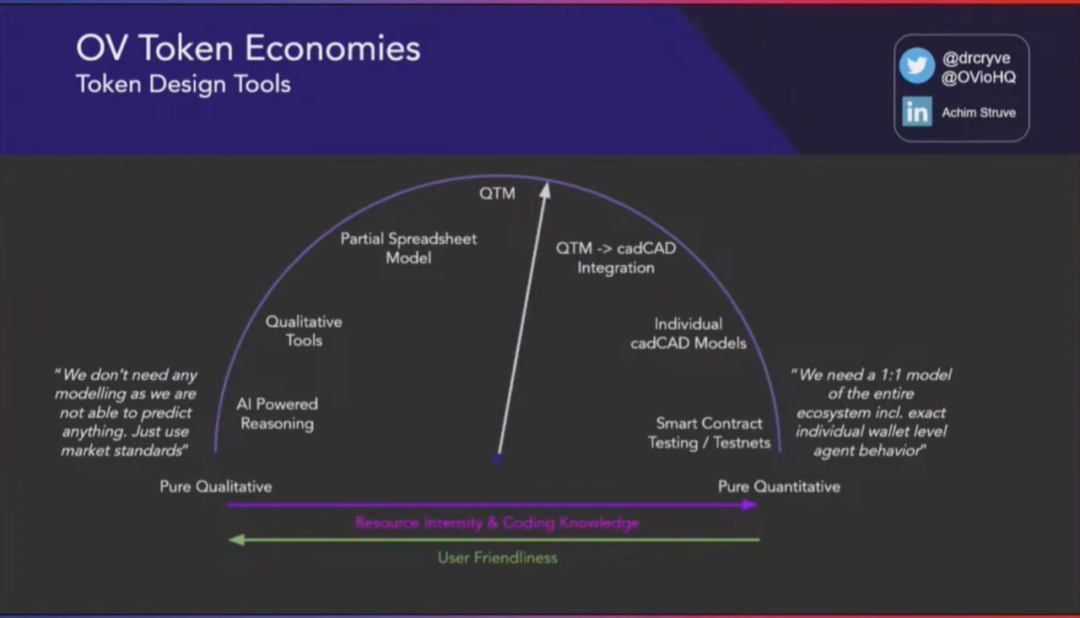
In the three different stages (discovery, design, and deployment), we need to use a series of tools, and the focus and types of these tools can also vary in different fields. They are not only applicable to the DeFi field, but also to various application projects, infrastructure, games, and other fields.
When considering the details, there are two perspectives: one perspective believes that we can view the ecosystem from a qualitative perspective, and using market standards is enough without any simulation. The other perspective believes that a digital twin is needed to create a 1:1 simulation of the entire ecosystem because it involves a large amount of financial risk. As we move towards a more precise direction and increase resource intensity, the required programming knowledge will also increase. This also increases the requirements for users – they need to have programming skills to handle more complex models, which may affect user friendliness. Therefore, to build a more detailed ecosystem model, more programming knowledge is required, and a sufficient understanding of mathematics is also needed.
In the token ecosystem, there are various tools available to help us understand and design the system. On the left side of the “Token Design Tools” diagram, there are spreadsheet models and some qualitative tools, such as problem statements, stakeholder problem statements, stakeholder mapping, and specific value flows. We can even use AI-driven reasoning, such as using machine learning models to draft the first token design. In the middle part of the diagram, there is QTM (Quantitative Token Model), which is also a spreadsheet model, but it covers multiple different fields, not just DeFi. This wide coverage may result in a loss of accuracy, but it can indeed help startups gain first-hand insights and a preliminary understanding of their token ecosystem.
On the left side of the diagram, there are simulation tools such as cadCAD that can model the ecosystem 1:1 in complex environments. Overall, choosing the right tools and methods in the token ecosystem is crucial for the success of startups. Different types of tools can provide valuable information at different stages, helping companies make wise decisions and promoting the continuous development of the ecosystem.
Overview of QTM
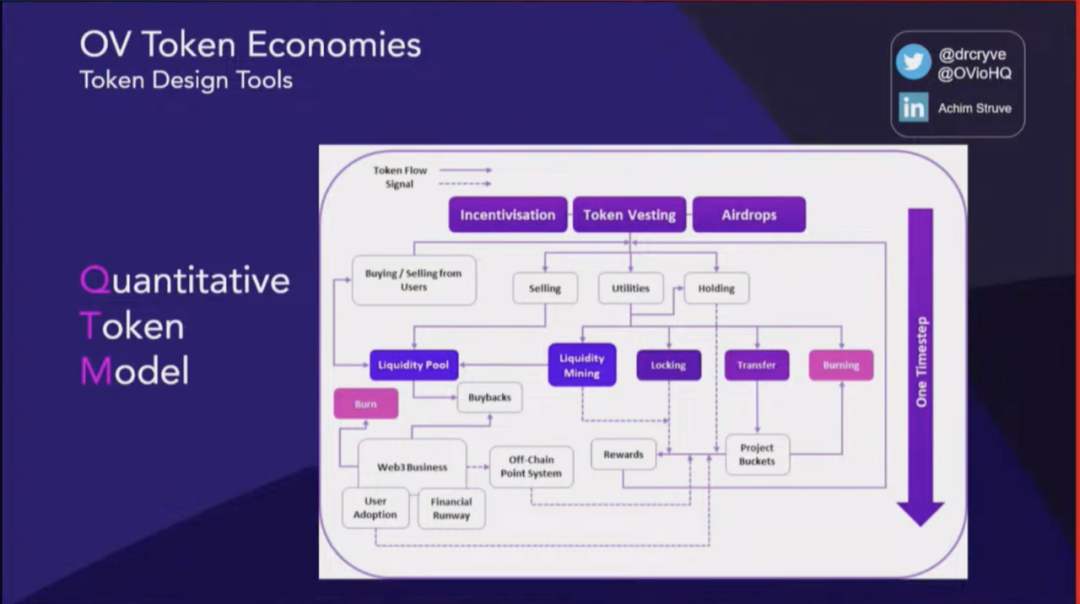
QTM is a quantitative token model that adopts a fixed simulation time of 10 years, with each time step being one month, so it is more like a macro simulation model rather than a highly accurate model. At the beginning of each time step, tokens are emitted into the ecosystem, so the model includes incentive modules, token ownership modules, airdrop modules, etc. These tokens will then be distributed into several meta buckets for further refinement of generalized utility. Rewards payments are defined from these utility tools. In addition, aspects of off-chain business are also considered, such as general financial conditions of the business, which can include burning or repurchasing, as well as measuring user adoption or defining user adoption scenarios.
However, it should be emphasized that the quality of the model’s output depends on the quality of the input. Therefore, before using QTM, sufficient market research must be conducted to obtain more accurate input information and gain a deeper understanding of what is happening. This can result in output results that are closer to real-world situations. QTM is considered an educational tool for early-stage startups to help them understand their own ecosystem, but no financial advice should be derived from it, nor should it rely solely on its results.
Data Analysis
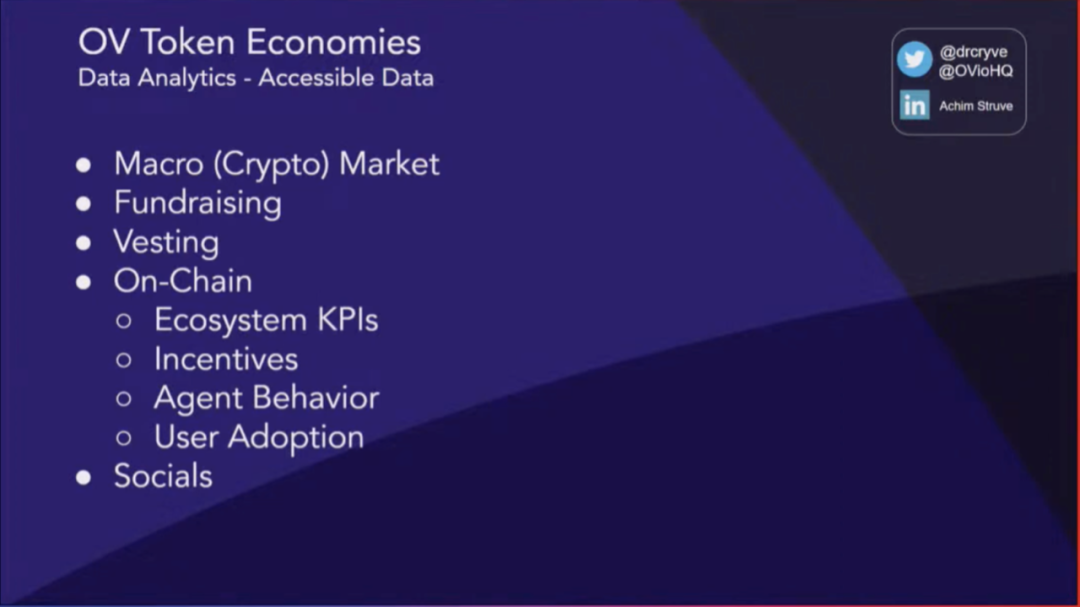
Next, let’s understand the different types of data that can be extracted from a data analysis perspective. First, we can observe the overall market development from a macro market perspective, including the DeFi market and the cryptocurrency market. Then, we can focus on indicators of fundraising rounds to understand the project’s financing situation, such as the amount of funds raised, valuation, and supply sales in different rounds. Second, we can also study the behavior patterns of participants to gain a deeper understanding of other people’s investment habits.
Compared to traditional finance, on-chain data has significant differences because on-chain data is publicly visible to everyone, and almost every transaction in the ecosystem can be viewed. As a result, various indicators can be obtained, such as user growth, total locked value (TVL), trading volume, etc. More importantly, we can observe how different incentive mechanisms affect the operation of the ecosystem. In addition, social media platforms such as Twitter, Reddit, Discord, and Telegram play important roles in token economics and project performance.
These pieces of information are publicly available and very valuable data. We should make full use of this data to better understand ecosystem parameters and validate our model.
Here is an example where we can look at data similar to vesting creations. Although this example is just a small sample, in general, vesting periods of different stakeholders can be observed. In the chart above, you can see the minimum, average, median, and maximum vesting periods, which are analyses of vesting periods in different domains. It can also be further segmented to differentiate different industry sectors. This way, you can see that the data distribution in different sectors may vary greatly. Although these numbers may not always be optimal, they provide us with a starting point.
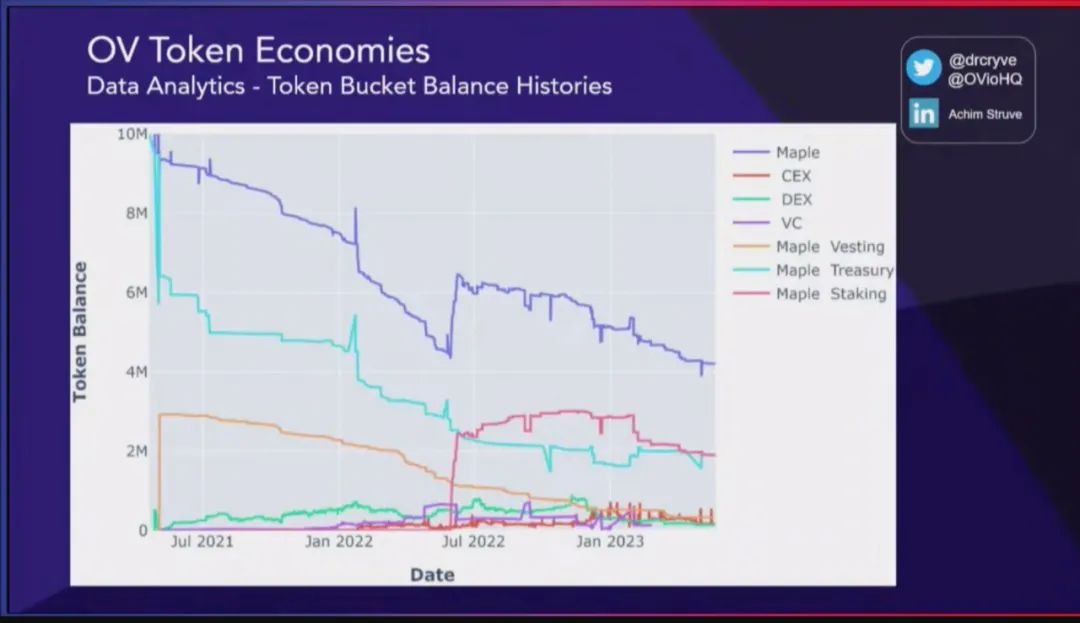
Let’s take another example regarding the historical balance of a token bucket. Taking Maple Finance as an example, you can see the situation of its native token and track all transactions in the entire ecosystem, categorizing them into specific “token buckets,” such as addresses related to Maple, addresses related to centralized exchanges, and addresses related to decentralized exchanges, etc. In this way, we can view the balance of each stakeholder and observe what is happening in the entire ecosystem.
In this example, it may be found that the balance of all Maple addresses has been decreasing until mid-July 22nd, due to the introduction of the staking contract, which resulted in a large supply of tokens being allocated to the staking contract. We can also observe the participation of venture capitalists in this staking program, and this information can be directly inferred from the chart. In addition, we can also observe how the balance of exchanges changes over time, which is very helpful for understanding what is happening in the ecosystem. Finally, we can study the behavior of individual staking or specific addresses to gain a deeper understanding of the relevant situations.
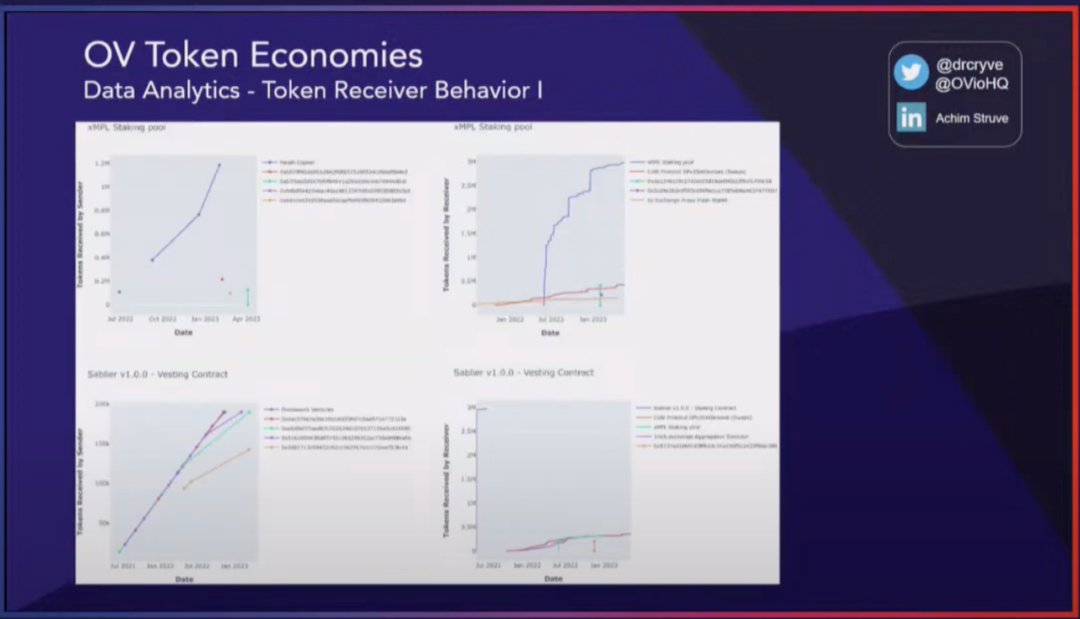
In the token ecosystem, observing the behavior of specific addresses can provide important information about token liquidity. For example, when tokens are sent from the staking contract to specific addresses, we can understand how the recipients handle these tokens. Do they choose to reinvest these tokens, send them back to the staking contract, or sell them off or deploy them elsewhere? These are key pieces of information for understanding the behavior of each stakeholder through analysis, and we can feed this data back into our model to help adjust the model.
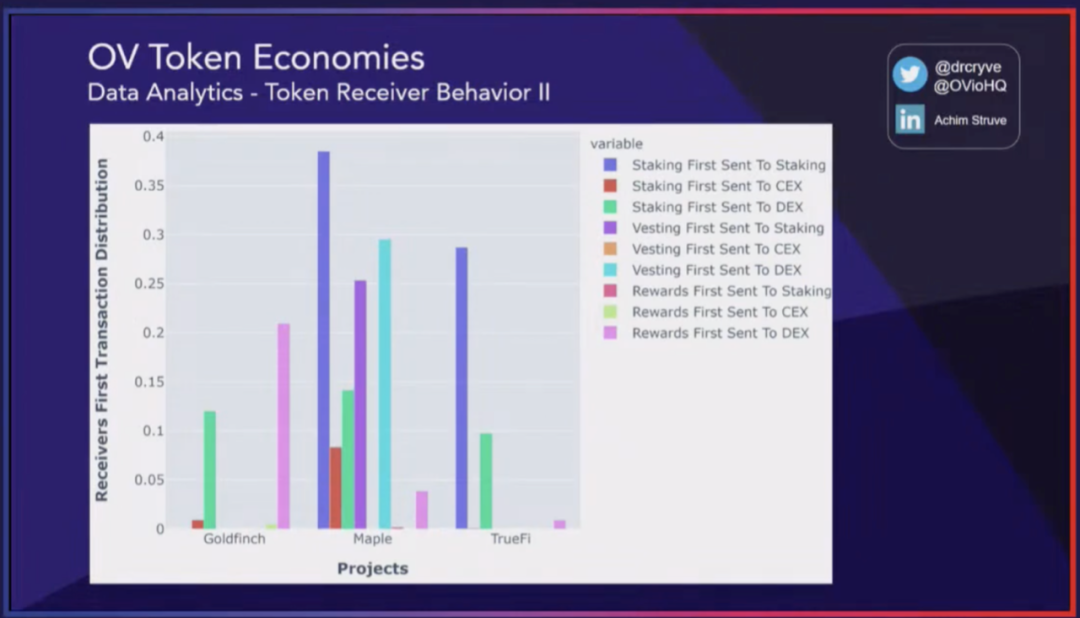
This model can not only analyze the behavior of token recipients at individual addresses, but also analyze representative aggregated stakeholder groups. For example, we can analyze multiple token projects such as Maple, Goldfinch, and TrueFi, and find that approximately 38% of tokens are sent back to the staking contract as the first transaction after being received through the staking contract. In contrast, the proportion for centralized exchanges is about 8%, and for decentralized exchanges, it is about 14%. By reviewing the token bucket allocation at a certain point in time on QTM, we can understand the circulation supply of tokens. These values can be applied to our parameters to gain a preliminary understanding of the behavior of the ecosystem.
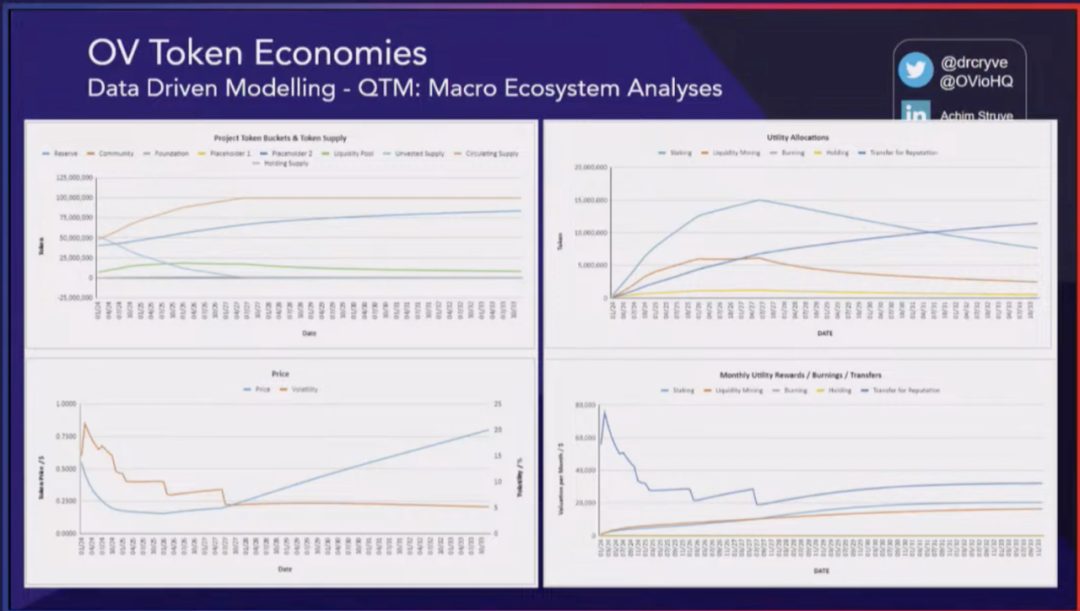
With this data, we can make predictions, such as predicting the balance supply of different buckets in the ecosystem in the next decade or so, including foundations, teams, staking allocations, overall circulation supply, and liquidity pools, etc. Simulations or predictions of prices can also be conducted. It should be emphasized that these predictions are not for speculation or financial advice, but rather help us understand the relationship between supply attribution and token demand, in order to understand the balance between these two factors.
In addition, other aspects can also be analyzed, such as the allocation of different utility parts. For example, we can understand how many tokens are staked, how many are used for liquidity mining incentive programs, or if there is a burning mechanism, how many tokens are burned. If tokens can be used in stores or elsewhere, we can also observe monthly utility rewards to understand the value of these incentives in USD. Understanding the overall usage of tokens is very important, especially when considering cost factors in incentivizing the ecosystem.
Data-Driven Model
Another theme is a new way of thinking about token distribution plans. Sometimes people think that a very long token distribution plan is all that’s needed, but this is not always good because it means that the supply is very low in the initial circulation, leading to speculation and potential manipulation in the market. Therefore, we propose introducing a token distribution mechanism that adjusts the allocation, unaffected by market demand. In other words, predicting the demand of the ecosystem is not necessary because the distribution will be controlled by the controller based on certain predefined key performance indicators. These key performance indicators can include TVL, trading volume, user adoption rate, business profitability, and so on. In this example, the token price is simply used.
In the token ecosystem, the relationship between allocation and price can be understood by analyzing real token examples. For example, in the first year of the ecosystem, a large supply enters the market through allocation, but due to the product possibly not being mature enough and the market demand being insufficient, adoption may be low, resulting in a decrease in token price. This situation can be simulated using models like QTM, from which similar behavior can be observed: in the initial stage, the token price may decrease due to a large supply entering the market. Then, over time, as adoption changes and users start joining and bringing in increased revenue, buybacks can be conducted and the price will eventually recover.
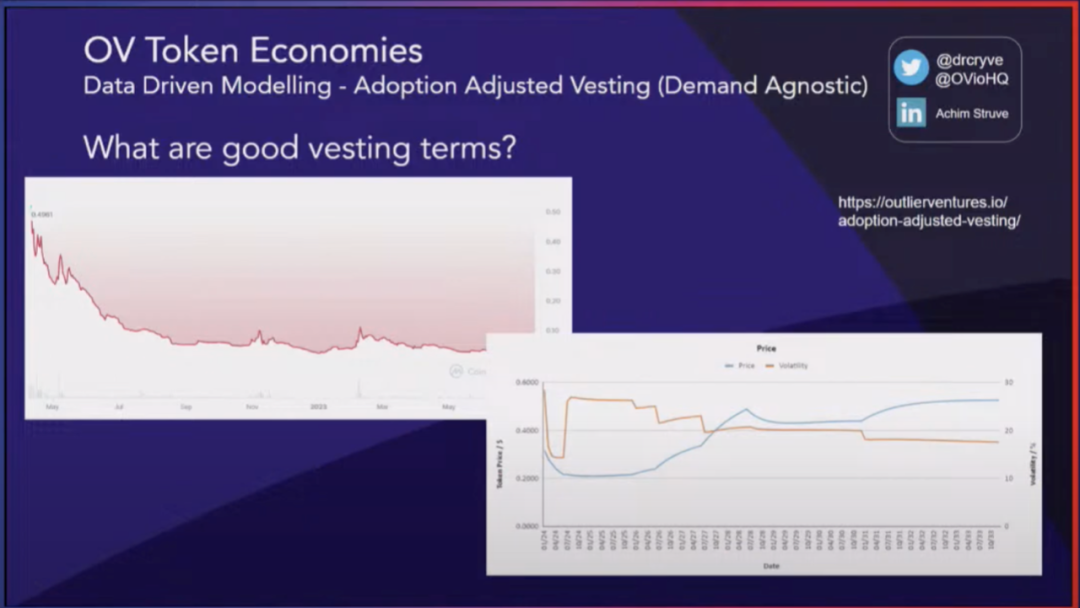
In the model, three different demand scenarios can be simulated: logical function, linear function, and exponential growth. The controller essentially manages different emission levels at different time points, and it can be seen that for each different growth and demand scenario, the controller will manage different release amounts at different time points.
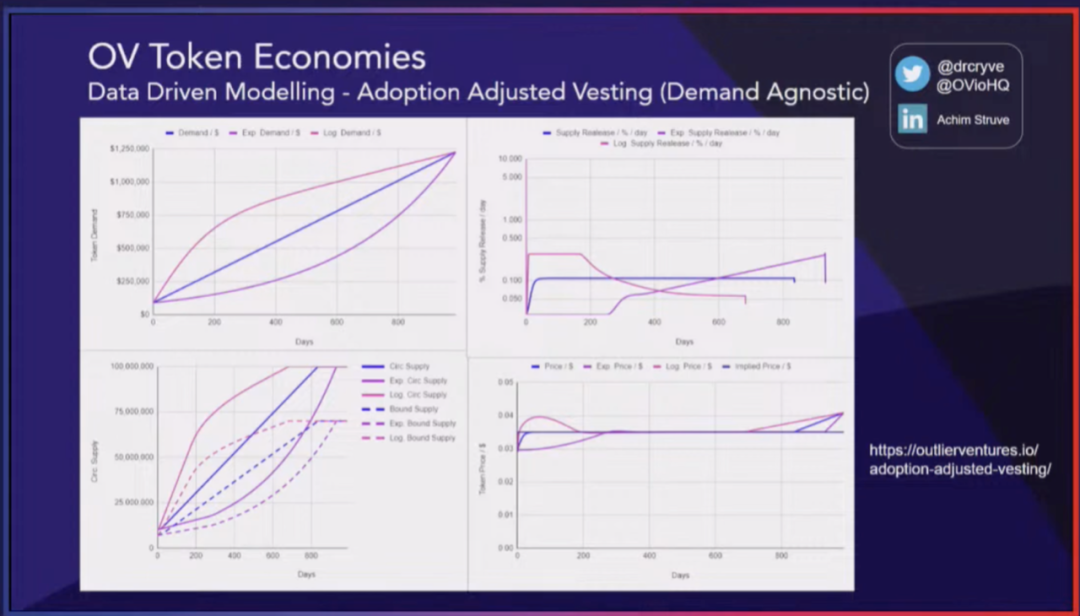
When the token price rises, more tokens will be released into the ecosystem, which may cause early investors to sell tokens and lead to a price decrease. Conversely, when the price is below the predetermined price, the token issuance will decrease. However, the token issuance will not drop to zero because we need to ensure that all initial investors eventually receive their fair share. Through this control mechanism, the token price will rise again, ultimately reducing volatility and stabilizing the ecosystem.
Price is a very important indicator in the ecosystem. A 90% price drop in a year would be very detrimental to the ecosystem. Although we know that we cannot accurately predict the future, we should at least consider the demand aspect and try to model and predict it. This does not mean pursuing a specific result or specific value, but exploring the entire available solution space through Monte Carlo simulations and parameter scans. Doing so can help us understand the possibilities in different scenarios and formulate more comprehensive and flexible strategies.
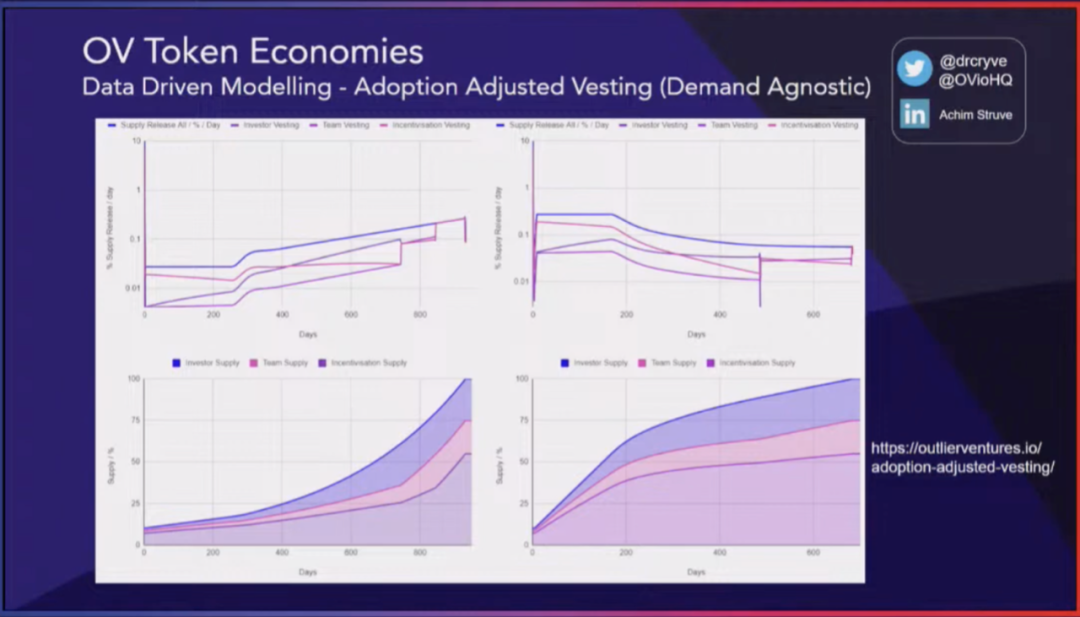
In addition, we can also allocate these ownerships in different weighted distributions. For example, in the initial stage, the ecosystem incentives may receive a larger allocation of tokens, while the team may receive a smaller share. However, over time, the situation may change because we do not want to rely solely on token ownership to drive the development of the ecosystem. We aim to establish a sustainable growth model.
Original video: https://www.youtube.com/watch?v=Yv7VvLVELCQ
We will continue to update Blocking; if you have any questions or suggestions, please contact us!
Was this article helpful?
93 out of 132 found this helpful
Related articles
- Interview with EthStorage Founder How to Scale Ethereum’s Storage Performance through Layer 2 Expansion?
- The Fit21 encryption bill of the American Republican Party has been approved and will enter the full deliberation of the House of Representatives.
- LianGuai Paradigm Stablecoins have their unique characteristics and should not be included in the regulatory frameworks of banks and securities.
- Raft’s ten thousand character research report Decentralized lending protocol, the second largest LSD stablecoin $R issuer.
- Be vigilant of hidden Rug Pulls, as well as exit scams caused by contract storage.
- LianGuairadigm proposes ten potential trends, and intent-centric ranks first. What is intent-centric?
- Web3 Mobile Review Can the encryption industry usher in an iPhone moment?