Breaking down the past three Bitcoin cycles: what will drive the next cycle?
Analyzing Bitcoin's 3 previous cycles: predicting the next.Author: Michael Nadeau; Compiled by Luffy, Foresight News
The next Bitcoin block reward halving is expected to occur around April 8, 2024. Historically, halvings have preceded three amazing bull runs. In this article, we break down the past three Bitcoin halvings and make predictions about the next cycle.
The topics we explore include:
-
What drives Bitcoin cycles?
-
Operational and network KPIs for the first three cycles
-
Price trends for the first three cycles
-
Predicting the next cycle
What Drives Bitcoin Cycles?
Every 210,000 blocks, the Bitcoin block reward is halved. Measured in time, halvings occur approximately every four years. It marks a change in Bitcoin’s monetary policy, reducing the block reward (network inflation) paid to miners by 50%.
Next April, the Bitcoin block reward will drop from 6.25 BTC to 3.125 BTC per block.
It is reasonable to conclude that a decrease in the new supply is the catalyst for each bull market.
The theory goes like this:
After the halving, miners sell less Bitcoin into the market. This consumes a large portion of sell-side pressure. Prices are at the boundary, and new buyers push up the price. Then, financial media starts talking about Bitcoin, people begin searching for it on Google, Bitcoin goes viral, new buyers enter the market, on-chain activity picks up, venture firms invest funds into new businesses supporting the ecosystem. So, more business = more marketing = more users, which stimulates more buyers, more on-chain activity, and more media coverage.
Voila, new all-time highs.
It’s a nice story, let’s see if the data supports it as fact.
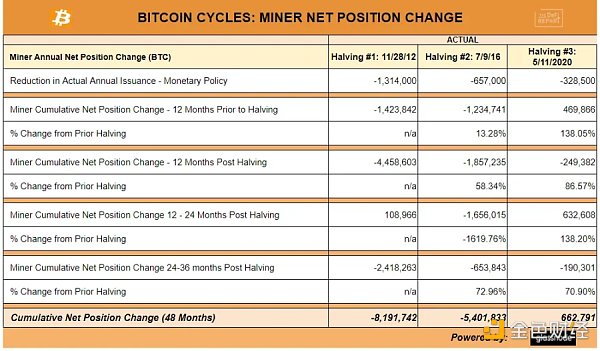
Net Position Change = Glassnode’s label for the net change in Bitcoin held by wallet addresses identified as belonging to miners.
First Halving: According to Bitcoin’s monetary policy, the annual new issuance decreases by 1,314,000. However, in the 12 months after halving, miners’ Bitcoin holdings decreased by 4,458,603, more than twice the decrease in miners’ Bitcoin holdings in the 12 months before halving. In 2013, as the price of Bitcoin rose, miners sold a large amount of Bitcoin. In the first halving cycle, a total of more than 8 million Bitcoins were lost from miners’ hands. As Bitcoin prices remained relatively low, buyers dominated the market.
Second Halving: In the 12 months after halving, miners’ Bitcoin holdings also decreased more than the previous 12 months. Once again, price trends were driven by buyers in the market. In the second cycle, a total of more than 5.4 million Bitcoins were transferred from miners’ hands.
Third Halving: Miners sold more Bitcoins after halving than in the previous 12 months. However, the third cycle was the first accumulation cycle for miners. We found that net positions increased by 93,000 in the past six weeks (starting with the fourth cycle).
The supply shock caused by miners’ reduced selling does not necessarily lead to a bull market. In fact, the number of Bitcoins sold by miners in the 12 months after halving is greater than any other time in the cycle.
That being said, the narrative of halving may attract new buyers, and the market can adjust itself. Therefore, even if data and narrative are contradictory, if people believe it to be true, it may be true. The market is reflexive, and the cryptocurrency market is particularly so.
But there’s more to this story…
Global Liquidity
You will hear less and less ridicule about the correlation between Bitcoin and global liquidity cycles, but this is where the data and price trends actually match up.
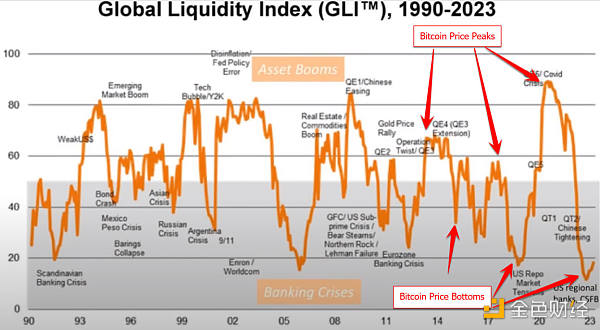
Data source: Federal Reserve, People’s Bank of China, European Central Bank, Bank of Japan, International Monetary Fund
Global liquidity seems to have hit bottom at the end of 22, marking the bottom of Bitcoin and the S&P 500. Earlier this year, we saw a slight rebound in global liquidity. Bitcoin rose 80%. The S&P 500 rose 15%.
In the United States, inflation has ended and the Federal Reserve has paused its rate hikes. Asset prices have risen since the beginning of the year and may continue to do so for some time.
However, there are also some clouds on the horizon and monetary policy may be changing.
Specifically, $7 trillion in U.S. debt will mature next year. These debts need to be refinanced/reissued to support fiscal spending. According to the Congressional Budget Office’s updated data in May 2023, the U.S. deficit is expected to be $1.5 trillion this year.
At the same time, debt interest payments have become the second largest expenditure for the U.S. government, approaching $1 trillion per year.
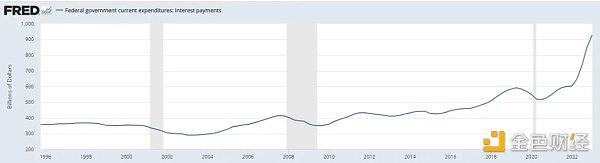
Data source: Federal Reserve FRED database
In October, 43 million Americans will resume student loan repayments, with an average interest rate of $503 per month. According to a survey, 37% of borrowers said they needed to cut other expenses. 34% said they were unable to afford the cost at all.
In addition, banks are still requesting to join the Federal Reserve’s regular bank financing program:
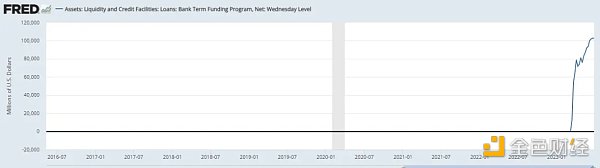
Data source: Federal Reserve FRED database
Consumer credit card loans hit a record high of over $1 trillion:
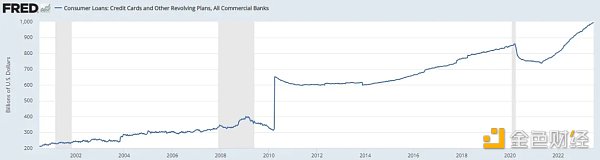
Data source: Federal Reserve FRED database
Bank loan standards also indicate that an economic recession is imminent:
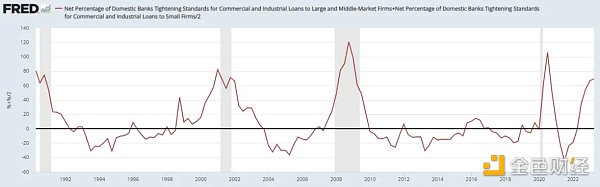
Data source: Federal Reserve FRED database
Finally, the commercial real estate industry has more than $1.5 trillion in debt that needs to be refinanced in the coming years. This is because interest rates are at their highest level since 2006. Of course, due to remote work, occupancy rates and valuations of office space have declined. To make matters worse, a group of Citigroup analysts found that more than 70% of commercial real estate office loans are held by regional banks.
These factors should bring further downward pressure on inflation.
Currently, the earliest CPI inflation swap will be priced at 2% inflation in October of this year. The Federal Reserve expects inflation to be 1.3% within a year.
Connect the dots:
The market price of Bitcoin is closely tied to liquidity. From a US perspective, liquidity conditions seem to have bottomed out. We’re also hearing the same from China and Japan. Europe is in a similar situation. As inflation returns to 2%, the global economy is expected to slow down.
At that point, the Fed will get the green light to change monetary policy.
This will open the floodgates for another quantitative easing wall. As for the timetable? We think this will happen in the next few years.
This liquidity shift is consistent with the Bitcoin halving cycle and the narratives that come with it.
The Innovation Cycle: Operational and Network KPIs
Got it? The Bitcoin cycle depends on liquidity. But liquidity isn’t everything.
If we consider factors like network growth, we may be onto something.
Liquidity + Network Fundamentals Growth + The Right Narrative = New Price Discovery.
The reflexivity of new price discovery = new VC funds. This brings more construction, more users, and further price discovery.
It’s a flywheel that drives actual capital formation and economic development through speculation. It’s messy, but it’s happening.
Bitcoin Network Basics
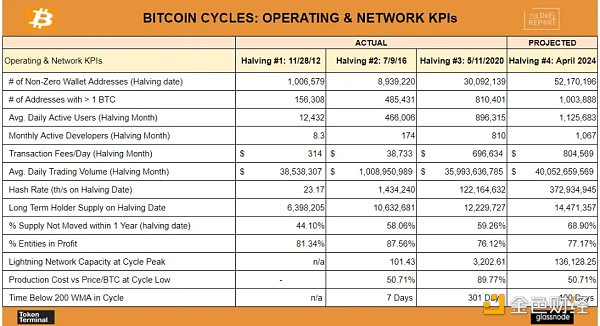
The Bitcoin network has been strong on almost every metric we track. We’ll list a few below:
Non-zero wallet count: We’ve seen stable growth in non-zero wallets in every cycle so far. Our prediction here is just an extrapolation of last year’s growth (currently at 47 million). Please note that this number does not represent all Bitcoin holders. Data is limited to on-chain wallets and does not represent the millions of exchange customers.
Developers: With the introduction of Ordinals protocol, we’ve seen recent increases in developer activity.
Hashrate: An indicator of network security and miner sentiment. Hashrate has tripled over the past two years, indicating bullishness among miners.
Long-term holder behavior: One of the most important metrics we track. The percentage of long-term holders and supply not moved in over a year is currently at all-time highs. Across cycles, we observe investors and users typically enter during bull markets. Then they learn more about Bitcoin and tend to become long-term holders. We can observe this from the growth in wallets with over 1 BTC, which recently surpassed 1 million. As long-term holders grow, it sets the foundation for the next bull market, where buyers will eventually dominate the market.
Lightning Network: The Lightning Network is the second layer scaling solution for Bitcoin. It enables transactions at a much lower cost than on the Bitcoin mainnet. Although still in its early stages, we can see that transaction volume within the Lightning Network has grown significantly over the past few years.
Other Catalysts
Coinbase sparked the bull market of 2013.
Ethereum provided fuel in 2017.
Microstrategy, Paul Tudor Jones, Tesla, Block, Mass Mutual, and others ignited the market in the previous cycle.
What about 2024/2025?
Approval of a BlackRock ETF will be a good start.
BlackRock has an impeccable reputation, with only one of its 500+ ETF applications failing.
In some ways, having the BlackRock name associated with an ETF is more important than a Bitcoin spot ETF itself.
BlackRock’s name matters to RIAs, it matters to asset managers, and it matters to almost every investor on earth.
In the past, representing client investments in Bitcoin may have put fund managers at professional risk. A BlackRock ETF could completely reverse this situation.
Some thought-provoking questions: What would happen if the bigger risk is not allocating 1% of Bitcoin using trusted tools such as a BlackRock spot ETF?
Price Behavior in the Cycle and Predicting the Next Cycle
5 Points:
Timing the Market: The best time to buy Bitcoin is when everyone thinks it’s dead. We have two opportunities in 2022. We reminded readers in December that Bitcoin was bottoming. Secondly, what’s the second-best time to buy Bitcoin? Historically, it’s been during any pullback before the halving. Of course, timing the market is really hard. Dollar-cost averaging works well for assets like Bitcoin that are in the early stages of global adoption. Even those who bought at the top of the previous cycle have done well over the long term. Bitcoin is down 55% from its historical high, but its 10-year, 7-year, 5-year, and 3-year compound annual growth rates are 84%, 73%, 36%, and 49%, respectively. The key is to have a long-term belief. Know exactly what you’re buying and ignore the noise.
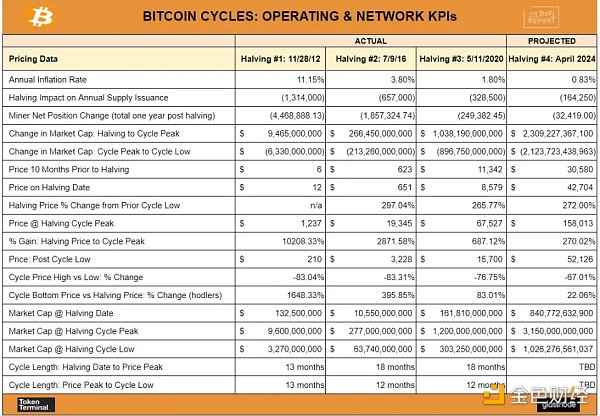
Prediction: Based on the previous 3 cycles, we predict that the return rate will continue to decline. The target price of Bitcoin for this round is $158,000.
Higher level framework: We predict that the peak market value of Bitcoin in the next cycle will reach $3.15 trillion (the previous cycle was $1.2 trillion). This will make Bitcoin’s market value 25% of gold. Long-time readers know that we ultimately believe that Bitcoin will reach and surpass the gold market (currently valued at $12.6 trillion).
Overall, we believe that the total market value of cryptocurrencies in the next cycle may soar to $8-10 trillion (the previous cycle was $3 trillion). There may be interesting opportunities in Ethereum, competitive L1, and important infrastructure areas.
Low point after the cycle: We expect Bitcoin’s volatility to continue in the coming years. Having said that, we expect volatility to decrease over time. The growth of the market, the entry of more mature investors into the field, mature market structure and products, new regulations, and less “Wild West” leverage will all promote this result. Please note that Bitcoin is like a commodity-its price far exceeds its production cost in a bull market, and then falls to (sometimes below) its production cost in a bear market.
About the explanation of the previous cycle: We believe that due to China’s mining ban, this cycle did not perform as well as it should have. If you remember, at that time, the price of Bitcoin had just set a new historical high, Tesla had just purchased Bitcoin for its balance sheet, and Michael Saylor had purchased billions of dollars worth of Bitcoin through Microstrategy and media tours. We believe that if there were no mining bans in China, Bitcoin might break through $100,000. As miners are concentrated in mainland China (abundant cheap hydropower), the ban eventually led to miners being forced to sell and surrender.
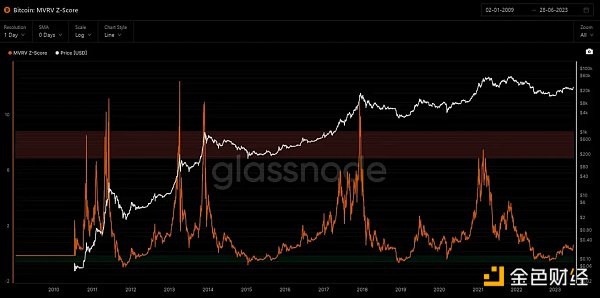
KPI in the middle of the cycle
Narrow the scope and understand where we are today compared to previous cycles.
Market value / realized value:
We will continue to update Blocking; if you have any questions or suggestions, please contact us!
Was this article helpful?
93 out of 132 found this helpful
Related articles
- Has Inverse Finance successfully transitioned from CDP lending products to fixed-rate lending markets?
- “Fortune” interview with Sister Wood: Will ARK win the first Bitcoin spot ETF?
- Lightning Labs launches AI Bitcoin tool that enables sending Bitcoin on the Lightning Network
- What is Bitcoin Recursive Mnemonic?
- How is the market searching for logic in the old-school DeFi as COMP and MKR continue to rise in recent days?
- In the first half of the year, it lagged behind BTC. What kind of “danger” and “opportunity” will ETH face in the second half of the year?
- Foresight Ventures: The Best Attempt at a Decentralized AI Marketplace


