Dry goods | Three technical analysis methods to play the Bitcoin market cycle
Source: OKEx
Compilation: First Class (First.VIP)
This article will share three technical analysis methods, analyze the BTC market cycle, and finally find the answer: Is it the best time to enter the market?
- Will the date of CME's launch of Bitcoin options be the end of altcoins?
- Analysis of Singapore's Payment Services Act: What is the difference between the regulatory policies imposed on different types of digital currencies
- EOSIO 2.0 is officially released, solving the biggest bottleneck of blockchain development, making EOS "faster, easier and more secure"
(First class note: BTC "halving" is a consensus, but when is the best time to buy it? As we all know, in the stock market, professional investors often use fundamental analysis and technology to make investment decisions. Analysis. It turns out that in a "less effective" capital market, both types of analysis have certain reference value. In a market like cryptocurrencies, investors are not completely rational and investors' valuation of assets exists. Irreparable deviations, asset prices do not fully reflect the available information, and are not an "effective market" at all, so the technical analysis method of analyzing historical data can highlight its role.)

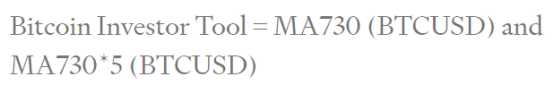
The current market expectation that "Bitcoin will bring a round of bull market" is mainly based on the previous two experiences. From the figure below, we can see that Bitcoin has been halved twice. After 367 days of the first halving, the BTC's historical high (ATH) was broken and the market price surged 9260%. 526 days after the second halving, the new ATH was reached and the BTC price increased by 2976%.
Therefore, although compared with the previous two halving cycles, Bitcoin's increased market value and the emergence of derivatives market prosperity have weakened Bitcoin's volatility, many people still believe that the third halving will definitely Increase the price of Bitcoin by more than 10 times.

Figure 1: Historical fluctuations in Bitcoin prices
This article will use the moving average (MA), the Atman model (Z-score), and the Reserve Risk Model (Reserve Risk Model) to work with the reader to find out if there is an optimal time to buy Bitcoin.
Moving average method (MA)
The moving average (MA) is an average of the Bitcoin price trend. This model is more inclined to believe that historical prices have a stronger influence on future trends. MA often has short-term, medium-term, and long-term indicators, which are 5 days / 10 days, 30 days / 60 days, and 120 days / 240 days, respectively. This article will use the two-year Bitcoin MA and MA * 5 (MA730 and MA730 * 5) indicators as an analysis tool. The conclusion to be drawn is mainly: in which periods can Bitcoin be bought and sold with greater profit.
The figure below shows that when the price drops below the MA730 moving average (green line) , buying bitcoin will generate excess returns (that is, the best time to buy) ; when the price exceeds the MA730 * 5 moving average (red line) , it means short selling bitcoin There will be excess returns (ie, the best time to sell) . As Bitcoin is halved, it will bring obvious market cycle fluctuations: price surges, corrections, and sideways (overexcitation of market participants and excessive contraction of prices lead to offsetting results). As can be seen from Figure 2, the first and second green areas occurred about one and a half years before the halving. The same applies.It is also a green area between December 2018 and April 2019, and it may be the best time to buy bitcoin and enjoy the third half of the excess income.

Figure 2: Analysis of BTC using MA and MA * 5 indicators for two years
Atman model (Z-score)
The Atman model (also known as Z-Score) more accurately points to the apex of market prices. This indicator is more inclined to discover the fair value of Bitcoin through C2C transactions. Calculated as follows:

In the above formula, the market cap (Market Cap) is the current bitcoin price multiplied by the number of bitcoins in circulation; the fair value (Realized Cap) refers to the last price of each bitcoin (that is, the last time it was sent from a wallet) To another wallet), and then it adds up all these individual prices, takes the average, and multiplies this average price by the total number of Bitcoins in circulation.
Fair value usually represents the price of a large OTC transaction. According to BTC.com data, as of January 3, 2020, 0.000349% of the top addresses held 15.14% of Bitcoin. The Bitcoin market is still a highly concentrated market. To a certain extent, larger OTC prices can better represent the fair price of Bitcoin.
Z-Score is calculated as the difference between the market value and the fair value, divided by the standard deviation of the two (ie the denominator in the above formula). Z-Score can be used to identify periods when Bitcoin is too high or too low relative to its "fair value" . It can be seen from Figure 3 that when the market value of Bitcoin is abnormal and higher than the fair value, Z-Score will enter the red area , indicating that it has reached the top of the current market cycle . Conversely, when the fair value is abnormally higher than the market value, the z-score enters the green zone , indicating that the current market cycle has bottomed . Currently, a new green area is being formed.

Figure 3: Z-Score model analysis of BTC
Reserve Risk
The Reserve Risk model provides recommendations for buying / selling by measuring risk and return. The model's indicators tend to attribute the value of Bitcoin to long-term holders (HODL), where the main risk is From the destruction of Yuantian . Coin days = number of bitcoins * number of days in which an address is placed . Once this bitcoin is traded (transferred), coin days are destroyed .
For example, Alice buys 1 bitcoin and keeps it in the wallet for 7 days, and then sells it. When this bitcoin is transferred from Alice's wallet to the new buyer's wallet, it is destroyed for 7 currency days. The larger the value of Coin Tian destruction, it means that the number of long-term holders of Bitcoin in this period is decreasing, and the risk of holding Bitcoin is increasing.
The following figure shows the destruction of currency days with different holding periods. The lower holdings range from 1 to 7 days, and the higher holdings range from 3 to 5 years. Here, short-term holding represents demand and long-term holding represents supply. As can be seen from the figure, the price increase of each round of Bitcoin is stimulated by new demand for holding coins .
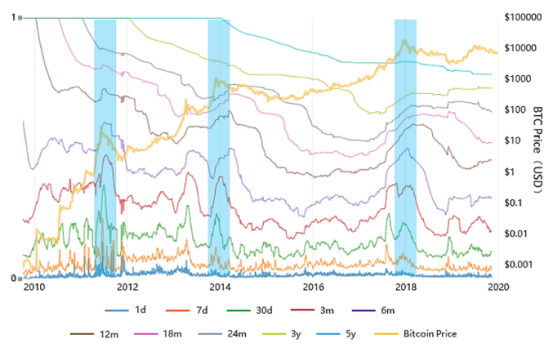
Figure 4: Peer-to-Peer Destruction of Holders of Different Durations
We converted the destruction data of Bintian into assets held at different periods, and the conversion results are shown in the following figure. It can more directly reflect that with each round of coin price growth, the number of coins stored also increases. Among them, the 1d data can be approximated as the daily on-chain transaction volume.

Figure 5: BTC market value of holders of different periods
Assets held in different periods are defined as HODL Bank. Holding risk is inversely proportional to HODL Bank and proportional to BTC price. In other words, the more BTC is stored (held), the lower the holding risk, and vice versa. The formula is as follows:

Figure 6 shows that each time the holding risk value enters the red area , it is the market peak . When it enters the green zone , it is a good time to buy BTC . Currently, the market in early January 2020 is in a green area.

Figure 6: Holding risk analysis
This article analyzes the current market cycle of bitcoin through three technical indicators: moving average (MA), Atman model (Z-score), and holding risk. Although the analysis shows that the current time (early January 2020) seems to be another entry opportunity, it is worth noting that the upward trend of Bitcoin price after halving has been extended every time . For investors seeking to maximize returns, it should be noted that this market cycle is not expected to end until 2022.
This article represents the original author's point of view. First.VIP always remains objective and neutral, presenting readers with diverse information for learning and communication, and does not constitute investment advice.
We will continue to update Blocking; if you have any questions or suggestions, please contact us!
Was this article helpful?
93 out of 132 found this helpful
Related articles
- 2020 Investor's Congress discussion: Market fluctuations, how to predict capital?
- IDC report: Blockchain + AI will be the world of Chinese enterprises?
- 10 indicators show why BTC is successful
- How to start a blockchain fairly or unfairly?
- NFT-the cornerstone of encrypted digital assets
- CPPCC member Jing Xiandong: Promote Zhejiang Digital Government Affairs Upgrade with Blockchain
- The main body of Bitmain's two official micro account registrations has been transferred, and some of the shares in Fujian Zhanhua have been frozen into the rights and interests of Baozhanke Group?