QKL123 market analysis | US stocks have melted for the fourth time this month, and Bitcoin is still converging (0319)
Summary: US stocks have melted for the fourth time this month, and Bitcoin has not been significantly dragged down. After the plunge and stabilization, the mainstream currencies have recently shown a trend of shrinking and converging, and the possibility of short-term changes is relatively high. Observe the differences between the assets, which brings greater uncertainty to the market trend.
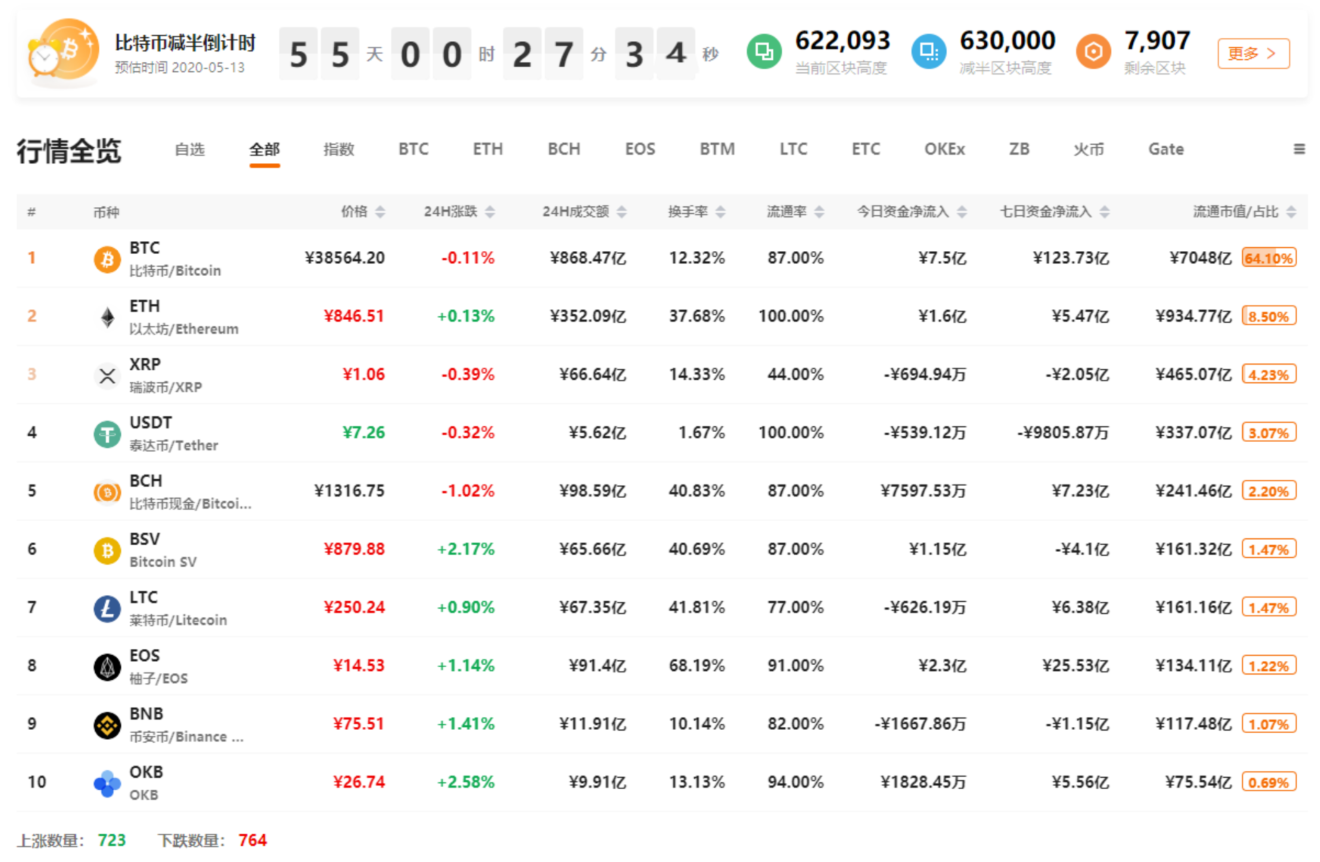
At 10:30 today, the 8BTCCI broad market index was reported at 7706.63 points, with a 24-hour rise or fall of + 1.27%, reflecting a rebound in the broad market; the total turnover was 8884.24 yuan, a 24-hour change of + 4.92%, and market activity increased. The Bitcoin strength index was reported at 93.98 points, with a 24-hour rise or fall of -0.50%. The relative performance of altcoins in the entire market has strengthened. The ChaiNext USDT OTC discount premium index was reported at 103.12. The 24-hour rise or fall was -0.22%, USDT. The OTC premium level has decreased.
Analyst perspective:
- Why do cryptography believe? Investigate the theory of computational difficulty behind
- World Economic Forum: Creating a Reputable and Trustworthy Digital Currency (Part 2)
- Viewpoint | Fully open Bitcoin ledger is a double-edged sword
Yesterday, the US stock market broke for the fourth time this month, and Bitcoin had a slight downward linkage. However, after the opening of U.S. stocks, bitcoin rebounded rapidly, and the altcoin rebounded faster, indicating that the crypto asset market began to try to get rid of the shackles of the global capital market.
But this is not the time to be optimistic, because US stocks are still in the downward phase. In particular, it is associated with the recent rare performance of U.S. stocks in the history and the second emergency rate cut by the Federal Reserve this month. Under the crisis, for the sake of conservativeness, don't say anything about risky assets such as US stocks, and Bitcoin will also be affected by liquidity again.
At the same time, there is no need to be too panic. From the MVRV and the currency storage indicators, it can be seen that the price of bitcoin has reached a low level in the large cycle, and the bottom detection stage may take some time. Crisis organic is a good time for investors to decentralize fixed investment.
First, the spot BTC market
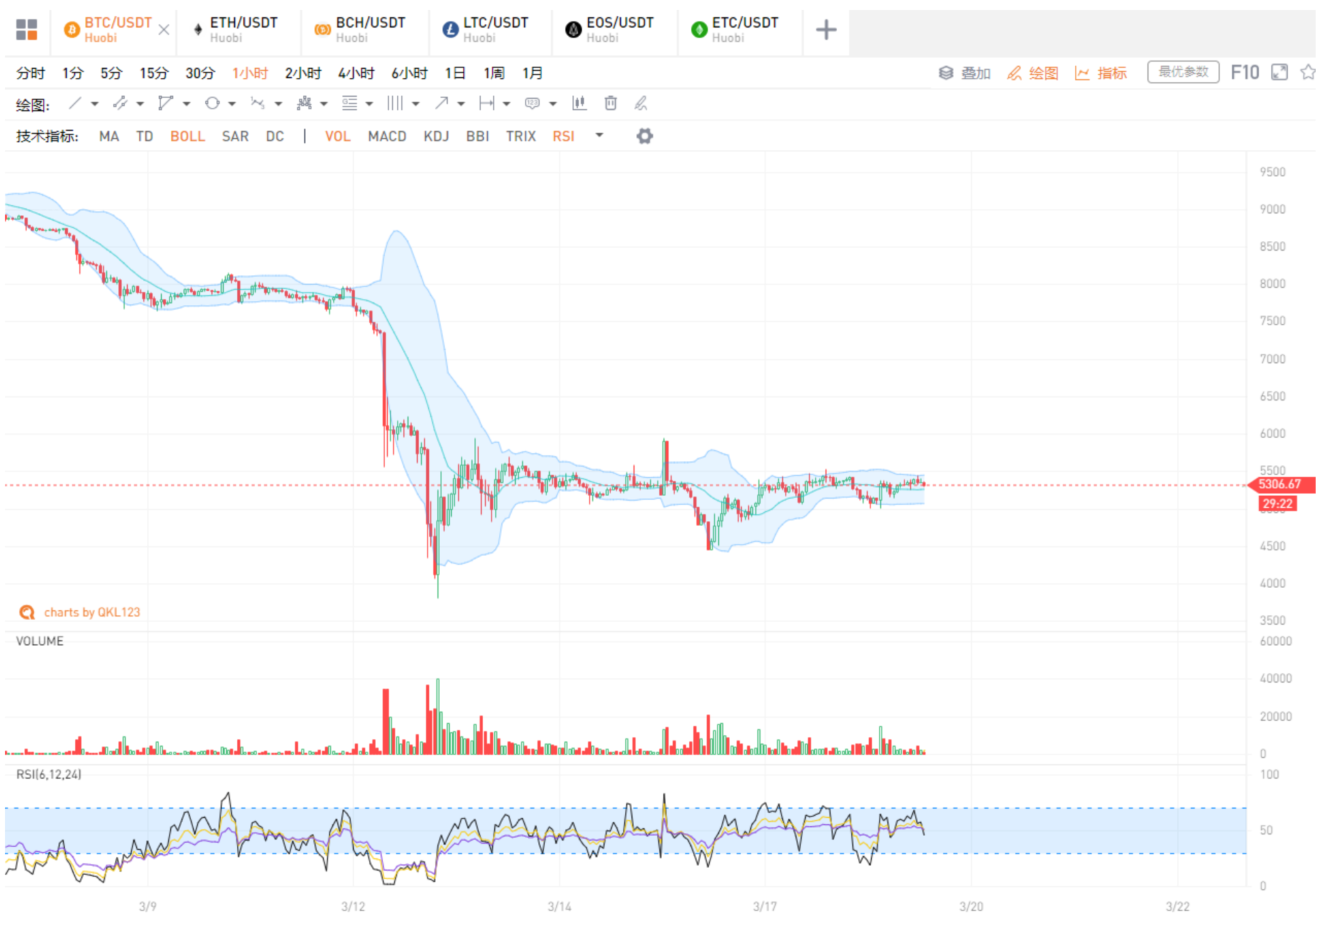
BTC fluctuated slightly yesterday and was not dragged down by the plunge of U.S. stocks. After hitting a minimum of $ 5,000, there was a clear slight increase in volume. Recently, there has been a trend of shrinking convergence, and the possibility of short-term changes is increasing, and the risks associated with it are greater.
Second, the spot ETH market
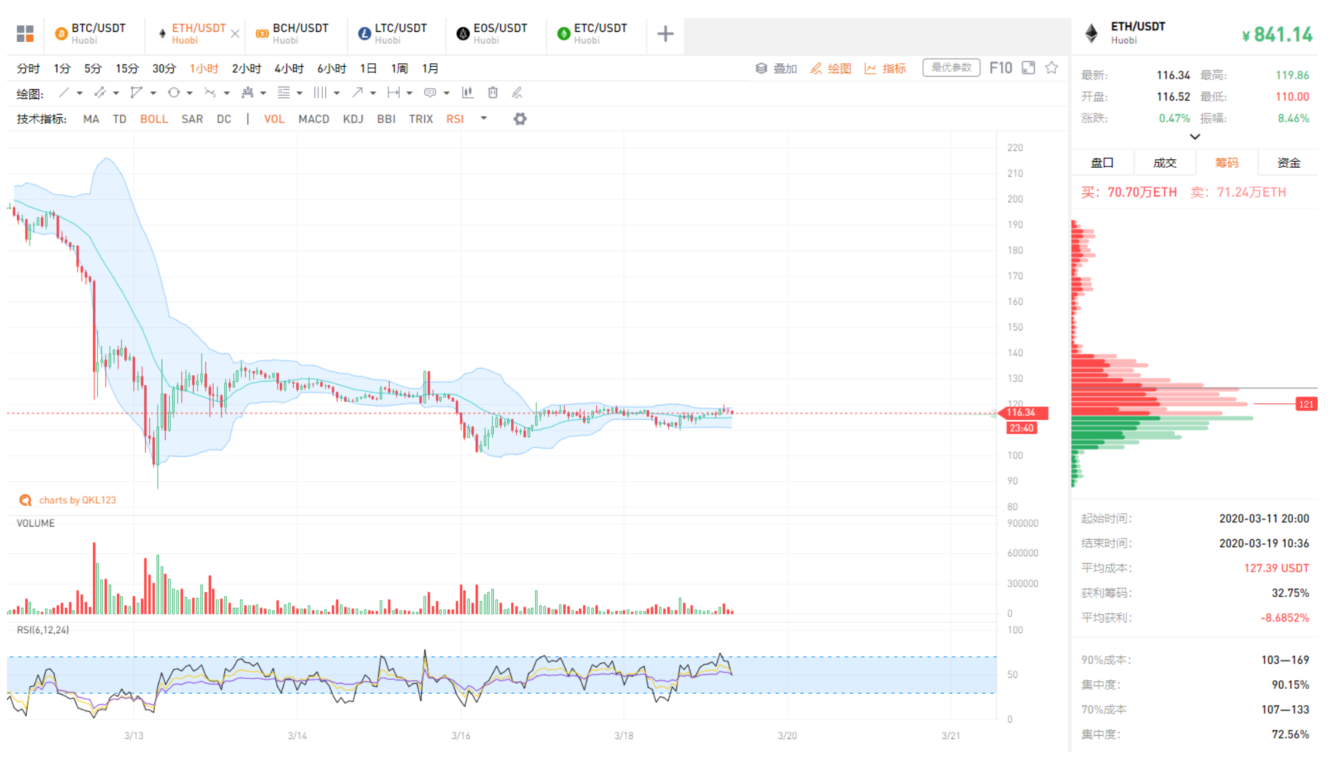
ETH touched a minimum of 110 US dollars yesterday, and then linked upwards, but did not stand firmly in the 120 US dollar chip concentration area. The overall trend was downward convergence, and the risk of a short-term change of the market is greater.
Third, the spot BCH market
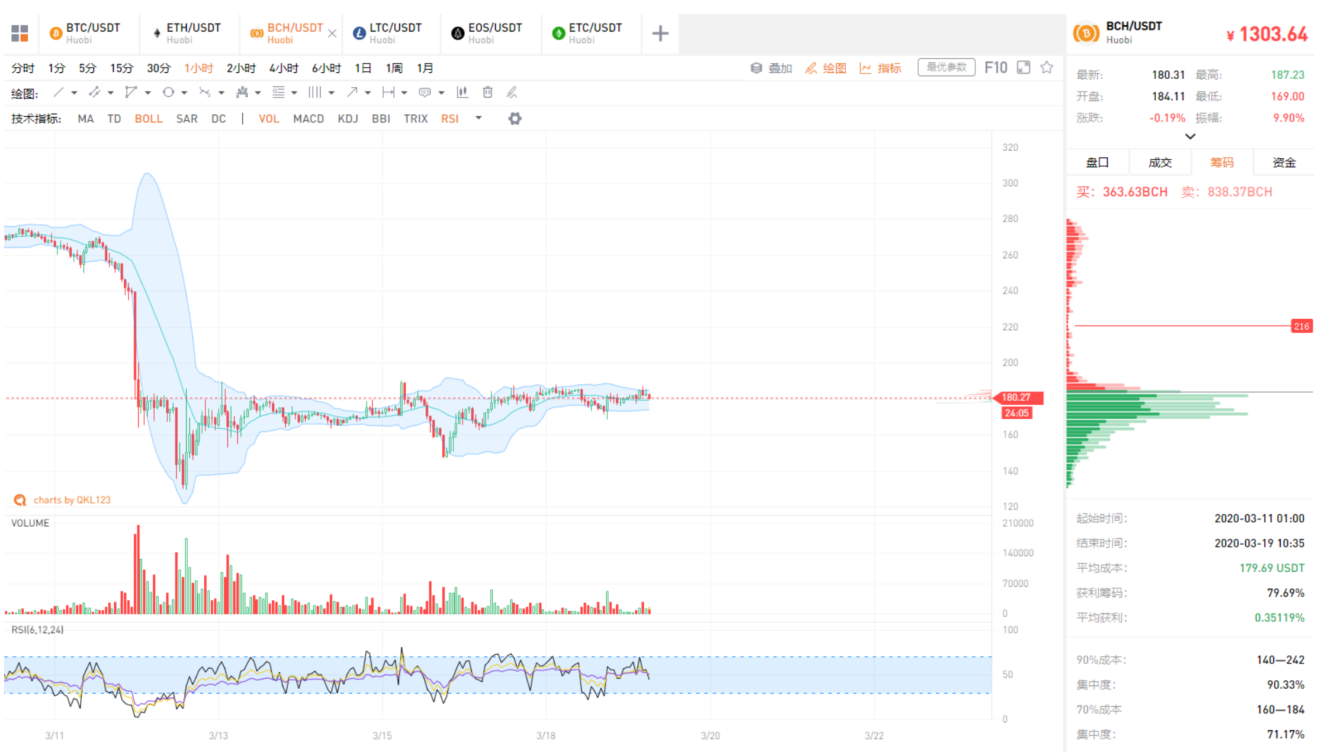
BCH has tended to converge in the near future, and the trend is stronger than ETH, which may be affected by the halving expectations in April. However, it also supports the existence of divergences between mainstream currencies in the market, which brings uncertainty to the short-term trend.
Fourth, the spot LTC market
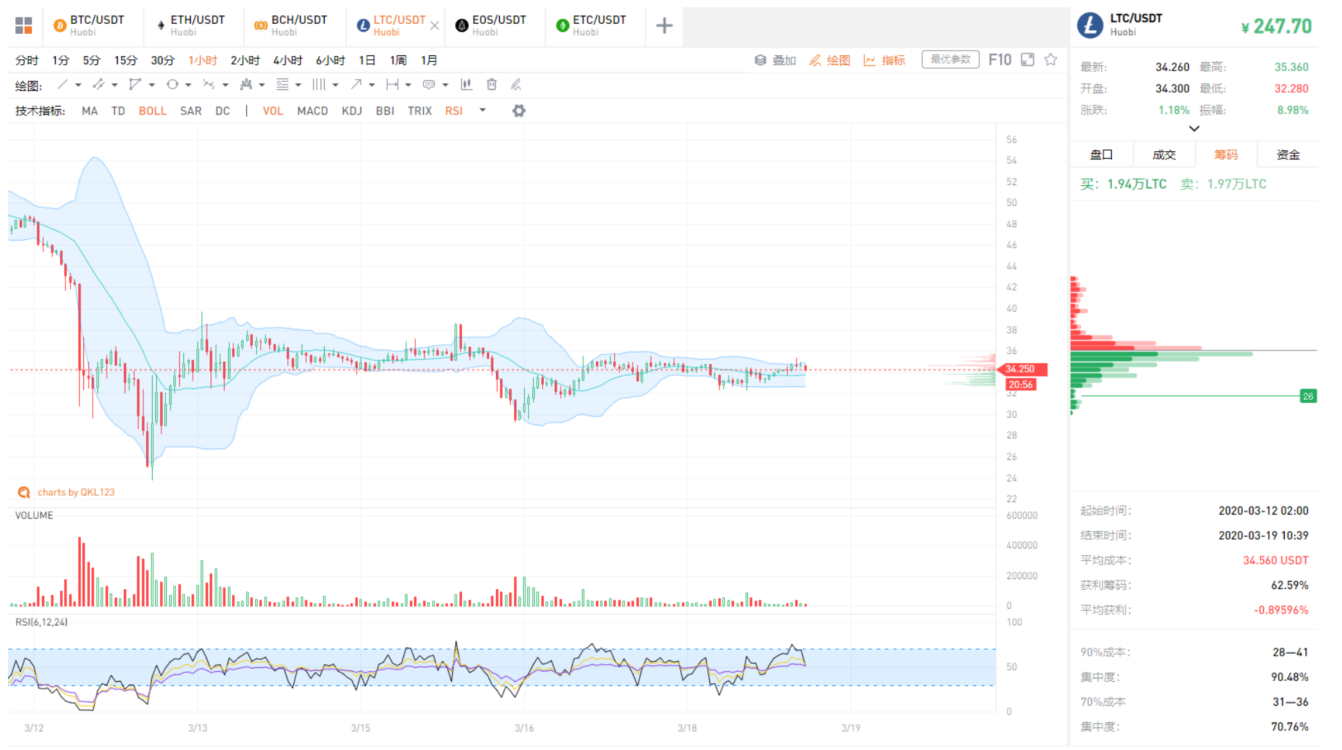
LTC tends to converge in the $ 34 chip concentration area, and it can move up and down. The trend is close to BTC, and the short-term uncertainty is large.
V. Spot EOS Quotes
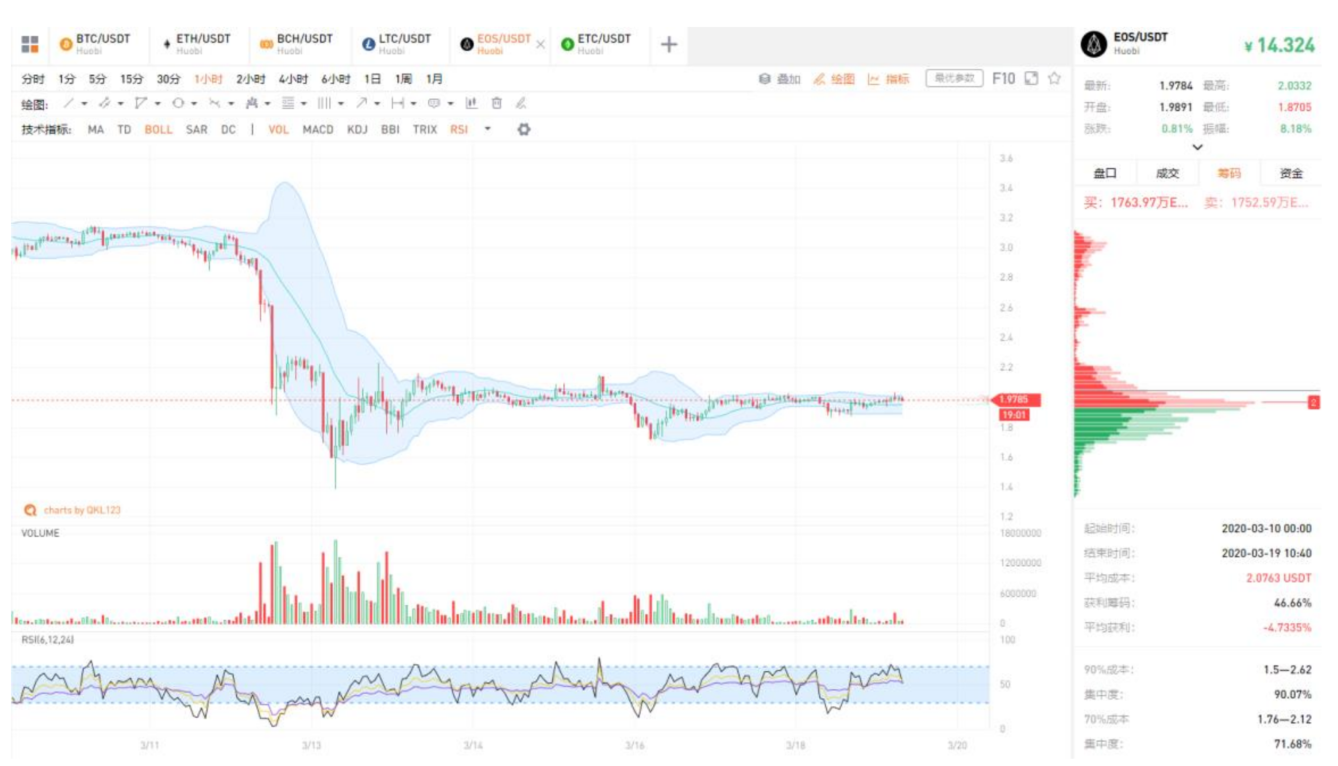
EOS hasn't settled in the concentrated area of 2 USD chips. The trend is similar to that of ETH. It is more likely that the short-term change will be downward, but it depends on the way of BTC.
Six, spot ETC market
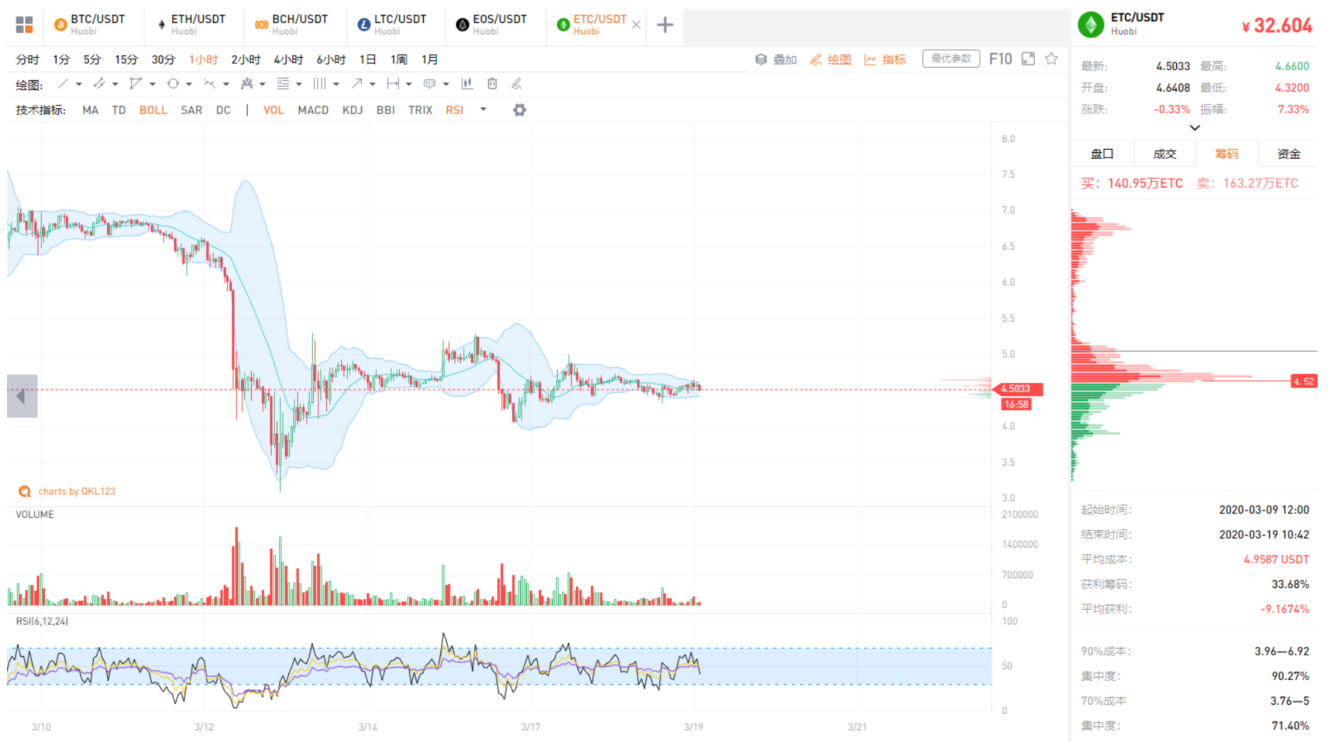
ETC did not stand above 4.6 US dollars today, and has recently converged after a wide range of shocks, with short-term linkages with BTC.
Analyst strategy
1. Long line (1-3 years)
Although the long-term trend of BTC is bad, but the price is not far from the bottom, it is a good time for Tun Coin to invest. You can refer to the coin storage indicator. The smart contract platform leader ETH, altcoin leader LTC, DPoS leader EOS, BTC fork currency leader BCH, and ETH fork currency leader ETC can be configured on dips.
2. Midline (January to March)
Affected by the financial environment, it is difficult for Bitcoin to get out of the bottom in a short period of time, and those with small positions intervene in batches.
3. Short-term (1-3 days)
Short-term changes may be possible, wait and see.
Appendix: Interpretation of Indicators
1. 8BTCCI broad market index
The 8BTCCI broad market index is composed of the most representative tokens with large scale and good liquidity in the existing global market of the blockchain to comprehensively reflect the price performance of the entire blockchain token market.
2.Bitcoin Strength Index
The Bitcoin Strength Index (BTCX) reflects the exchange rate of Bitcoin in the entire Token market, and then reflects the strength of Bitcoin in the market. The larger the BTCX index, the stronger the performance of Bitcoin in the Token market.
3.Alternative mood index
The Fear & Greed Index reflects changes in market sentiment. 0 means "extremely fearful" and 100 means "extremely greedy." The components of this indicator include: volatility (25%), transaction volume (25%), social media (15%), online questionnaire (15%), market share (10%), and trend (10%).
4.USDT OTC Premium Index
The ChaiNext USDT OTC INDEX index is obtained by dividing the USDT / CNY OTC price by the offshore RMB exchange rate and multiplying by 100. When the index is 100, it means the USDT parity, when the index is greater than 100, it means the USDT premium, and when it is less than 100, it means the USDT discount.
5.Net Funds Inflow (Out)
This indicator reflects the inflow and outflow of funds in the secondary market. By calculating the difference between the inflow and outflow of funds from global trading platforms (excluding false transactions), a positive value indicates a net inflow of funds, and a negative value indicates a net outflow of funds. Among them, the turnover is counted as inflow capital when rising, and the turnover is counted as outflow capital when falling.
6.BTC-coin hoarding indicator
The coin hoarding indicator was created by Weibo user ahr999 to assist bitcoin scheduled investment users to make investment decisions in conjunction with the opportunity selection strategy. This indicator consists of the product of two parts. The former is the ratio of Bitcoin price to the 200-day fixed investment cost of Bitcoin; the latter is the ratio of Bitcoin price to Bitcoin fitting price. In general, when the indicator is less than 0.45, it is more suitable to increase the investment amount (bottom-sweeping), and the time interval accounts for about 21%; when the indicator is between 0.45 and 1.2, the fixed investment strategy is suitable, and the time interval accounts for about 39. %.
Note: Crypto assets are high-risk assets. This article is for decision-making reference only and does not constitute investment advice.
We will continue to update Blocking; if you have any questions or suggestions, please contact us!
Was this article helpful?
93 out of 132 found this helpful
Related articles
- QKL123 market analysis | Bitcoin miner fled, miner's crazy indicators need to be reversed (0318)
- This platform is a bit stable: I have two or three things with Bybit
- Viewpoint | Blockchain is the source of power for the Fourth Industrial Revolution, empowering the Industrial Internet to build a new space for the digital economy
- Fidelity-invested crypto company Fireblocks officially integrates Compound, allowing institutional customers to earn DeFi interest
- Bitcoin's transaction price has fallen below the average mining cost
- Market Ineffectiveness Value Catcher: How Can the Crypto Asset Market Arbitrage?
- Behara Chain Foundation became a member of the IEEE Computer Association Blockchain and Distributed Accounting Committee, and led the proposal for a new standard for the IEEE Blockchain


