Review of the state of the blockchain network in 2019: BTC and ETH are far ahead
Original author: Coin Metrics
Translator: Barley
Source: Satoshi Shinmoto
CoinMetrics released a review of the state of the blockchain network in 2019. In this special edition of the network state, it reviewed the mainstream crypto assets (Top 18) in 2019 (calculation cycle: January 1, 2019 to December 30, 2019). Performance in each category: asset performance, use cases & adoption, economics, security & health. Let's find out.
- Read a history of finance and regulation, as well as a lesson for DeFi
- Eight currencies that are about to halve in 2020
- "2019 Blockchain Panoramic Scan": Global Policy
Asset performance
- Price performance
Although the prices of most mainstream assets were sluggish at the end of the year, they actually increased significantly compared to last year.
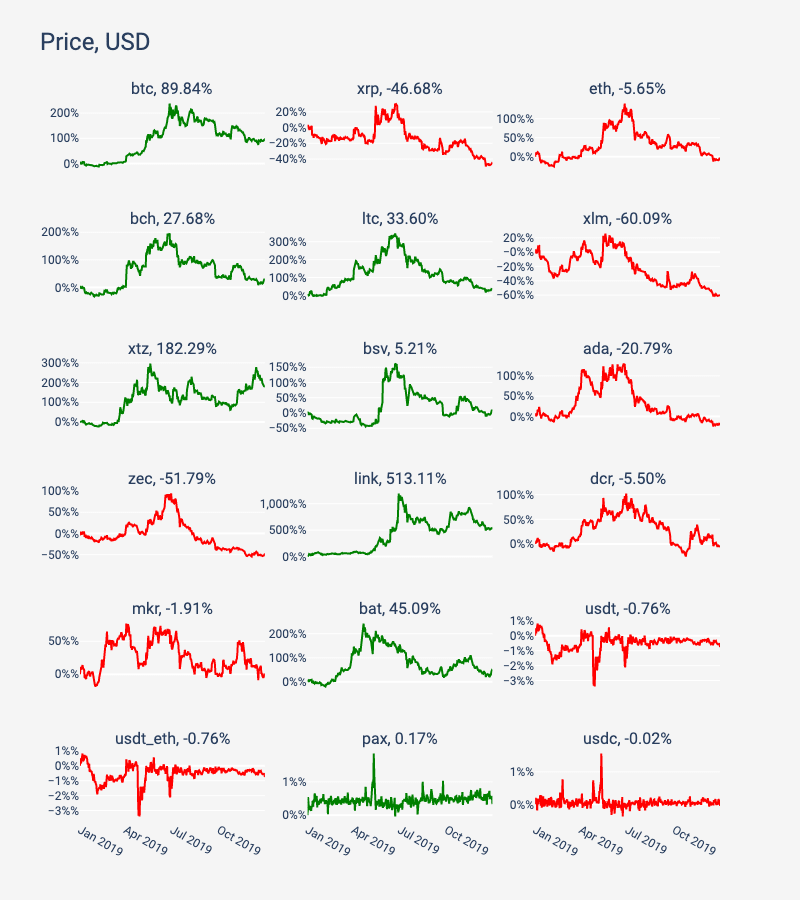
BTC is up 90% for the year, while ETH is down 6%. After Coinbase launched Tezos (XTZ), Coinbase Pro and Binance supported XTZ's staking mortgage, XTZ's efforts in the second half ended the year with an amazing result of 182%.
A few assets with a medium market value also performed strongly, including Chainlink (LINK) rising 513%, Basic Attention Token (BAT) rising 45%. In contrast, XRP, Stellar (XLM) and Zcash (ZEC) all ended in decline, with declines of 47%, 60% and 52%, respectively.
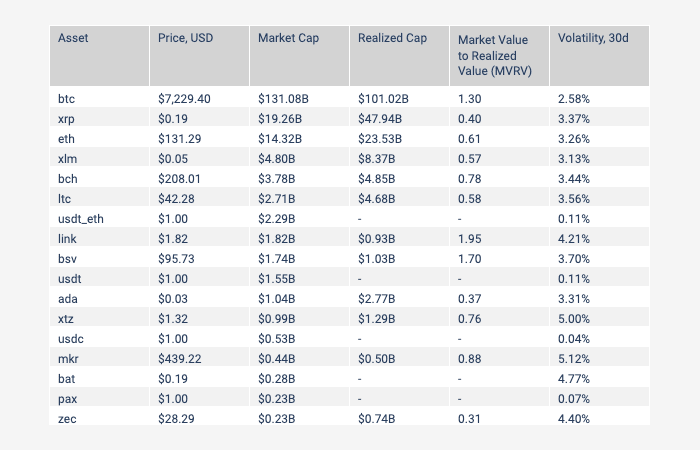
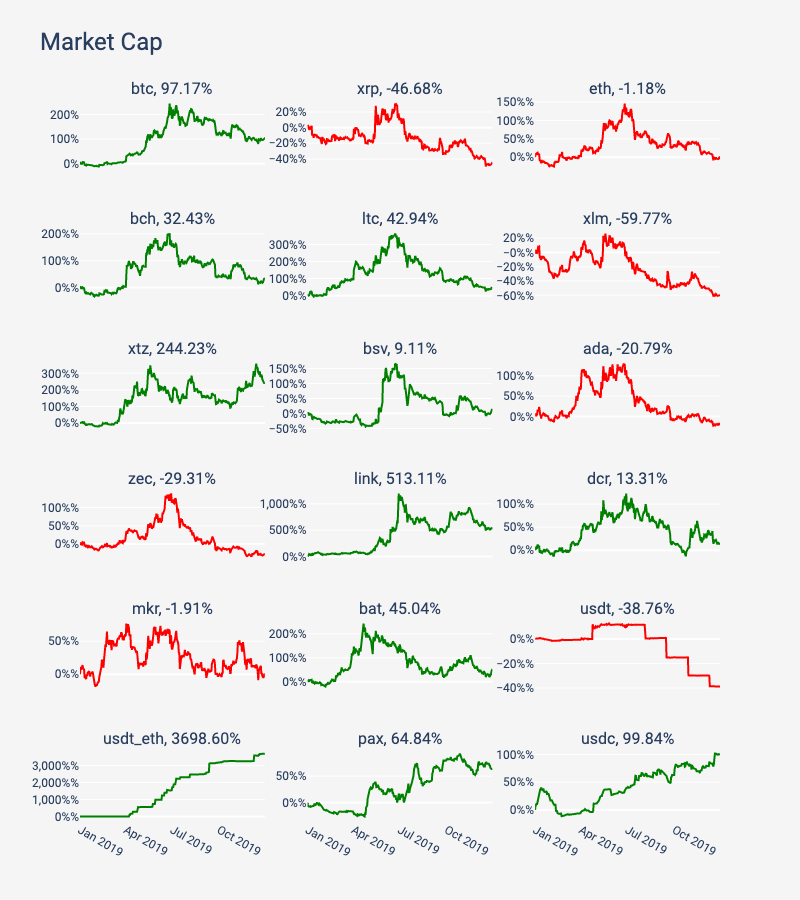
- Market value
The market value is obtained by multiplying the current total supply by the current market price. In most cases, the change in annual market value is closely related to the price change. The only exception is the stablecoin. 2019 is an important year for Tether on Ethereum, and the market value of USDT_ETH will quickly surpass USDT_Omni in 2019.
In the past year, the market value of USDT_ETH has increased by nearly 37 times, with a market value of nearly $ 2.3 billion, while the market value of USDT_Omni has dropped by nearly 39% to $ 1.6 billion, and the other two stablecoins, PAX and USDC, have increased by 65% and 100, respectively. %.
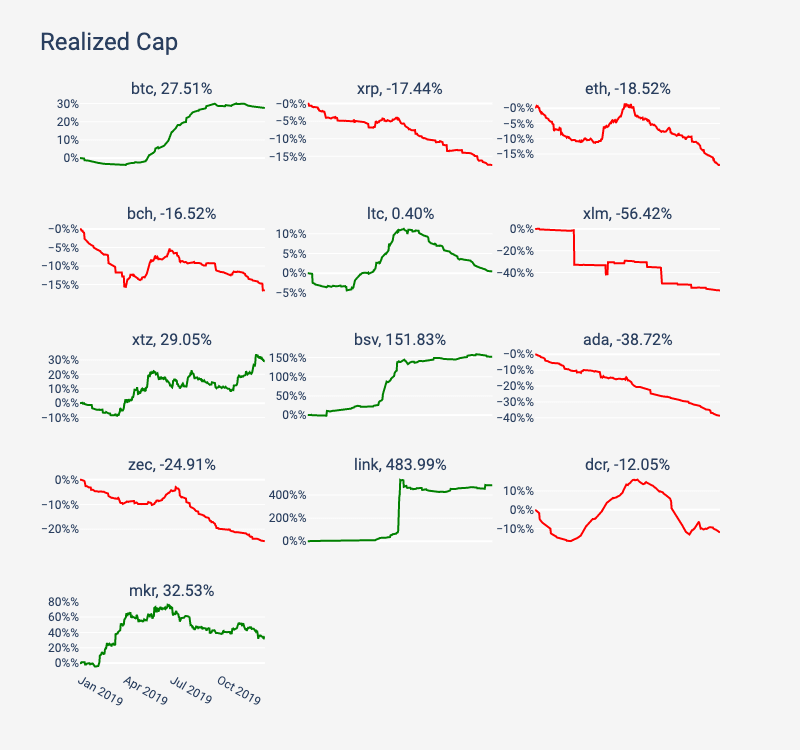
- Realized market cap
Unlike market value, realized market value refers to the value of the asset when it was last moved on the chain (that is, between two different addresses). If the price of an asset when it was last moved in 2017 was $ 2,500, the price of the asset would be $ 2,500, not the current market price. This particular pricing method is used to determine the total price of all quantities of a single asset. Call it realized market value. Realized market value can be used as a measure of the average cost of all asset holders.
Note: For founders holding a large amount of assets provided by the Ministry of Finance (such as XRP), the interpretation of realized market value should be more cautious. If the founders make large moves when the price is significantly different from the current price, then the Causes large fluctuations in realized market value. CoinMetrics is currently unable to calculate the realized market value of all assets in the current period.
BTC's realized market value has increased by nearly 28% in 2019. But the realized market value of ETH has dropped by 19%. The difference between the current market value and the realized market value can be explained as the difference between market expectations and investor behavior. In the case of BTC, its market value has increased by 97%, while the realized value has increased by only 28%, and the price increase has exceeded the average cost basis, which indicates that most investors choose to hold their tokens instead of cashing in profits.
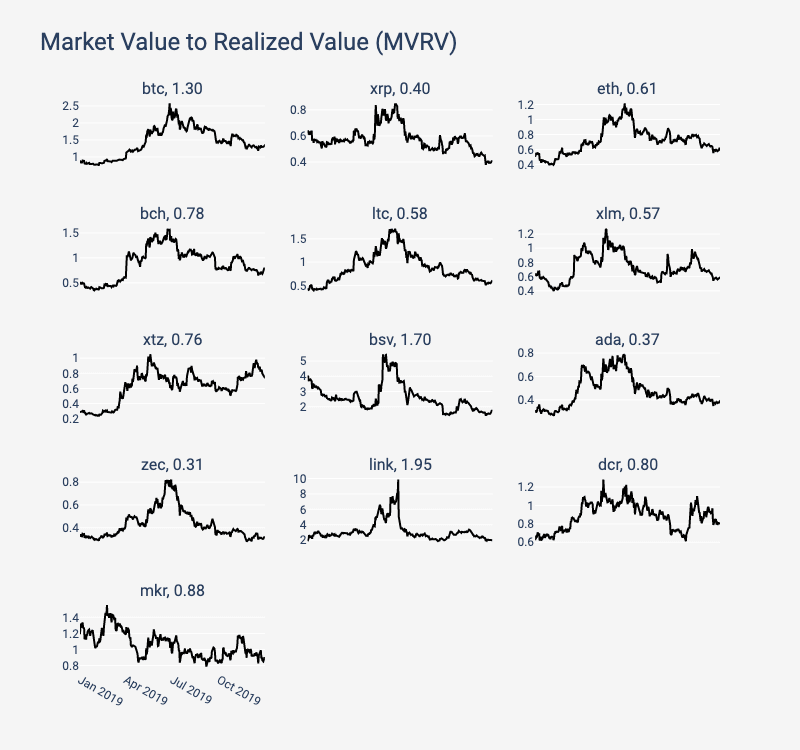
- Current Market Value / Realized Market Value (MVRV)
MVRV is calculated by dividing the current market value by the realized market value. A low MVRV is a potential signal that indicates that the profit of market participants is low. If the MVRV is negative, it indicates that the participant is not profitable. A higher MVRV indicates a good profit for asset holders.
Throughout 2019, BTC's MVRV increased to 1.33, indicating that BTC holders have continued to increase their profits since the beginning of 2019 and remain profitable by the end of the year. On the other hand, the moderate growth of ETH MVRV, which indicates that the profit of ETH holders is also increasing, but closed at 0.61, indicating that the holders' earnings were not good at the end of the year. BSV MVRV fell sharply after mid-2019, indicating that the value of assets held by BSV is getting lower and lower, but it still closed at 1.70, making a lot of profit.
Please note that higher MVRV values do not necessarily indicate future price increases. In fact, the situation may be just the opposite. As holders become more profitable, they are more likely to sell.
Use cases & adoption
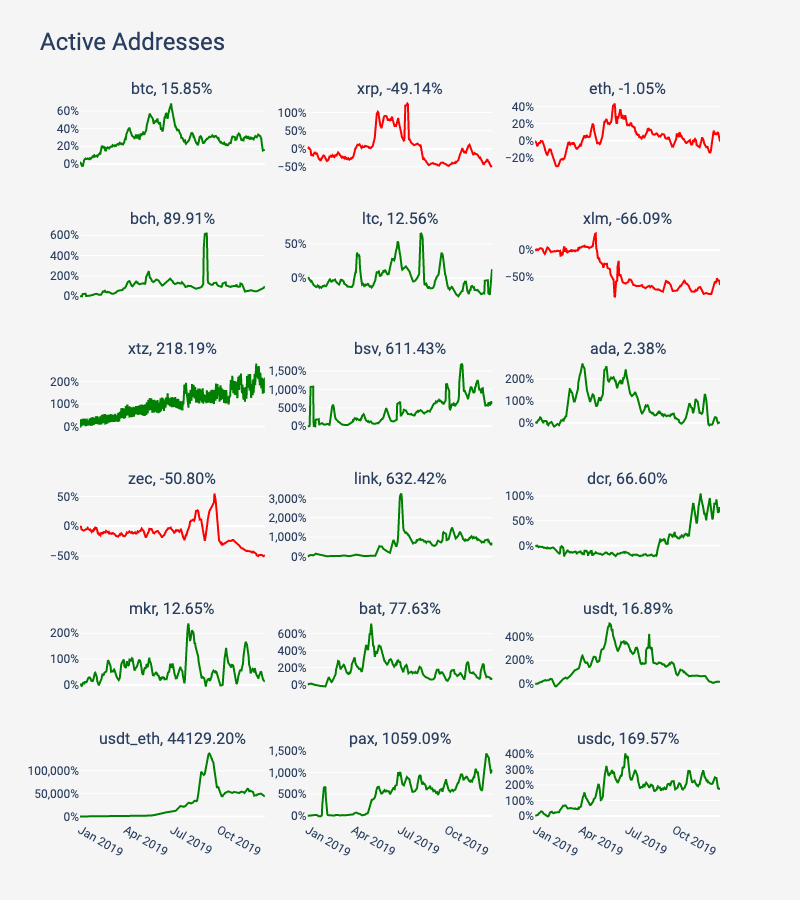
- Active address
Viewing the number of active addresses is a way to measure the number of potential blockchain users. It is defined as "the number of active single addresses in network activities of the day", whether as a receiver or initiator of changes to the distributed ledger, including transactions Or other actions).
An active address can be seen as a reflection of the daily active users of the public chain, but an active address is not necessarily equal to an active user. A single user can create and operate any number of addresses. In other words, the active address represents the maximum value of potential blockchain users. In fact, the daily number of users will be lower.
The active addresses of most mainstream assets have been increasing since 2019, which is a positive sign of the adoption of the overall crypto market. USDT_ETH, LINK and XTZ achieved the largest growth in 2019, while XRP, XLM and ZEC decreased their activity during the year, of which XLM dropped 66%. Note that the XTZ active address line line looks thicker than other assets because XTZ pays dividends on a regular basis.
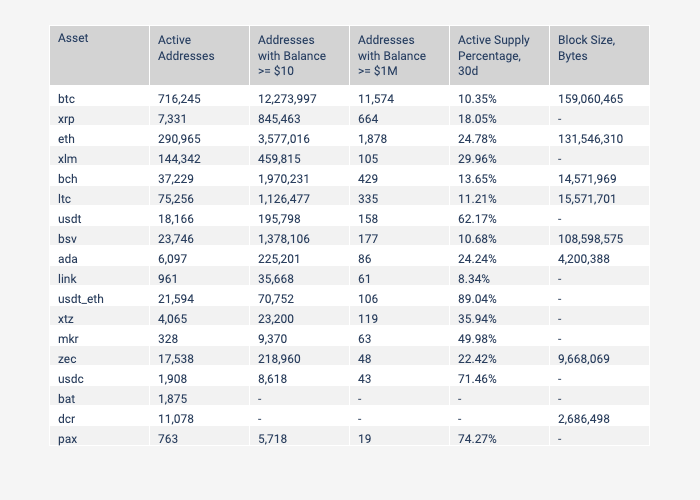
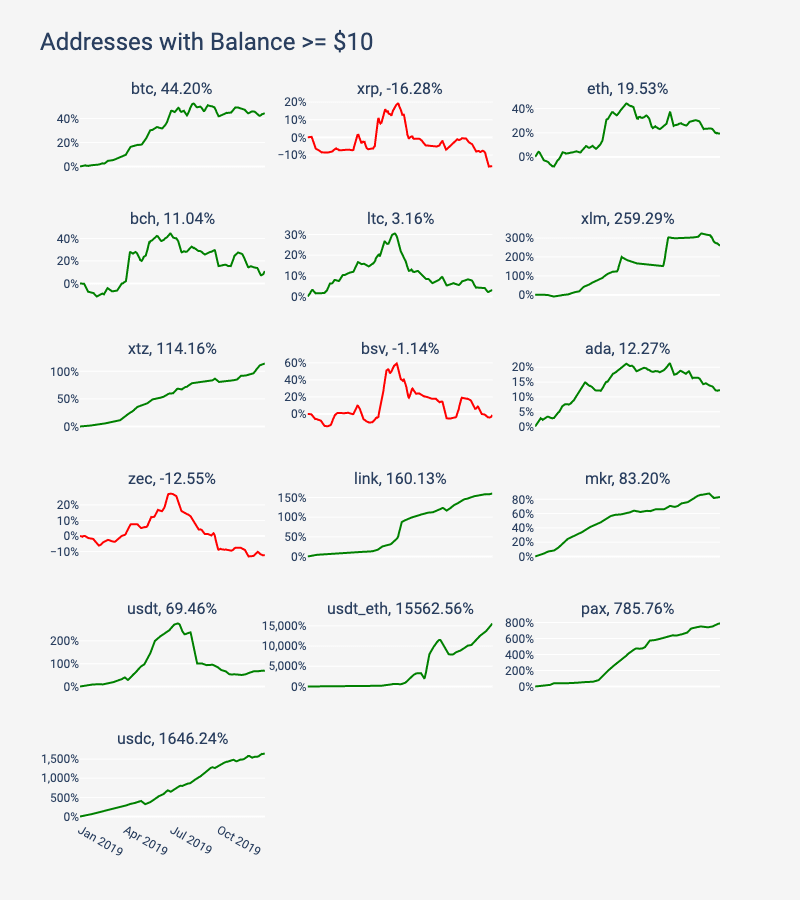
- Number of addresses over $ 10
The number of addresses with a balance of more than $ 10 can be used as an approximation of the total number of ordinary users. $ 10 is a somewhat arbitrary number, but the balance is small enough to be considered an ordinary person of a non-institutional investor, and large enough not to be absent (less than the transfer fee).
Similarly, the same warnings as for active addresses apply here: an address does not necessarily mean a user, so it should be considered the maximum number of owners. The value will include the contract address or the storage address of various exchanges (many of them).
Similar to active addresses, the number of addresses with most mainstream asset balances above $ 10 in 2019 also increased, which is another positive sign that encryption has been adopted since then. All stablecoins in our sample have increased significantly. Among non-stablecoin assets, the amplitude of XTZ and LINK exceeds 100%. Only BSV, XRP and ZEC decreased. BSV is particularly strange because its number of active addresses has increased by more than 600%.
Compared to all other major crypto assets, BTC and ETH have more addresses with a balance of more than $ 10. ETH is almost twice that of other assets (except BTC), and BTC is almost four times that of ETH.
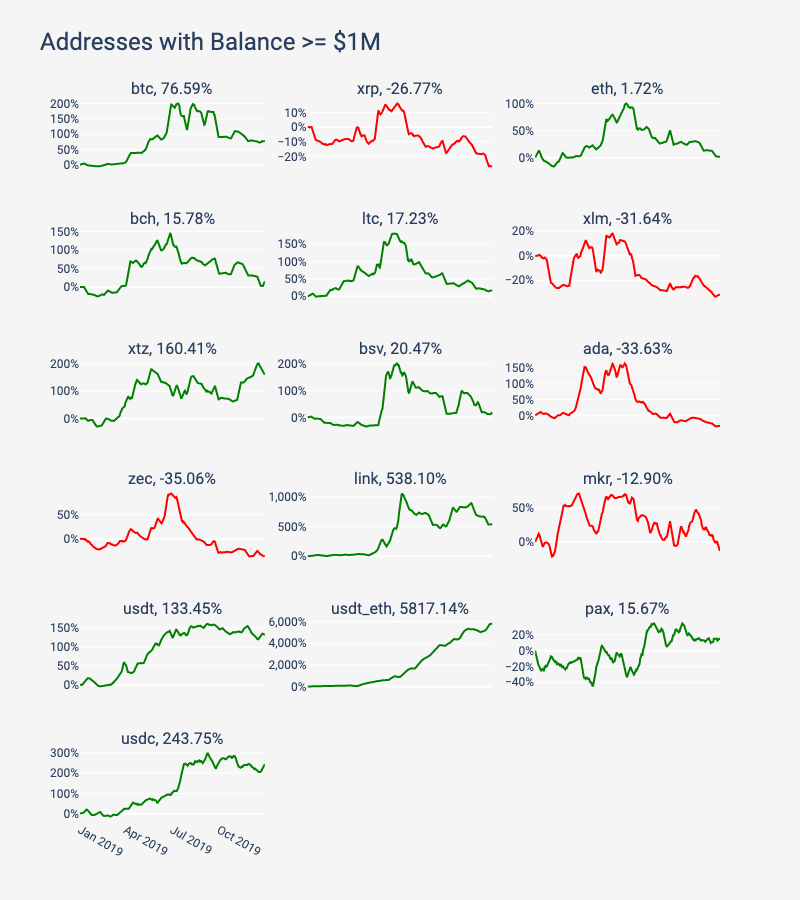
- Number of addresses with a balance of more than $ 1 million
The number of addresses with a balance of more than US $ 1 million can be regarded as an approximation of the total number of institutional investors (including exchanges, custodians, foundations, etc.).
BTC's number of institutional investors is far ahead of all other assets (remember, its market value is also far ahead). On average, BTC has more than 11,000 addresses with a balance of more than $ 1 million, and ETH has more than 1,800 addresses. No other asset has more than 700 addresses with a balance of more than $ 1 million. In terms of growth, LINK and USDT_ETH increased by 538% and 5817%, respectively.
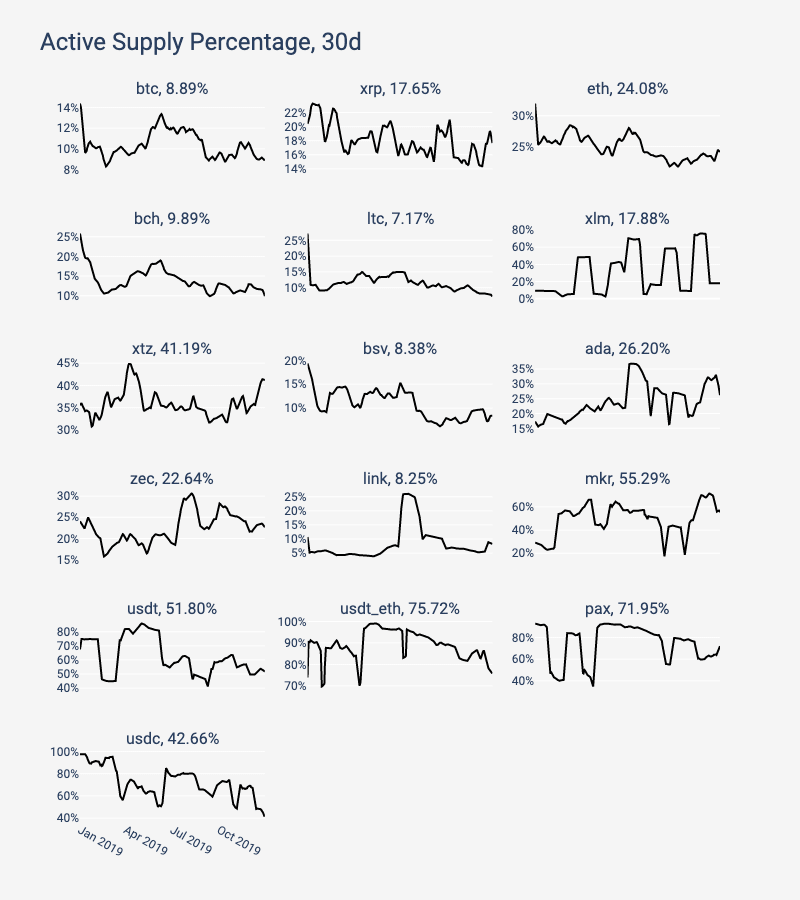
- 30-day active supply percentage
The 30-day active supply percentage indicates the percentage of the amount of money transferred (visible on the chain) and the total supply at least once in the past 30 days. Assets transferred more than once are counted only once.
A decline in the percentage of active supply may mean that an asset is increasingly being used as a store of value, while an increase may mean that an asset is increasingly being used as a medium of exchange. However, these are only a side manifestation. If the use of assets generally declines, so will active supply. There are also other factors that may affect active supply, such as the transfer of funds from the exchange or foundation's Treasury Department between cold wallets, which may cause large changes in the value.
Among mainstream assets, the percentage of BTC's active supply in the past 30 days has dropped from 14% to 9%, and ETH has dropped from 32% to 24%. In contrast, the active supply of stablecoins has increased significantly, ranging from 50 to 75%, suggesting that they are being used as a medium of exchange as expected.
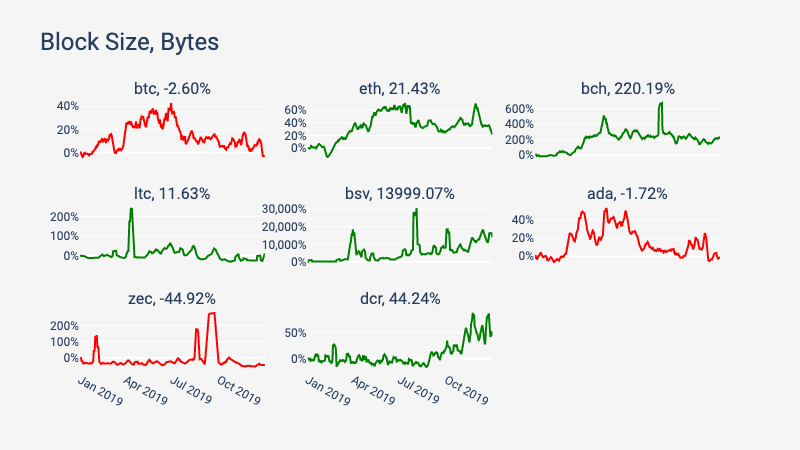
- Block size
The block size (block capacity) is used to measure the sum of the size of the transaction information added to the blockchain on that day (in bytes). This standard can only be used to measure public blockchains, so it does not apply to ERC-20 tokens or tokens built on other public chains.
The increase in block size indicates that the blockchain as a whole may have higher usage (as the number of transactions increases, the demand for block capacity increases), or "more expensive" transactions (such as occupying more blocks) Space for complex contract transactions) usage is increasing. However, the increased block size may also be caused by a small number of users sending spam on the chain (especially on low-cost transaction blockchains). Therefore, it is necessary to study the increase in block size on a case-by-case basis and consider other contextual clues. ,this point is very important. It should also be noted that if the blocks of blockchains like Bitcoin and Ethereum are already full, there is almost no additional room for increase unless the block capacity is expanded.
In our sample, the block size of most blockchains has increased, which means that as the demand for block space increases, the blockchain becomes more and more full. It is worth noting that the BSV block size has increased significantly, nearly 14,000%, which may be because BSV is heavily used for data storage rather than currency transactions. The block sizes of BTC, ZEC and ADA have all effectively decreased, and the maximum decrease of ZEC is nearly 45%.
economic status
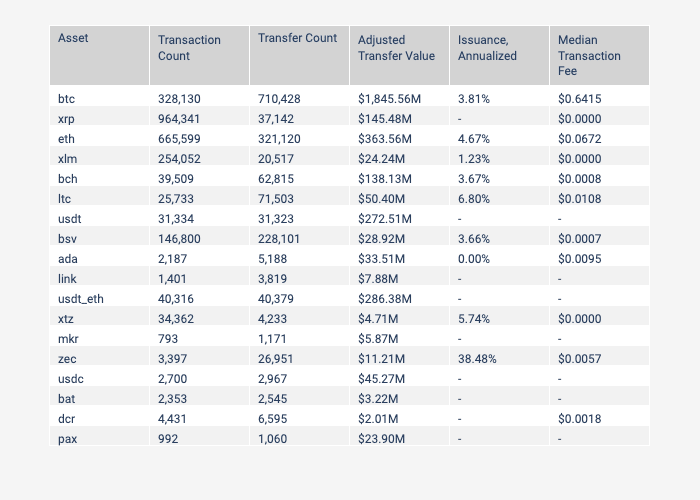
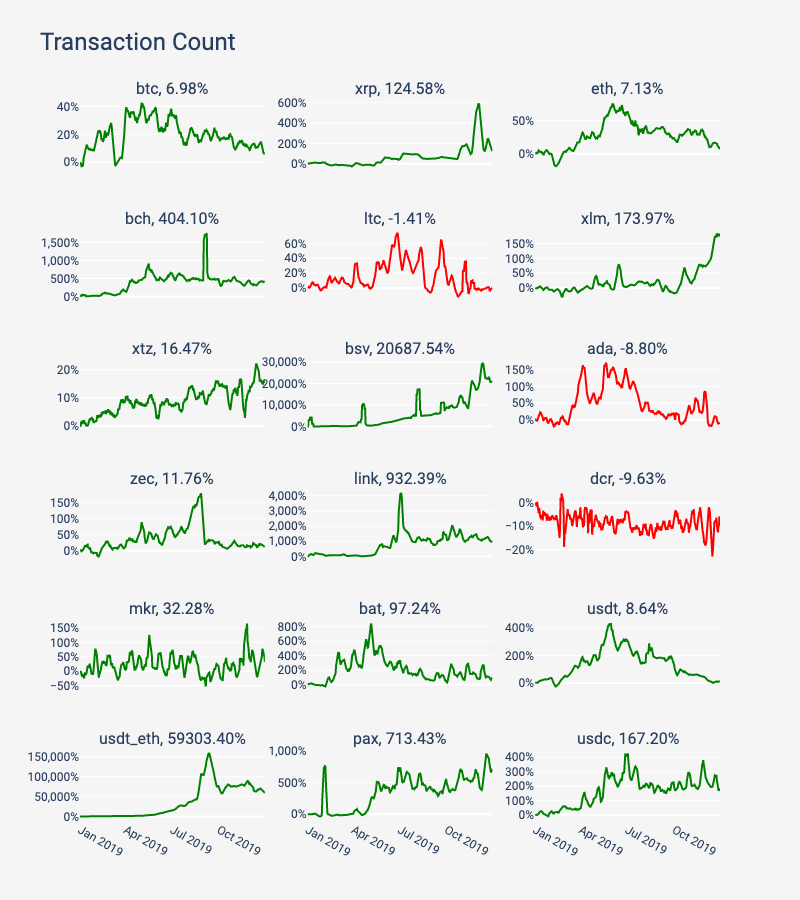
- Total transactions
Since 2019, the total transaction volume of most mainstream assets has increased. After USDT_ETH achieved an amazing 59,303% growth, the total transaction volume of BSV has increased by 20,688%, most of them (74%) are OP_RETURN transactions for non-economic on-chain data storage. XRP has an average of almost 1 million transactions, which is mainly due to the surge at the end of 2019.
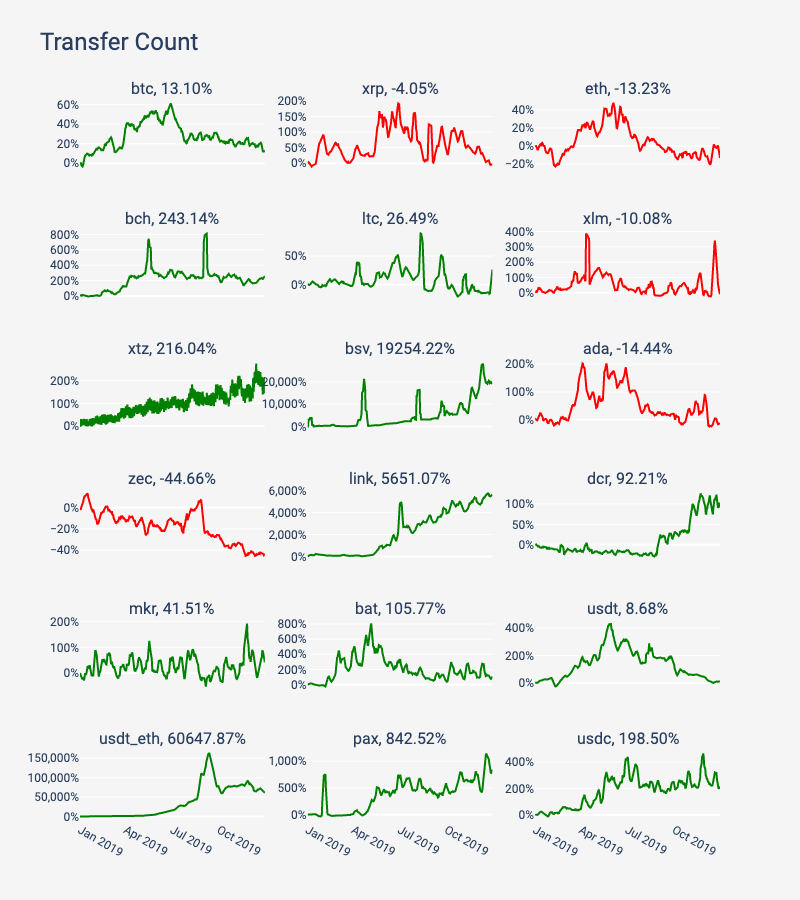
- Total transfers
Transfer refers to any transaction that moves crypto assets from one address to another (Satoshi Masamoto Note: In past articles, CoinMetrics defined "transfer" as a native token transfer between two addresses, "transaction ”Includes contract calls and other non-monetary operations). For platforms like Ethereum, only ETH transfers are calculated, and ERC20 or other tokens are not calculated.
BTC and ETH lead all assets in terms of average daily transfers, while BSV and USD_ETH have the largest increases, 19254% and 60647%, respectively.
Please note that XTZ's active address number line looks thicker than other assets, because XTZ has a fixed dividend (Staking expenditure), which leads to differences in daily activities.
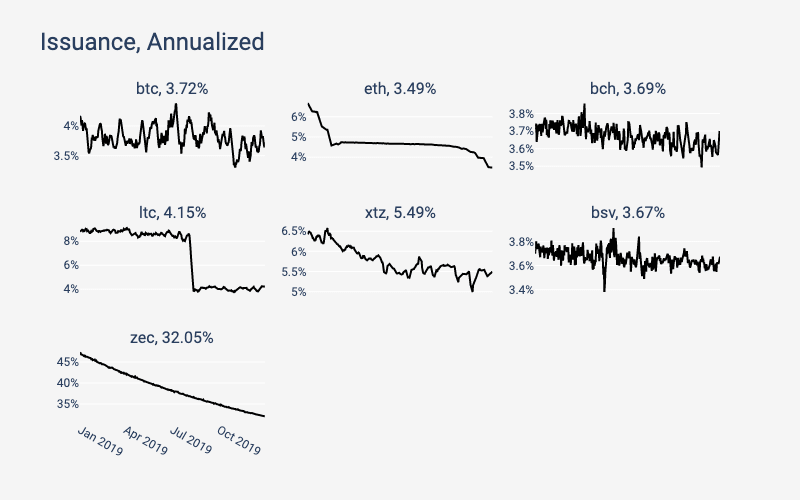
- Annual issuance percentage
The public chain has different methods for issuing / releasing new supplies, such as Bitcoin and Ethereum (and other currencies) issuing new supplies through block rewards. Each block will release new supply, and the existing supply will be slightly diluted. The annual issuance percentage is calculated by taking the number of new supply units issued daily, extrapolating to one year (ie multiplying by 365), and dividing by the current supply. An increase in issue percentage indicates an increase in supply dilution, while a decrease in issue percentage indicates a decrease in dilution. CM currently only weighs the issuance volume of the public chain's native assets. The sample does not include ERC20 or other assets.
In 2019, the issuance of Litecoin (LTC) experienced some significant decline. According to the agreement, the issuance of Litecoin was halved, the issuance of ZEC dropped from 47% to 32%, and the issuance of ETH from 6.6% It dropped to 3.5%. The circulation of BTC will be halved in 2020. It is worth noting that there is no increase in the number of assets issued in this sample.
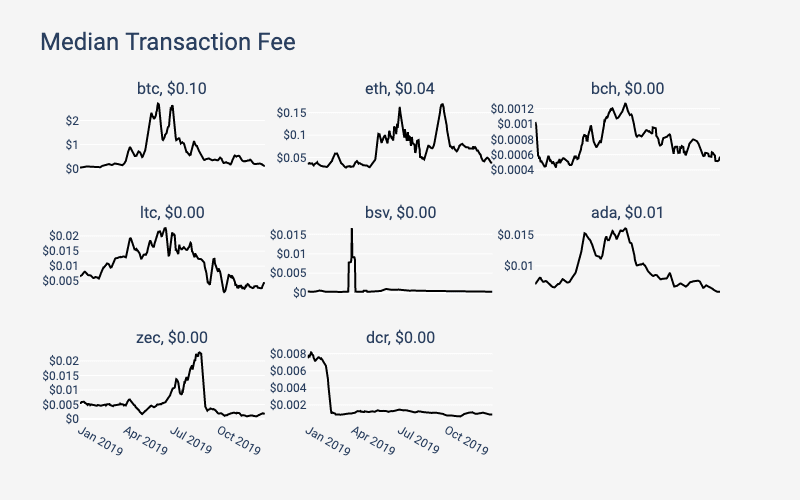
- Median fee
The median transaction fee is calculated based on the median transaction fee (USD) of the day. In 2019, BTC and ETH are the only assets with an average daily transaction fee of more than 0.06 $. Most other The average fee for the asset is less than 1 cent, which indicates that the transaction demand of these networks is still low (compared to its capacity), and there is almost no need to pay more.
Safety & Health
- Computing power
Without direct connection to all mining pools and miners, it is impossible to determine the exact computing power of the network. As a result, many data providers (including Coin Metrics) estimate computing power by looking at the difficulty of mining on a given date and the number of blocks generated within 24 hours.
Computing power is the speed at which all miners in the network complete calculations. Units of measurement vary by agreement. It can be used to estimate the computing power of the protection network. Since the hash rate is only related to the underlying PoW public chain, it is not possible to calculate ERC-20 tokens or blockchains that do not use the PoW consensus mechanism.
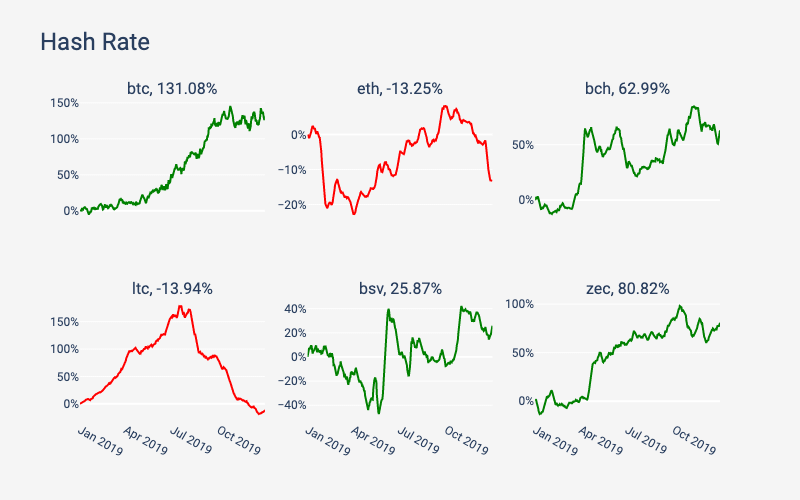
We cannot directly compare the computing power between protocols using different hashing algorithms such as BTC and ETH. However, comparisons can be made between protocols that use the same algorithm, such as BTC, BCH, and BSV.
BTC remains the clear leader in computing power growth, growing by more than 130% in 2019. The computing power of BTC is several orders of magnitude higher than that of BCH and BSV. In addition, the computing power of ETH has also declined over the past year, which may be because ETH will launch its PoS plan in 2020.
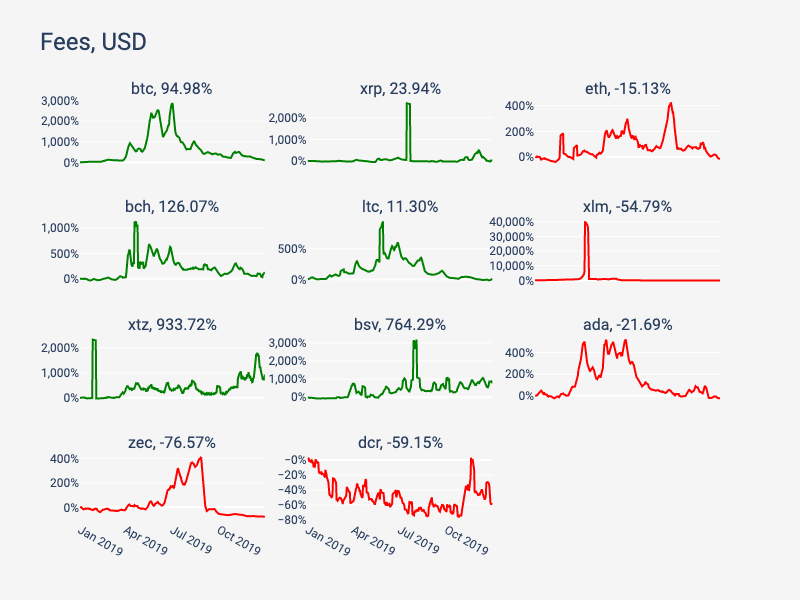
- Total fee
Unlike the median fee, the total fee measures the total dollar value of all fees in all transactions in a day. It does not include block rewards for new blocks.
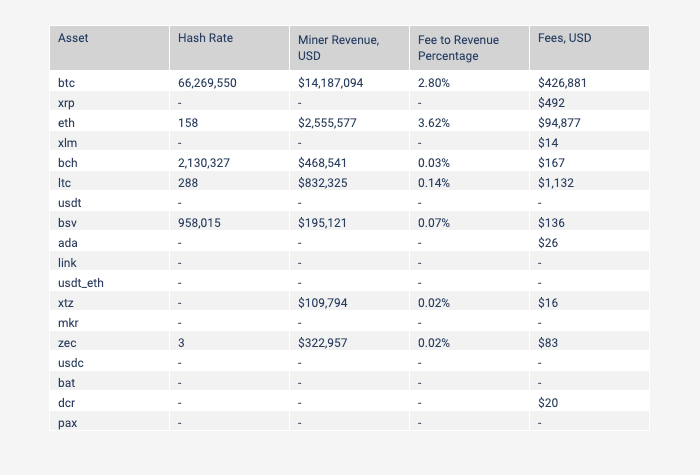
In terms of total daily fees, BTC and ETH lead all other assets with average annual fees of US $ 427,000 and US $ 95,000. In these samples, none of the other assets have an average daily fee exceeding US $ 1,200.
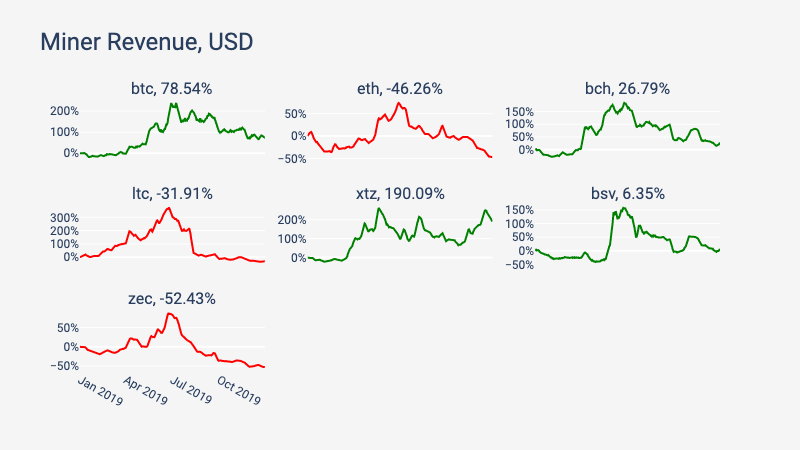
- Miner income
Miner income measures the dollar value of all transaction fees plus new block rewards. Both methods are paid to miners or other validators (such as PoS nodes). The miner's income represents the incentive pool of blockchain miners. The more the total revenue, the more money the miner may earn. Therefore, the total income of miners is an important indicator of the long-term health and safety development of the agreement and its related industries. The miner's income is only for public chains using PoW or PoS consensus mechanisms, excluding ERC-20 tokens or other blockchains without mining or staking.
As with total fees, BTC and ETH are far ahead of most other assets in terms of miner income. In 2019, BTC generated an average of $ 14.2 million in daily revenue for miners, while ETH generated an average of $ 2.6 million in daily revenue. The average daily income of other assets to miners does not exceed $ 900,000.
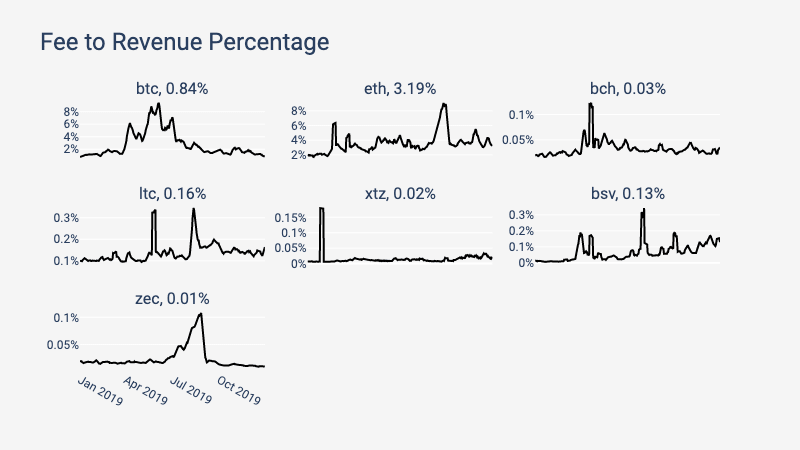
- Fees as a percentage of revenue
The percentage of fee to income refers to the weight of the transaction fee to the miner's income. In the long run, the block rewards of many blockchains will gradually be reduced to zero. This is due to the issue of periodic block reward halving, etc. of. With the decrease of block rewards, the proportion of fees in the entire miner's income began to increase. Therefore, the handling fee is an increasingly important part of the long-term sustainability and healthy development of the blockchain.
As mentioned above, BTC and ETH are currently the only two assets with considerable fees, so they have a big lead in future security and health. In terms of specific proportions, ETH is far ahead, ending at 3.2%, while BTC is 0.8%.
We will continue to update Blocking; if you have any questions or suggestions, please contact us!
Was this article helpful?
93 out of 132 found this helpful
Related articles
- Interpretation of the head of China Telecom's blockchain business R & D: Why do telecom operators do blockchain?
- 4D long texts talk about decentralized storage
- Looking ahead to 2020 | Coinbase: What have cryptocurrencies experienced over the past 10 years?
- SheKnows End of Year Debate | Talking about Bubble Discoloration? Layout of blockchain, capital will never sleep!
- Blockchain landing application 2019 statistics: government affairs and finance occupy half of the country, and China's blockchain landing volume has reached the world
- Can Andrew Yang's White House Crypto Party be held successfully in 2020?
- Comment: Regulatory sandbox and blockchain coexist and help innovation