$138 billion in historical days or tips for iron tops! Predicting BTC's expected decline
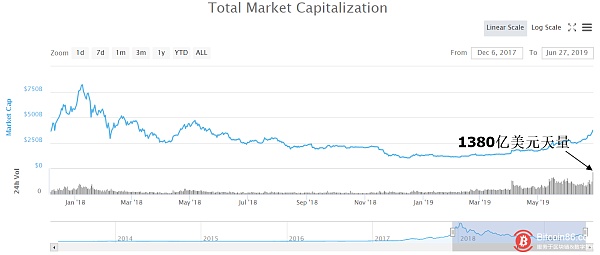
From the performance of the total volume of digital currency, the highest 24-hour volume has rebounded to $138 billion, which is 1.15 times the highest volume of $120 billion in mid-May. Of course, it is also twice the price of $68 billion in 2017. It can be seen that this short-term heavy volume is most worthy of investors' attention.
Because the heavy volume appeared during the adjustment period of most digital currencies, and the heavy volume created a unique condition for investors to ship. The top of the amount we usually think of is also completed during the period of high volume.
- More than half of 2019, a large inventory of BCH results
- Although Bitcoin has broken through, most people are still just onlookers.
- 48 cryptocurrency exchanges approved by the Philippines

From the BTC's volume and price performance, the maximum volume of 24 hours reached 43.5 billion US dollars, the value is significantly higher than the highest 34 billion volume in May. Judging from the recent closing price of BTC for 8 consecutive trading days, it is obviously a unilateral rebound. At this time, the accumulation of selling pressure will cause BTC to significantly increase its performance after 15%. In fact, the release of selling pressure is fully beneficial, which is good for reducing the resistance to rising. However, the player who sells the BTC in the field indicates that the main force has a strong shipping intention. And considering that the injury is likely to be a small and medium-sized investor, the expectations for the top of the BTC will be very significant.
At least from the perspective of investors focusing on short-term or chasing, the BTC needs a larger adjustment in the near future.
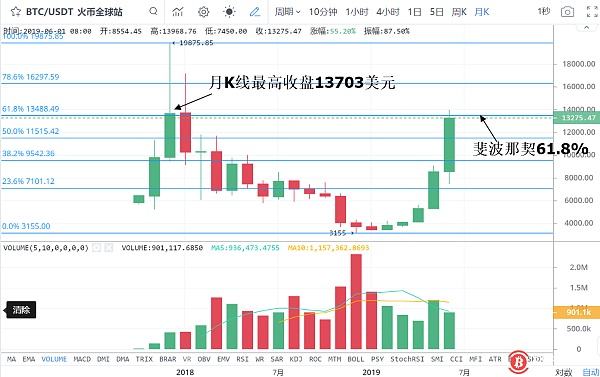
Why is it a big adjustment around $14,000? Just look at the BTC price performance on the monthly K-line and you can draw conclusions.
In fact, the monthly closing price of the monthly K-line BTC in 2017 was $13,703, which was much lower than the highest closing price of the K-line of $19,283. And, after the BTC rebounded to Fibonacci's 61.8% of $13,488, we saw the adjustment of the strongest resistance, which was actually in anticipation.
Be aware that Fibonacci 61.8% is the strongest pressure in any upswing. A breakthrough failure means that larger adjustments will occur. After the BTC broke through $13,488, it was more like a false breakthrough signal. The subsequent BTC's 15% drop in the 4:30 decline proved that the selling pressure is still very large.
Judging from the callback expectations, BTC’s short-term chips are loose, which is beyond doubt. The most noteworthy $11515 is the recent support price. Of course, the lower support is around $10,000, which is the highest price for the BTC to break away from the sideways in May and June. At the same time, $10,000 is psychologically easier to get support from investors. For more than 10,000 US dollars, there are many investors chasing up and buying, and the chips are naturally not stable.
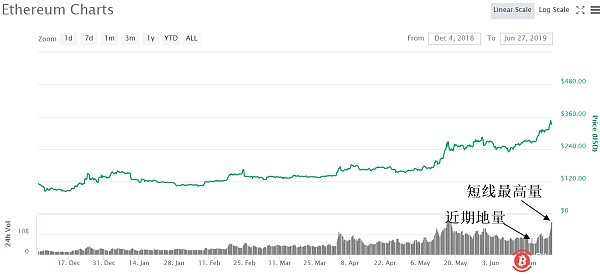
To know that the trend of ETH is actually followed by BTC, the volume of the volume is also very consistent. It is also as high as 350% from the increase, which is very consistent with the BTC's increase.
Although the ETH shown in the figure has the highest amount in the near future, the volume effect is not as high as the peak in May. That is to say, after the recent volume of trading volume, the amount of ETH relative to BTC is obviously insufficient. The lack of new high volume also indicates that the chasing is weak, resulting in the short-term top of the price.
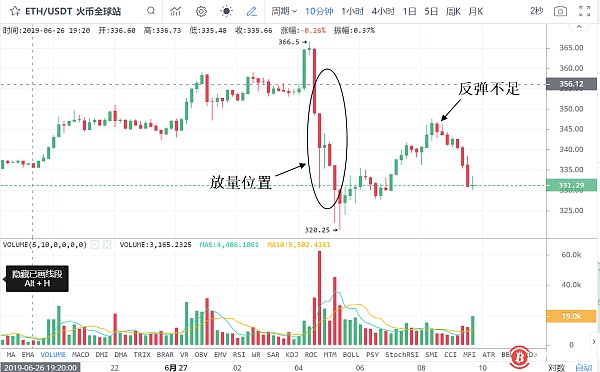
In the 10-minute K-line of ETH, most currencies are similar to this form. That is to say, during the heavy volume, the chip change hands in the wide price range from $320 to $365. The increase during the price rebound was not enough to regain the decline. This shows that as a large number of ETHs change hands at high levels, investor buying power has not pulled up prices in the short term. Although it is a very short 10-minute K-line, it also shows that the chasing of investors' psychology has been greatly affected, and the willingness to chase has weakened. (CoinNess)
We will continue to update Blocking; if you have any questions or suggestions, please contact us!
Was this article helpful?
93 out of 132 found this helpful
Related articles
- Analysis of the madman market on June 26: Crazy, what should we do?
- Bitcoin, which is also step by step: an alternative feast brought by the skyrocketing gold
- BTC, ETH continues to rise, how to look at the market outlook and profit grasp
- The bull market has a top! The indicator tells us where the top of the BTC is.
- BTC broke through 11700 and hit a new high, and the trend achieved a strong rise
- Amaranths are tied! After the big rise, the price of bitcoin fell below 10,000 dollars.
- Deloitte Report: 73% of Chinese companies regard blockchain as a strategic priority


