HOLD Cave: The Story of Bitcoin’s Growth Amidst Volatility
HOLD Cave: Bitcoin's Story Amidst VolatilityAuthor: Dhruv Bansal, Sam Bradbury, and Stephen Hall, Unchained Capital; Translation: Blockingxiaozou
When Unchained was just starting out in 2016, we created two charts to help us build our business strategy.
Two years later, we published the first of those charts in our first Bitcoin data science article, popularizing the concept of the HODL Wave – buying bitcoin at the peak of a bull market and holding for years through subsequent bear markets. The chart itself showed the age distribution of the bitcoin UTXO set, spreading the outputs across various age groups of different colors that undulated over time.
The HODL Waves chart became a cornerstone of Unchained’s strategy. Being able to see how much bitcoin was being held by long-term investors gave us confidence that there was a market for bitcoin financial services. I’m gratified to see the term “HODL Wave” become a bitcoin-related common phrase and data providers such as Glassnode and Woobull replicate the use of the HODL Waves chart.
- Long push: Data tells you whether the NFT market is about to start a new bull market
- What are the highlights of GBRC-721 compared to BRC721?
- Why SEC Chairman Gary Gensler is Cracking Down on the Crypto Market: Latest Speech
Despite the success of the HODL Waves chart, we have yet to publish the second chart we created in 2016, which guides our strategy for bitcoin-backed lending products.
Now, we’re ready to unveil the second chart: Hold Cave.
1. HODL Cave Overview
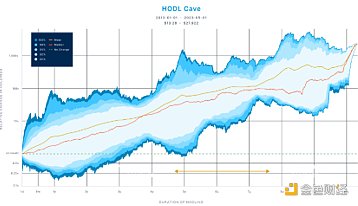
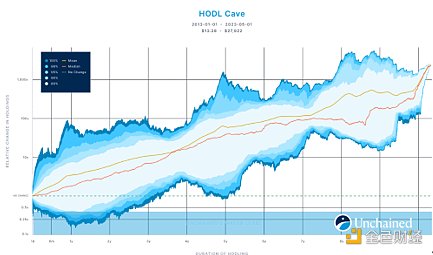
The HODL Cave chart aims to answer a simple question: “What have the historical returns been for investors holding bitcoin for a given amount of time?”
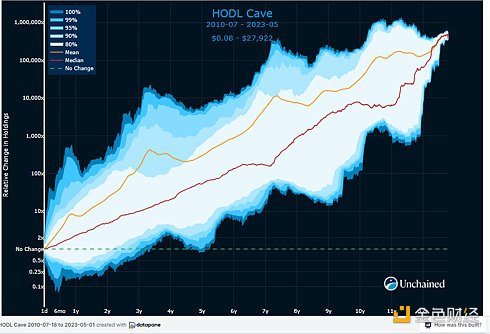
For example, the average return for holding bitcoin for two years (orange line) is just below 25x and grows to 1000x after 6-7 years. Holding bitcoin for 2 years results in a positive return 90% of the time. This proportion increases to 99% with an additional year. People who have held bitcoin for more than 5 years have never experienced a loss!
The market is clearly aware of the relationship between holding bitcoin for the long term and reaping huge returns. The speculation around bitcoin’s “number go up” technology was a key reason why it initially attracted so many investors. For bitcoin detractors, this huge historical appreciation of bitcoin is the most difficult fact to explain.
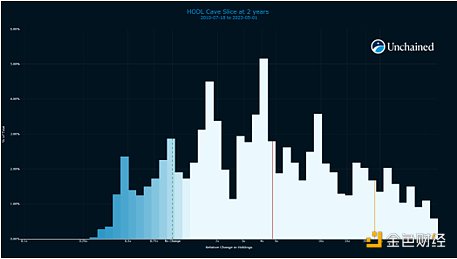
However, it is also clear from this that there is a huge volatility of Bitcoin in the short and medium term. The average return on holding Bitcoin for two years may be 23 times, but it is still possible (although less than 5%) to lose 50% of the initial investment.
Any investor considering holding Bitcoin would be powerless and give up their long-term returns in a bear market if they are not prepared to face this volatility. Honest Bitcoin investors must ensure that we tell the truth about Bitcoin volatility when telling any story about long-term growth.
Many visualizations of Bitcoin price history show growth or volatility, but not both. HODL Cave is special because it allows us to see both growth and volatility at the same time.
2 , why is it called “HODL Cave”?
In Plato’s “Allegory of the Cave,” prisoners in the cave face away from the light of the fire and treat their own false shadows of themselves and things as reality. Prisoners who leave the cave and see the real world in bright light are in pain. Some people turn away in disbelief. The prisoners who return to the cave can no longer see the shadows because their eyes have adapted to the outside light. They tell the prisoners who stay in the cave about the real situation outside, but they do not believe it. Instead, those who stay begin to vigorously resist any further action to leave the cave.
Plato’s allegory resonates with people who encounter unexpected resistance when sharing valuable new ideas that promote personal growth. Holding Bitcoin for many years is such an experience, and we are not the first to describe Bitcoin holders with Plato’s allegory. Long-term Bitcoin investors have left the fiat cave and believe the existing system is fragile and not real, only the more basic reality of Bitcoin is projected on the wall as a shadow. However, a wider market voice believes that Bitcoin investors have become blind after experiencing the pain of the bear market and the dazzling highs of the bull market.
We like the name “HODL Cave” for two reasons. First, the chart data and analysis it supports are complementary to the data in the HODL Waves chart, so the rhyming name is fitting. Second, the 100% dark blue area above and below the chart, combined with the sawtooth features of financial time series, create an image of stalactites and stalagmites, with local price changes making long-term holders feel sad as they emerge from the cave. The lines showing average and median returns are like a rope that encourages those stuck in local minima to persist, while warning those skyrocketing in local maxima that they will eventually return to the mean.
3. Let’s explore the Cave!
The entire HODL Cave chart tells the story of Bitcoin’s growth amid volatility. But the details of the story, the ups and downs at the bottom and top of the cave, and the cyclical transition from tunnel to cave, tell a more nuanced story that we will explore below. You will notice that in the following, we switch to a chart version that begins in 2013; this is mainly because we expect that most Bitcoin holders did not experience massive returns from early Bitcoin price discovery.
(1) Sudden Ecstasy and Agony
The chart on the far left shows the miserable nature of holding Bitcoin for the short term.
Looking back in history, holding Bitcoin for a few months was more like gambling than investing. Although the average return rate was slightly positive in the short term, the median hovered around zero return level, and only began to skew positive after holding for 4 to 6 months. The middle 80% of the distribution ranged from a loss of 40% of the initial investment to a loss of three times that amount.
However, for a few, this short-term volatility was even more extreme. In Bitcoin’s history, if you bought Bitcoin and held it for 3 months, you could see a return of 10x – or a loss of 70%. Imagine the reaction and subsequent attitude toward Bitcoin of an investor holding Bitcoin for the first time who experienced such extreme volatility.
Data shows that some people may not need to imagine what is being discussed here – they have experienced it for themselves!
(2) Exiting the Fantasy
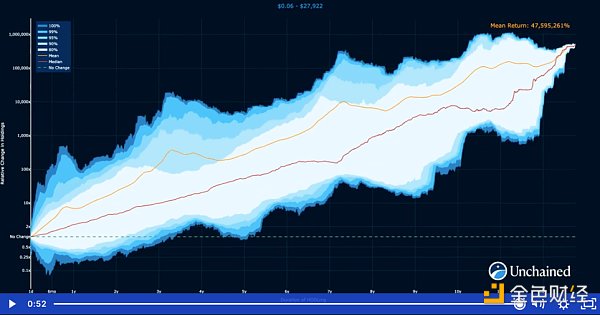
The chart on the far right shows the frenzy of speculation around Bitcoin – investors who bought Bitcoin early and held it for more than 10 years saw enormous (over 1,000 times) returns. However, there are several reasons to be skeptical of achieving the returns shown on the far right of the chart.
First, the exact magnitude of the return on the far right is highly sensitive to the initial date chosen for the chart’s time period. The earlier the initial date, the more Bitcoin’s price will have risen over that time period. The HODL Cave chart when Bitcoin was priced at less than $1 in 2010 shows a return of 1,000 times as much as that shown on the chart when Bitcoin was nearly $100 in 2013.
Second, the far right of the chart represents holding Bitcoin for the longest duration depicted in the chart, so there are fewer such long-duration windows for any given time period. For example, for a chart drawn for a 10-year period, there are approximately 3,644 one-week windows, but only one window with a duration exactly equal to 10 years (buying Bitcoin on the first day of the time period and holding continuously). Therefore, the data variance (height of the cave along the y-axis) on the far right of the chart is suppressed.
Finally, the idea of exiting a decade-long Bitcoin position to realize enormous returns is a fantasy, primarily because those who actually hold Bitcoin for ten years or more would not consider exiting Bitcoin. Morpheus said it best:
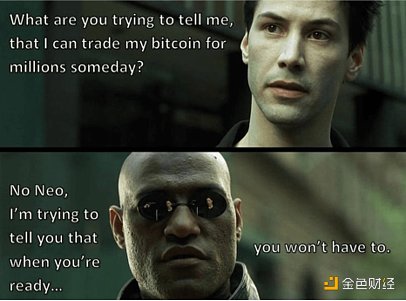
“What are you trying to tell me? That I can make millions with my Bitcoin someday?”
“No. I’m trying to tell you that when you’re ready… you won’t have to.”
(3) Calm Amidst the Storm
Bitcoin halves every 210,000 blocks. In theory, this should occur every four years, but in practice, the halving tends to happen slightly more quickly. Due to the halving, the price of Bitcoin experiences a roughly four-year bear market cycle, followed by a bull market. The HODL Cave chart cleverly displays this market cycle.
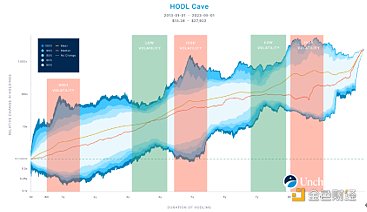
The height of the chart (the distance between the cave floor and ceiling) is a measure of the distribution of total profits over a given period of time. From left to right, the “cave height” shrinks and grows over a cycle of nearly four years. During the same period, the average profit and median profit sometimes move closer together and sometimes farther apart. The dazzling prices in the bull market bring about large-scale sell-offs, leading to the subsequent appearance of the bear market, causing volatility. In the next few years, as Bitcoin enters a relatively calm period, the volatility will weaken, creating a calm between storms.
Therefore, halving will not only lead to the cycle of Bitcoin prices, but also to the cycle of Bitcoin price volatility, which in turn affects unrealized Bitcoin positions. This has a practical impact on investors. Bitcoin positions with unrealized gains or losses held for about four years (or eight years or twelve years) may soon return to the mean level.
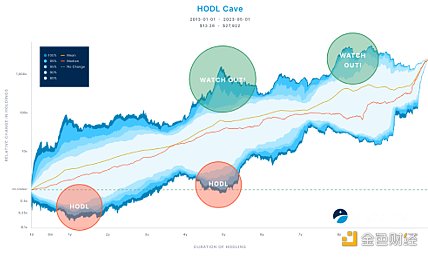
The “top” of the HODL Cave repeats about every four years, indicating that investors should “be careful” and be prepared for bear market action. The “bottom” indicates that investors should “hold” a little longer. In both cases, investors rely on the idea that unrealized gains/losses will return to the mean level within a cycle.
(4 ) Avoid Risk Drowning Cave
Unchained is proud to offer Bitcoin users a full range of financial services, including custody, trading, retirement, inheritance, and loan products. But when we started in 2016, we only planned to launch one product: a Bitcoin-backed dollar loan.
We became the first company to offer secure, regulated Bitcoin collateralized loans to US Bitcoin holders. But because we were the first to enter the market, we had to deal with a lot of unknowns. The HODL Cave chart was a great help to us.
Collateralized loans typically use a loan-to-value ratio (LTV) to limit risk. For example, if a borrower provides $100,000 in collateral, the lender may provide the borrower with $50,000 in principal – or 50% LTV. If the value of the collateral falls below a certain threshold, the borrower may be required to post additional margin, provide additional collateral, or pay part of the principal.
As the LTV increases, borrowers are more likely to obtain liquidity (because they can provide less collateral), but the risk and cost of the service process also increase as the likelihood of additional margin increases. In HODL Cave, the LTV of a particular loan can be considered a “water level”. If the LTV is too low, the cave will dry up, and there will be nothing to float on because the collateral requirements are too strict, and borrowers will not have an incentive to borrow. If the LTV is too high, the cave will be flooded, and borrowers and lenders will be submerged in the risk of excessive and frequent additional margin calls.
When we first created the HODL Cave chart in 2016, we set a 50% LTV ratio. We believed that LTV provided an appropriate balance between value, cost, and risk among Unchained, our borrowers, and our lenders. The 50% LTV soon became an industry standard.
As Bitcoin matured in another market cycle, we reexamined our analysis. In 2021, we checked the changes in the HODL Cave terrain since 2016 and decided to lower the LTV of all our new loans to 40%. In hindsight, in light of the cyclical volatility, we lowered the water level because we felt the market was in a “cautious” phase.
It turned out to be a wise decision. By limiting the risk we and our clients assumed, we weathered the 2022 bear market together without any loan losses or almost any liquidations.
4 Exploring your own Cave
HODL Cave displays the distribution of returns for holding bitcoin for a fixed period. If you’ve been holding bitcoin for a while, you can use HODL Cave to visualize your returns and compare them with the returns of other holders for the same period.
However, the shape and terrain of HODL Cave are highly dependent on the time period you choose, especially for longer-term holdings. As discussed in the “Exit the Fantasy” section above, the earlier the start time and the longer the time period, the more appreciation in Bitcoin’s historical price, and the greater the final return difference displayed in HODL Cave.
If you want to compare your Bitcoin returns with the market, then choosing a timeframe that matches your own experience with Bitcoin is important for HODL Cave. For example, if you first heard about Bitcoin in 2017, your HODL Cave should use the time period from 2017 to present to draw. This chart will now show your Bitcoin journey over the past few years, allowing you to compare your returns more fairly with other investors in your period.
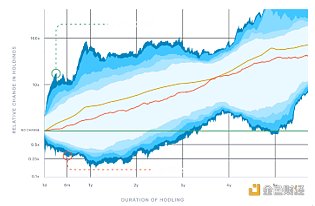
To help you draw your own personal HODL Cave, we created the animation above, covering the time range from 2010 to present. You can scroll to the time you first came into contact with Bitcoin and see your own HODL Cave, and plan your future Bitcoin investments.
For example, the following custom chart shows the returns of Bitcoin holders in 2017, and you can see some interesting phenomena:
· Almost all holders (more than 99%) can make a profit as long as they hold for three years or more. In this group of Bitcoin holders, those who hold for at least five years are profitable. Those who are still losing money after holding for such a long time bought at the top of the market in 2017 and sold at the bottom in the recent 2023.
· In this group of people, those who hold for about one year have the highest risk of holding returns-they may hold for one year and perfectly grasp the market opportunity (up 1000%), or they may hold for one year but suffer heavy losses (down 80%). 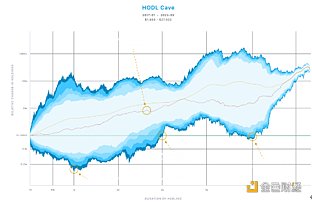
If you are a Bitcoin holder in the bull market of 2021, then your cave is indeed a dangerous cave. You are likely to be drowned. However, HODL Cave can still help you paint a picture of how to start cave exploration from here:
· All holders have been experiencing nominal declines since they knew about Bitcoin in 2021.
· There are few exceptions. In the past few years, the only way to make a profit from buying Bitcoin is to be a short-term trader, but even the luckiest trades can only provide a maximum return of 2 times.
· From March 2021 to present, holding for more than a year will almost certainly result in a loss, but with the deepening of the Cave, the average and median values are about to emerge. 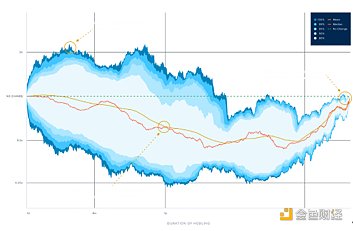
We will continue to update Blocking; if you have any questions or suggestions, please contact us!
Was this article helpful?
93 out of 132 found this helpful
Related articles
- Metaverse Investment: Opportunities and Risks in the Trillion-dollar VR Market
- ZK Co-Processor: Further Opens up the Verifiable Computing Market
- On-chain data analysis: Are we on the brink of the next NFT bull market?
- Amid the era of encrypted regulation, the United States is falling behind.
- Is the Bitcoin ecosystem a flash in the pan or brewing for a bigger explosion? BRC-20 has seen a roller coaster trend.
- Galaxy Digital: How is MEV currently being distributed among participants and who will capture MEV in the future?
- How do top asset management companies managing over $1.5 trillion bet on Bitcoin?


