Deep analysis of ARB on-chain chips Users continue to increase their holdings, and most large holders are at a loss.
In-depth analysis of ARB on-chain chips User holdings continue to rise, with most large holders in a loss.In the past 30 days, a total of 15 million ARB has been withdrawn from exchanges, indicating that the upgrade of Cancun is imminent and users are continuously increasing their holdings.
The number of addresses holding 1 ARB is steadily increasing, with the address holding 50,000 ARB showing the highest growth rate, maintaining a 10% increase in July. This indicates that large funds on the chain are continuously buying, although the growth rate has slowed down due to the overall market conditions.
In the past 30 days, a total of 15 million ARB has been withdrawn from exchanges, indicating that the upgrade of Cancun is imminent and users are continuously increasing their holdings.
For the top 100 holders of ARB, most of them are in a loss of 17%, and most of them have been holding ARB for about 3 months. The number of transfers among these large holders is relatively low, indicating that they are super holders of ARB.
- Exclusive|Interpreting the draft guidance principles of Taiwan’s Financial Supervisory Commission Can’t use the slogan To The Moon anymore?
- Depth Latest analysis of asset risk assessment for stablecoin TrueUSD (TUSD)
- Analyzing the Unique Aspects of Puffer Finance’s Design from the Perspective of Node Validation Rights
Among the large holders of ARB, the largest number of holders and the highest amount of ARB held are in the range of 1.3 to 1.4, and they bought in the earliest market. From historical data, it is found that a price around 1 US dollar may not be very attractive to large holders and may not trigger a significant increase in their holdings.
Research on the Number of Holders
The number of holders represents the project’s supporters.
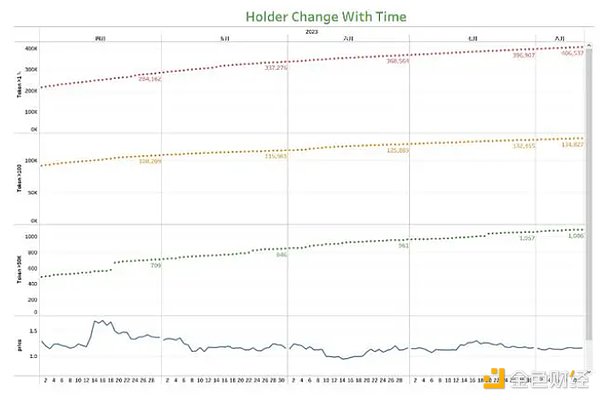
The above chart shows the number of ARB holders over time, representing those holding more than 1 ARB, more than 100 ARB, and more than 50,000 ARB, respectively.
1) More than 1 ARB, valued at around 1 U, represents the total number of holders.
Here, I use a different definition from other data platforms. In my research, I found that there are a large number of very small non-zero addresses, which are just remnants of selling/transferring. Obviously, these addresses cannot be considered as holders because they do not actually hold any ARB. However, their existence can affect the total number of holders and even lead to opposite conclusions.
2) More than 100 ARB, valued at around 100 U, refers to the number of users who actively buy and hold ARB.
3) More than 50,000 ARB, valued at around 50,000 U, represents the high asset holding population.
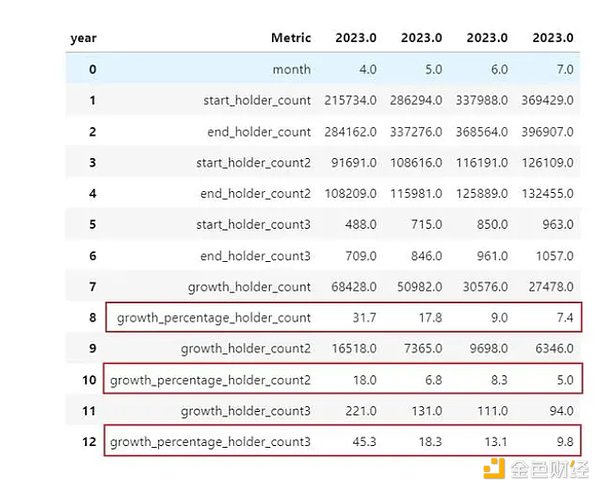
From the data, it can be seen that the number of ARB holding addresses is steadily increasing and has reached 400,000. At the same time, it is also found that the growth of the three types of holding addresses has been declining since March. The growth of the number of addresses holding more than 1 ARB has decreased from 31.7% to 7.4%. The growth of the number of addresses holding more than 100 ARB has decreased from 18% to 5%, and the growth of the number of addresses holding more than 50,000 ARB has decreased from 45% to 9.8%. This indicates that the recent market conditions have had a certain impact on holders.
However, if we compare the growth rates, we can see that the address holding 50,000 ARB has the highest growth rate, indicating that large funds on the chain are continuously buying, although the growth rate has slowed down due to the overall market conditions.
Research on DEX/CEX Data in the Past 30 Days
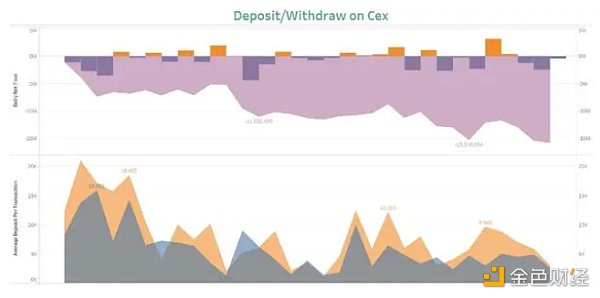
The first image above represents the daily deposit/withdrawal situation of the exchange. The yellow color represents the net deposit for the day, while the blue color represents the net withdrawal for the day. The shaded area represents the cumulative deposit and withdrawal. The second image represents the average amount of each deposit/withdrawal, which is used to determine whether it is a behavior of big players or retail players. Intuitively, higher peak values indicate the behavior of big players, while lower peak values mainly indicate the behavior of retail players.
From the data on the graph, in the past 30 days, a net outflow of 15 million ARB has occurred from the exchange. The largest net outflow occurred on July 24th, with a net outflow of 4.3 million ARB. At the same time, we also found that on August 8th, there was a net inflow of 3.3 million ARB. In terms of average amount, it belongs to the deposit behavior of big players. This may be a coincidence, or it may indicate that some big players are starting to surrender under the pressure of OP competition and the BTC market. Worth attention.
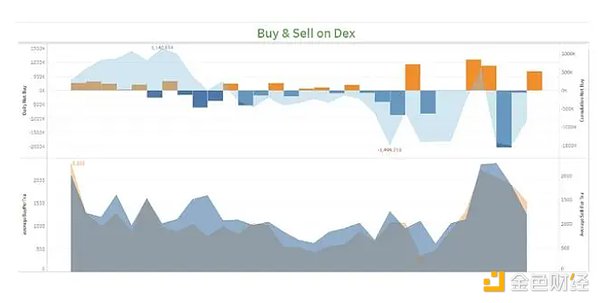
The above image shows the buying and selling behavior on the dex. The first image represents the daily buying and selling situation on the dex, where the yellow bars represent the net buying for the day, and the blue bars represent the net selling for the day. The shaded area represents the cumulative net buying volume, with negative values indicating net selling. The second image represents the average amount of each buy/sell, which is used to determine the behavior of big players.
Unlike cex, dex allows direct buying and selling.
From the above graph, it can be seen that in mid-July, the market was in a net buying state, while at the beginning of August, the market was in a net selling state. However, the cumulative values are not large, in the range of 1 million ARB. On August 8th, there was the largest net selling, with over 2 million ARB. However, overall, the trading on the dex is much worse than on the cex.
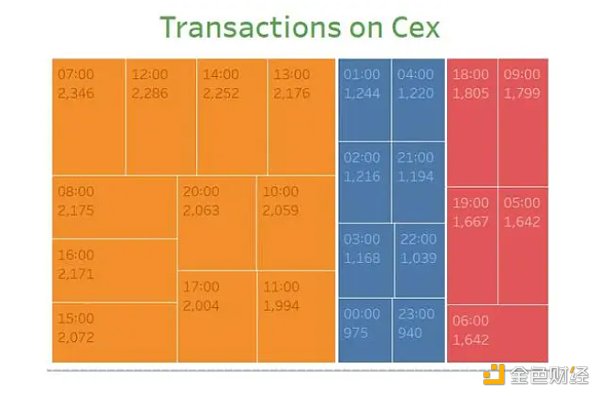
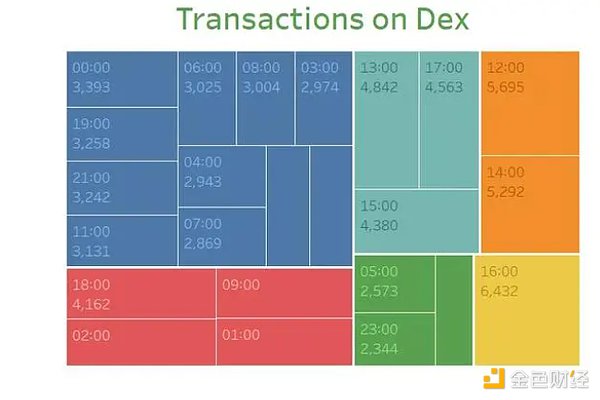
The above images show the number of transfers between dex and cex wallet addresses (contract addresses), which are the cumulative number of transfers in and out.
From cex, it can be seen that the most active times on CEX are UTC 12, 13, 14, and 07, which in Beijing time are mainly 3pm and evening, during the overlapping period between the Americas and Asia. It can also be observed that the number of transfers during other time periods does not differ significantly. Overall, arbde trading is active during many time periods.
From dex, it can be seen that the most active times on DEX are UTC 12, 14, 16, followed by 13:00 and 17:00. In Beijing time, it is in the evening, still within the overlapping area of the Americas and Asia.
Overall, there is no significant time zone difference between arb on cex and dex.
3 Profile of Major Holders
Note: Major holders refer to the top 100 addresses holding ARB after excluding project parties, dex, cex, mev, dex intermediary wallets, cex intermediary wallets, and other addresses.
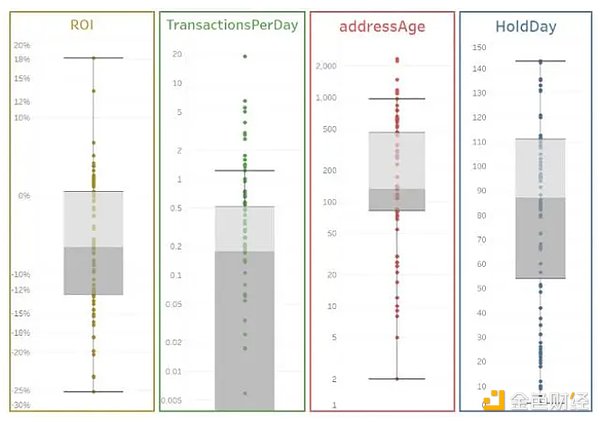
Above is the core information of the summary of the addresses of large coin holders.
1) ROI: From the perspective of ROI, most of the large coin holders are in a slightly loss-making state, with a median of -7%. The range of profit and loss for the middle 50% of large coin holders is between -13% and 0%. The maximum loss is 25%, and the maximum profit is 18%.
2) TransactionsPerDay (TPD) refers to the average number of daily transfers for an address, which is used to measure the activity level of a wallet on the blockchain and can indirectly determine whether the holder is engaged in long-term or short-term operations. From the data, the median TPD of large coin holders of ARB is 0.18, which means an average of 5 to 6 transfers per month, indicating that they are low-frequency players.
3) Looking at addressAge, the median wallet age is 134 days, with 50% of the addresses ranging from 82 to 457 days. This indicates a wide range of time spans, suggesting that both veterans and newcomers in the crypto industry have invested in ARB.
4) HoldDay represents the length of time an address has held ARB, with a median of 87 days, indicating that most holders started holding ARB about 3 months ago.
In summary, most of the large coin holders of ARB are in a loss-making state, and the majority have been holding ARB for around 3 months. The number of daily transfers on the blockchain is relatively low, indicating that they are low-frequency operators.
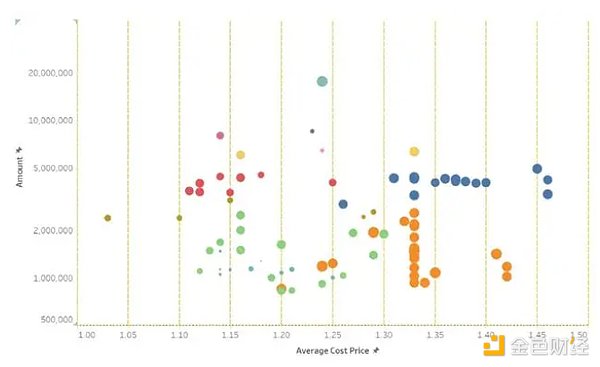
The above image shows the relationship between the cost of holdings and the amount held by large coin holders. The size of the balls represents the holding time. From the image, we can intuitively see that:
1) As analyzed earlier, most of the large coin holders are in a loss-making state. The largest number of large coin holders and the largest amount of ARB held are in the range of 1.3 to 1.4. The size of the balls also indicates that they were held during the period after ARB was listed.
2) The positions with small ball sizes do not have a large amount of holdings, indicating that newly acquired positions by recent large coin holders do not make up a high proportion in the overall distribution.
3) The price of ARB once dropped to around $1, but only one large coin holder had a cost basis around $1. This indicates that a price of around $1 does not attract a significant increase in holdings from large coin holders.
In summary, among the large coin holders of ARB, the largest number and amount of holdings are in the range of 1.3 to 1.4, and they were acquired during the earliest market conditions. Looking at historical data, a price of around $1 may not be very attractive to large coin holders, and it does not lead to a significant increase in their holdings.
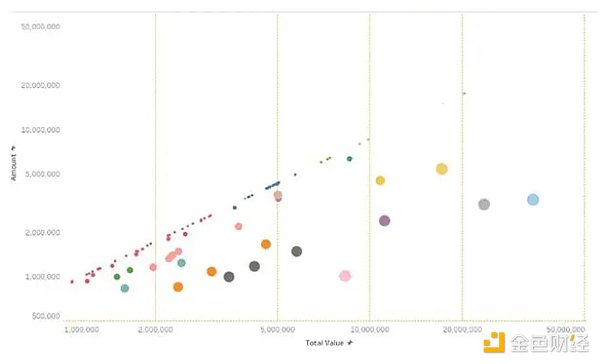
The above image shows the total assets of large coin holders (valued in USD) and their holdings of ARB. The size of the balls represents the remaining assets, i.e. the larger the ball, the smaller the proportion of ARB in their assets, which indirectly reflects the potential for further increase in holdings by large coin holders. From the image, we can intuitively see that:
1) The assets of large coin holders are all above $1 million.
2) The largest proportion falls between $2 million and $5 million.
3) Analyzing the size of the balls, most people have a very high proportion of ARB in their address assets, even up to the entire assets. Around 20% of large coin holders have a relatively low proportion of ARB.
In general, most of the ARB whales have a high proportion of ARB in their assets. Only slightly over 20% of the whales have the potential for further purchases. Of course, considering that the wallet addresses are relatively new, it is possible that these whales specifically use addresses to store ARB.
4 Analysis of Accumulators
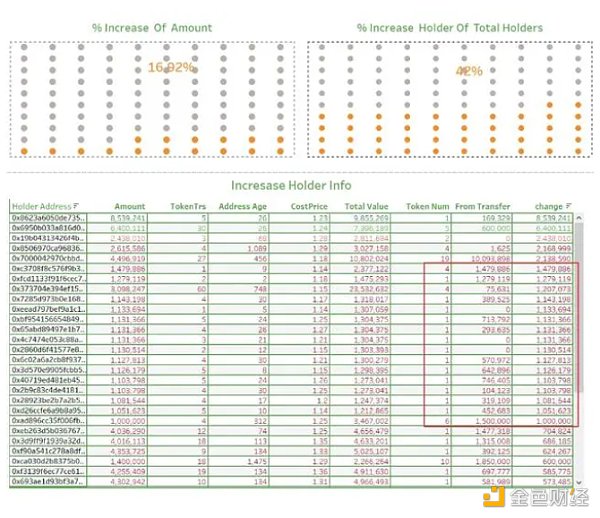
The above figure shows the data on the accumulation of holdings by whales in the past 30 days. Among them:
1) %Increase Of Amount represents the percentage of the accumulated amount of ARB in relation to the total ARB position. In this case, the percentage is 16.92%, with a total accumulation of 48.7 million tokens.
2) % Increase Holder Of Total Holders represents the percentage of accumulation among the whales holding ARB. A total of 42 whales have accumulated.
3) Among the accumulators, 1 million tokens seems to be a popular number for the whales. There are 16 whales who have accumulated 1 million ARB. Based on analysis, 14 of these whales have relatively new addresses (within 30 days) and only hold ARB, indicating that these addresses are specifically used to store ARB. Considering the number of transactions and different sources, it is not believed to be the work of the same person, so this phenomenon may be relatively common in the past month.
We will continue to update Blocking; if you have any questions or suggestions, please contact us!
Was this article helpful?
93 out of 132 found this helpful
Related articles
- In-depth Analysis of Base Standing on the shoulders of giants, emerging in the fiercely competitive Layer2 race.
- How can Base chain without tokens start Onchain Summer?
- Interpreting US Cryptocurrency Taxes General Taxation, Cryptocurrency Taxation, and Future Development Trends
- Outlier Ventures What pain points does the Web3 marketing model solve?
- Ketacoin collides with All In and soars a thousand times, who will be the next Wang Dalu?
- Curve CEO Michael Egorov From Physicist to Cryptocurrency Pioneer
- Quick look at a16z’s new SNARK-based zero-knowledge proof tools Lasso and Jolt