Interpreting the data on the current state of USDT: Market capitalization has increased by over 25% this year, but active users have significantly decreased.
USDT update: Market cap up 25% this year, but active users down significantly.Author: Carol
Recently, the market capitalization of USDT has continued to rise and has once again exceeded $83 billion, approaching the historical high set in early May 2022. Generally speaking, the market value of USDT, the largest stablecoin by market share, rising is usually seen as a “catalyst” for a bull market. However, during the process of the USDT market value rising, the market trend did not rise synchronously, and mainstream assets such as BTC are still in a sideways adjustment phase.
So where did the newly issued USDT flow? How much went to the trading market? After analyzing the changes in the market value of USDT, on-chain data, and trading data, BlockingData found:
-
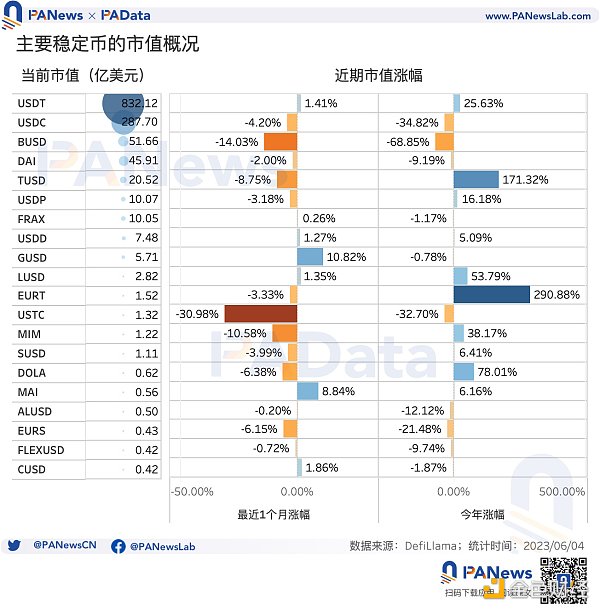
As of June 3, the total market value of stablecoins is about $129.216 billion, with a drop of about 0.87% in the past month and about 6.22% drop this year.
-
The largest market value currently is USDT, which is about $83.212 billion, accounting for 64.40% of the total market value, nearly 3 times that of USDC. Its market value has risen by 1.41% in the past month and by 25.63% this year, approaching its historical high.
-
Since the beginning of this year, the market value of TRC-20 USDT has grown by 34.90%, and the market value of ERC-20 USDT has grown by 19.23%. However, the growth trend of TRC-20 USDT is more significant, with a larger increase and faster growth rate. Currently, its market value accounts for 54.07% of the USDT market value.
-
Although the market value of USDT has returned to the high point in early May 2022, there has been a change in the internal composition of USDT, and TRC-20 USDT has become increasingly dominant. This compositional change will play an important role in understanding the market reaction caused by the changes in USDT market value because there are some differences in the application scenarios of TRC-20 USDT and ERC-20 USDT.
-
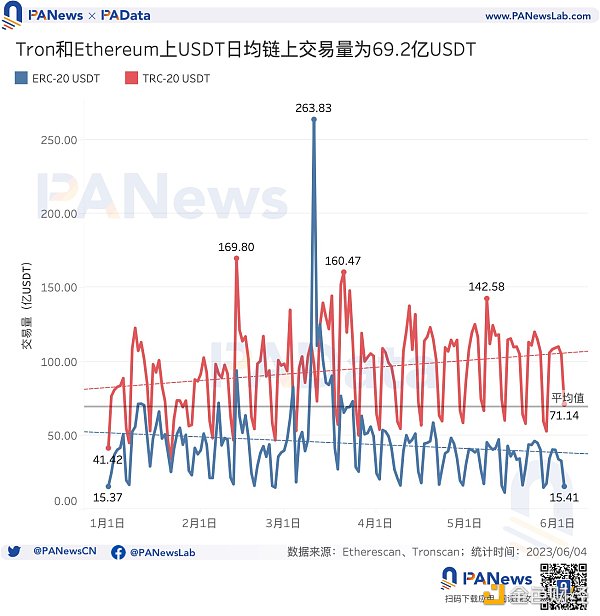
Since the beginning of the year, the daily on-chain transaction volume of TRC-20 USDT has shown a clear upward trend, with a year-to-date increase of about 71.76%, while the daily on-chain transaction volume of ERC-20 USDT has shown a slight downward trend, with a decrease of about 0.25%. The daily average on-chain transaction volume of the two types of USDT is about 6.917 billion USDT.
-
Currently, the inventory of ERC-20 USDT in exchanges is about 9.29 billion USDT, the highest this year. However, its daily transaction volume has shown a clear shrinking trend this year. The average daily transaction volume this month is only 36.7 million USDT, a decrease of 11.35% from May.
-
The proportion of ERC-20 USDT locked in smart contracts to its circulation is currently about 15.03%, which is equivalent to the level at the end of July 2022 and lower than the proportion when the market value was similar in early May 2022 (at that time, the proportion was about 20%). That is to say, for the same market value, the current size of USDT in DeFi is likely to be smaller than before.
-
Currently, the number of independent active addresses of ERC-20 USDT on the chain is about 56,800, which is lower than the daily average of 87,000 independent active addresses this year and is showing a downward trend overall. This means that the scale of active users of USDT may have decreased.
USDT’s Total Market Value Exceeds $83.2 Billion, TRC-20 USDT Market Value Increases Significantly by Approximately 35% This Year
As of June 3, the total market value of stablecoins is approximately $129.216 billion. In terms of composition, USDT currently has the largest market value, accounting for 64.4% of the total market value at approximately $83.212 billion. USDC has not shown significant improvement since the liquidity crisis in March, with a current market value of approximately $28.77 billion, accounting for 22.26% of the total market value and 1/3 of the market value of USDT. In addition, although the market values of BUSD, DAI, TUSD, USDP, and FRAX are all above $1 billion, there is still a significant difference in magnitude compared to the market values of USDT and USDC. It can be said that USDT is still the absolute “leader” among stablecoins.
In terms of trends, the total market value of stablecoins has decreased slightly by 0.87% from $130.363 billion a month ago, and has decreased by 6.22% from $137.792 billion at the beginning of this year, showing a downward trend overall. Moreover, the market values of most stablecoins, such as USDC, BUSD, and DAI, are also declining to varying degrees in the past month and year-to-date.
Among the stablecoins with larger market values, USDT, USDD, LUSD, and MAI have continued to rise against the trend. Among them, USDT has the largest market value and the most significant increase. According to statistics, the market value of USDT has increased by 1.41% from $82.052 billion a month ago, and has increased significantly by 25.63% from $66.237 billion at the beginning of this year.
According to the multi-chain composition of USDT based on data displayed on Tether’s official website [1], TRC-20 USDT (based on Tron) and ERC-20 USDT (based on Ethereum) currently have the highest total authorization amounts, approximately 46.12 billion USDT and 36.28 billion USDT, respectively, far exceeding the total authorization amounts issued on other public chains. Taking into account the authorized but unissued amounts, the actual issuances of TRC-20 USDT and ERC-20 USDT are 44.962 billion USDT and 36.199 billion USDT, respectively, accounting for 97.61% of the total actual issuances of USDT.

TRC-20 USDT and ERC-20 USDT almost account for the entire market value of USDT. From the market value changes of these two types of USDT, it can be seen that since the beginning of this year, the market values of TRC-20 USDT and ERC-20 USDT have been continuously rising. Among them, the market value of TRC-20 USDT has increased from 31.717 billion USDT to 42.79 billion USDT, an increase of approximately 34.90%, while the market value of ERC-20 USDT has increased from 27.996 billion USDT to 33.38 billion USDT, an increase of approximately 19.23%. In fact, since October 2022, the market value changes of these two types of USDT have begun to differentiate, and the growth trend of TRC-20 USDT is more significant, with a larger increment and a faster growth rate.
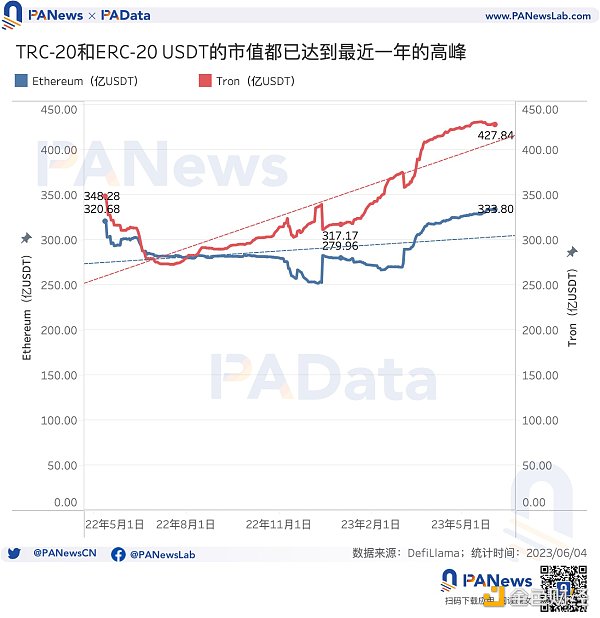
Recently, the market cap of USDT has returned to the high point in early May 2022. However, behind this lies changes in the internal composition pattern of USDT, and TRC-20 USDT has become increasingly dominant. This compositional change will play an important role in understanding the market reaction caused by changes in USDT’s market value, because there are some differences in the application scenarios between TRC-20 USDT and ERC-20 USDT.
Daily on-chain trading volume exceeds 6.9 billion USDT, exchange inventory rises, but trading volume falls
Where did the recently issued USDT flow to? From the perspective of underlying usage, the daily on-chain trading volume of TRC-20 USDT has shown a clear growth trend since the beginning of the year, increasing from 414,200 USDT to the current 711,400 USDT, an increase of about 71.76%, and the daily trading volume is about 9.37 billion USDT.
Since the beginning of the year, the daily on-chain trading volume of ERC-20 USDT has shown a slight downward trend, decreasing from 1.537 billion USDT to the current 1.541 billion USDT, a decrease of about 0.25%, and the daily trading volume is about 4.464 billion USDT. Overall, the daily on-chain trading volume of these two types of USDT is about 6.917 billion USDT.
Looking at the sub-markets, did the increase in on-chain trading volume occur in centralized exchanges, DeFi protocols, or other payment scenarios?
The data shows that since the beginning of the year, the inventory of ERC-20 USDT in exchanges has shown a clear upward trend, currently at about 9.29 billion USDT, the highest point this year, an increase of 34.62% from the lowest point this year of 6.901 billion USDT.
However, interestingly, while the inventory of ERC-20 USDT in exchanges has increased, the daily trading volume has shown a clear downward trend. The daily average trading volume of ERC-20 USDT this year is 74.2 million USDT. After April, the daily average trading volume of each month was lower than the annual average. The daily average trading volume of ERC-20 USDT this month is only 36.7 million USDT, a month-on-month decrease of 11.35%, and the month-on-month decrease in May was also 22.47%. Due to the impact of the stablecoin liquidity crisis in March, the month-on-month decrease in April was as high as 51.05%.
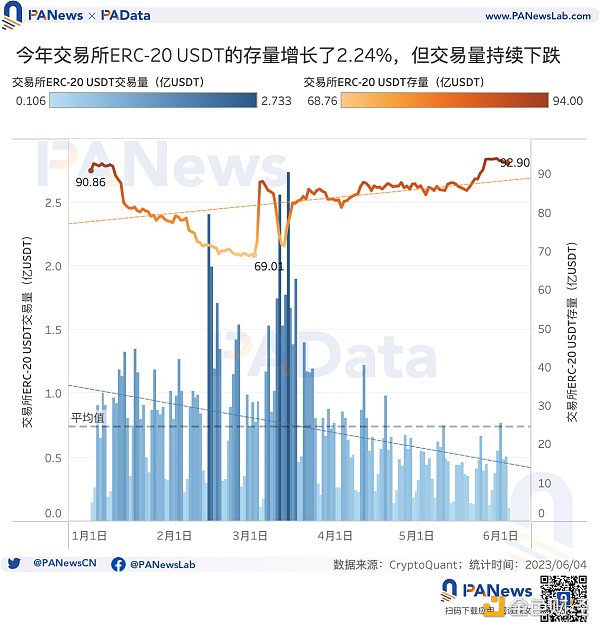
It can be seen that although there is more USDT in the exchange, it has not promoted trading in centralized market transactions, which may be one of the reasons why the market value of USDT has not been reflected in the coin price.
Looking at the amount of ERC-20 USDT locked in DeFi protocols, the inflow situation is also unclear. Overall, according to data from glassnode, the proportion of ERC-20 USDT locked in smart contracts currently accounts for about 15.03% of its circulation, which is equivalent to the level at the end of July 2022, and lower than the proportion at the beginning of May 2022 when the market value was similar (at that time, the proportion was about 20%). In other words, with the same market value, there is less USDT locked in smart contracts currently, which means that the size of USDT in DeFi may not be as large as before.
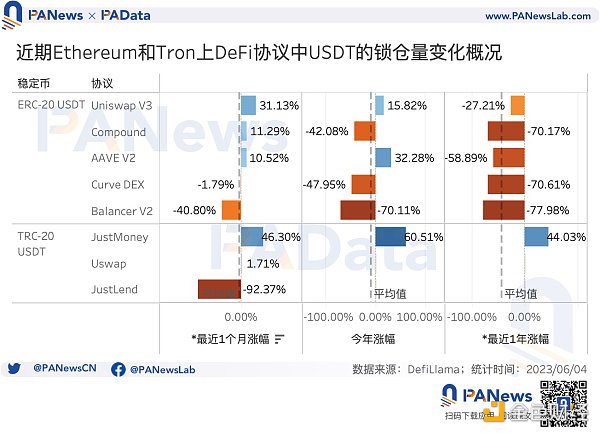
Looking at the recent changes in the amount of USDT locked in specific protocols, on Ethereum, the amount of USDT locked in Uniswap V3, Compound, and AAVE V2 has increased in the past month, with Uniswap V3 having the best growth rate, increasing by 31.13%, which is a significant increase. Compared with the beginning of this year, it has also increased by 15.82%. However, compared with last year, the amount of USDT locked in is still significantly lower. On Tron, JustMoney had the best growth rate, with the amount of USDT locked increasing by 46.30% in the past month, and the growth rate this year was 60.51%. The difference in the change in the amount of USDT locked in different protocols is significant.
Looking at data from multiple dimensions, some of the recently issued USDT has flowed into centralized exchanges, but it has not promoted actual trading, and trading volume has continued to decline. A small amount has flowed into DeFi protocols, but it has mainly flowed into a few top protocols, and the overall scale is still lower than when the market value was similar before. Another speculation is that the newly issued TRC-20 USDT may have flowed into other payment scenarios.
BTC price is stable with a slight increase, and the number of active USDT on-chain addresses has decreased more significantly
The overall market environment may also be a reason why the market value of USDT has not reflected in the coin price. On the one hand, many mainstream assets represented by BTC are currently in a sideways adjustment phase. Market data shows that although the BTC price has been on an upward trend since the beginning of the year, this trend is close to a “step” shape, and the platform building period is relatively long, and the daily average volatility of the coin price has weakened. In this situation, funds may choose to continue to observe. Reflected in the data, the exchange inventory has increased but the trading volume has decreased.
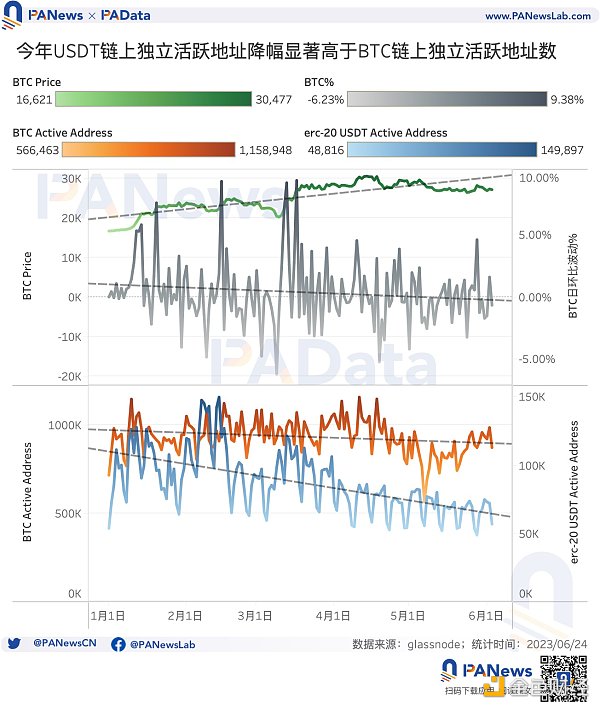
On the other hand, during the market consolidation phase, user activity has also decreased. The number of independent active addresses on-chain has always been a good window to observe the user scale. Judging from the trend of the number of independent active addresses on the BTC chain this year, it has remained basically stable, with a clear rebound after May, but it has not reached a new high for the year. Overall, the active user scale of BTC has not increased significantly.
In contrast, the number of independent active addresses on the ERC-20 USDT chain this year has shown a significant downward trend, currently about 56,800, a significant decrease from the highest daily independent active address number of 149,900 this year, and far from the daily independent active address number of 87,000 this year. This means that the active user scale of USDT is likely to have decreased.
Data Source: [1] DefiLlama, The Block, and Tether and other stablecoin market value data sources have certain statistical deviations in calculation methods, but there is no difference in magnitude between these data, which does not affect the observation of market trend changes.
We will continue to update Blocking; if you have any questions or suggestions, please contact us!
Was this article helpful?
93 out of 132 found this helpful
Related articles
- From Static to Dynamic: How NFTs are Changing Digital Ownership?
- What are the differences between the three stablecoin protocols based on Ethereum LST on the market?
- a16z Investments: dydx, Alongside, LayerZero…
- Blockchain game Illuvium to launch NFTs in collaboration with game retailer GameStop, on sale from June 12th.
- Why does the US SEC, which has clearly classified more than a dozen tokens as securities, continue to avoid addressing the status of ETH?
- Hourglass Finance: Providing Comprehensive Infrastructure for Time-Locked Tokens
- Understanding the Pros and Cons of FPGA and GPU Acceleration for Zero-Knowledge Proof Calculation