Viewpoint | Data visualization of stable currency DAI
This paper uses statistical methods to comprehensively analyze the stable currency DAI from the perspective of supply growth, asset liquidity, borrowing demand and price fluctuation. With data and charts, we observed patterns of behavior that Defi users spontaneously formed by system incentives.
DAI supply growth
The chart below shows that since the release in October 2017, DAI's token supply has continued to grow and is now approaching the 100 million mark. On March 19, 2019, DAI reached its maximum volume, hitting a peak of 95,451,247. At present, DAI's liquidity fluctuates around 84 million. (Translator's Note: As of November 14, 2019, the number of DAI circulation has reached 130 million.)
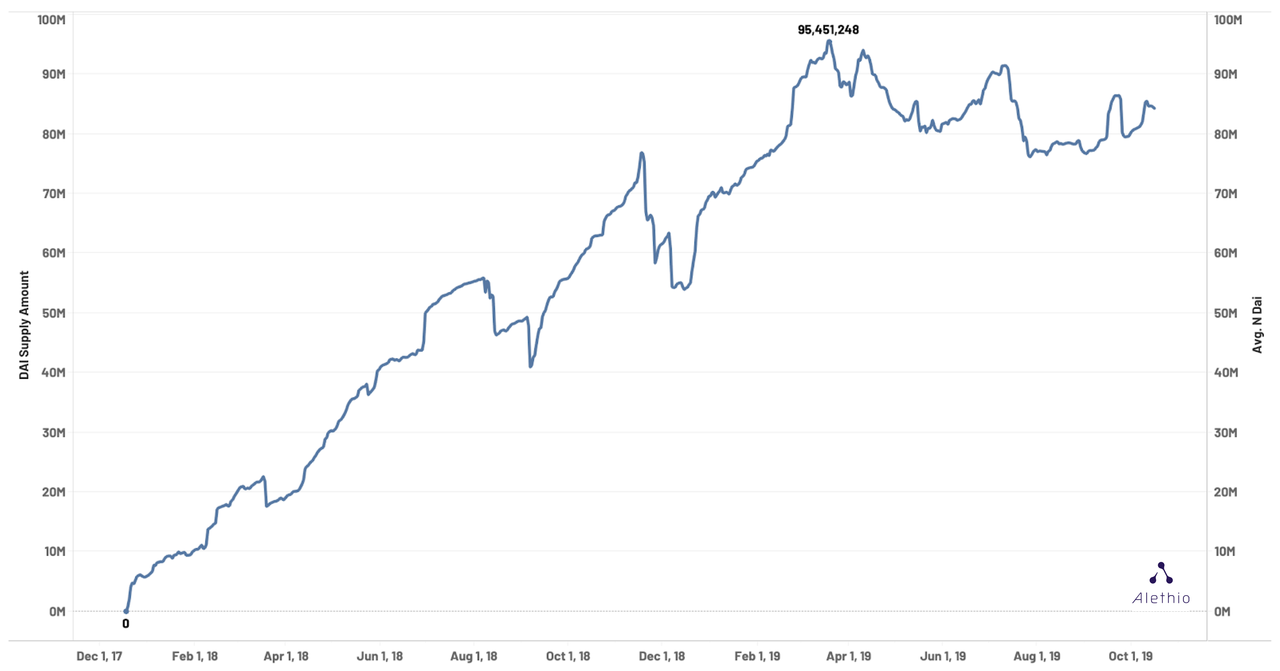
-Fig. DAI supply varies over time –
- Mosaic/Coinbase Joint Report: Development Status of Anonymous Coins
- Jianan listed plans to raise 100 million US dollars, the source: or due to the poor performance of the road show, the amount of funds raised
- The hacker group Anonymous announced the establishment of a $75 million Bitcoin fund to boost privacy technology and cryptocurrency development
At present, the largest holder of DAI is the Compound contract, which accounts for 17.11% of the total supply. The second largest holder is the dYdX contract, which accounts for 3.74% of the total supply (Translator's Note: Both are applications that provide lending services). Maker's own Eth2Dai contract ranks tenth on the list.
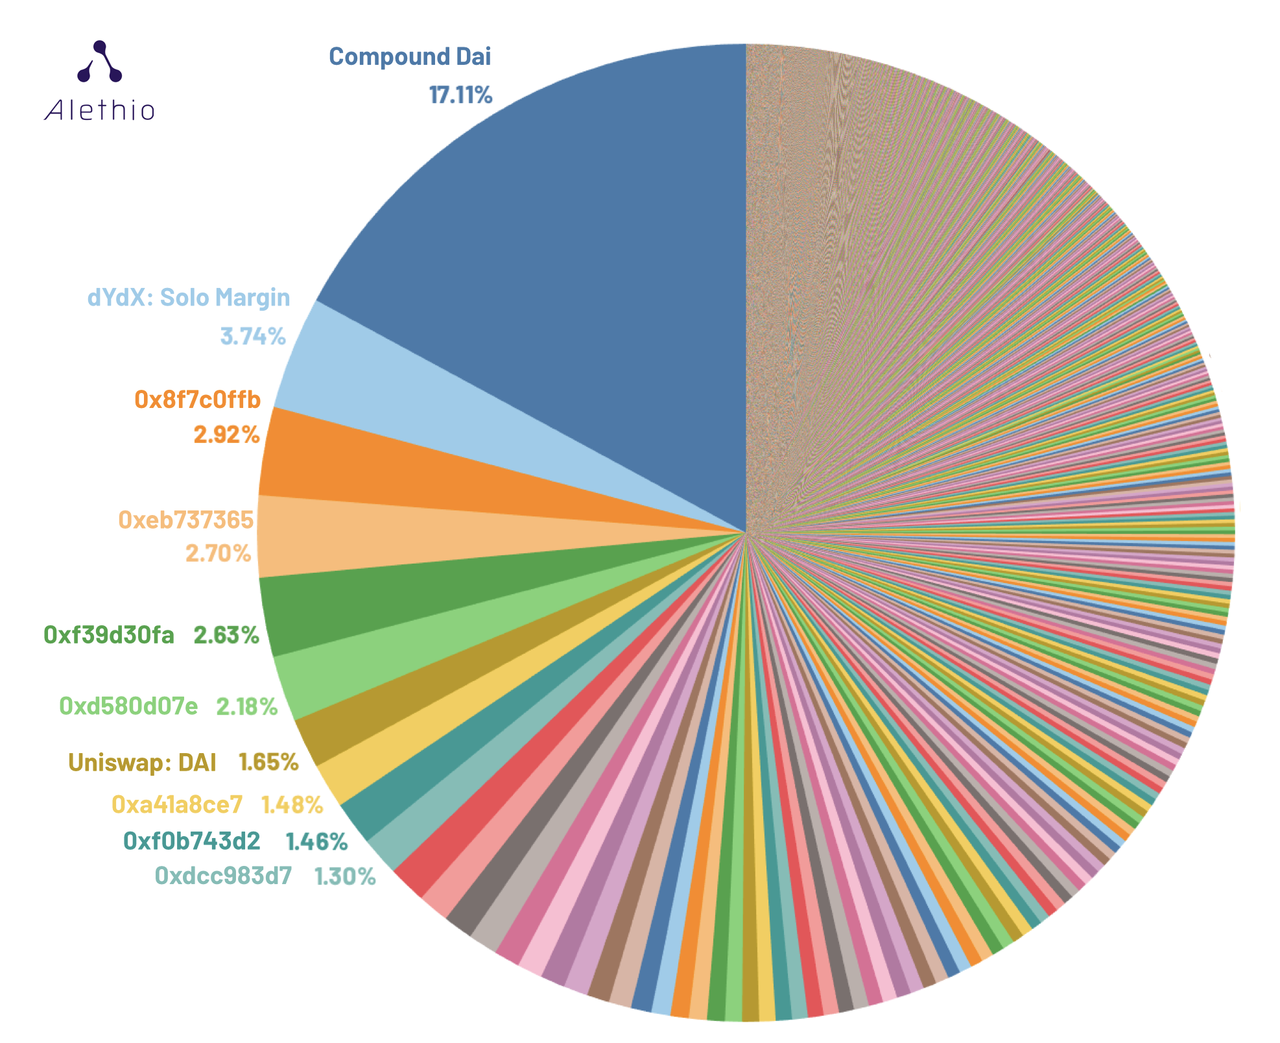
-Fig. Pie chart of all DAI holders –
The table below shows the top ten DAI whales and the total amount of DAI they hold:
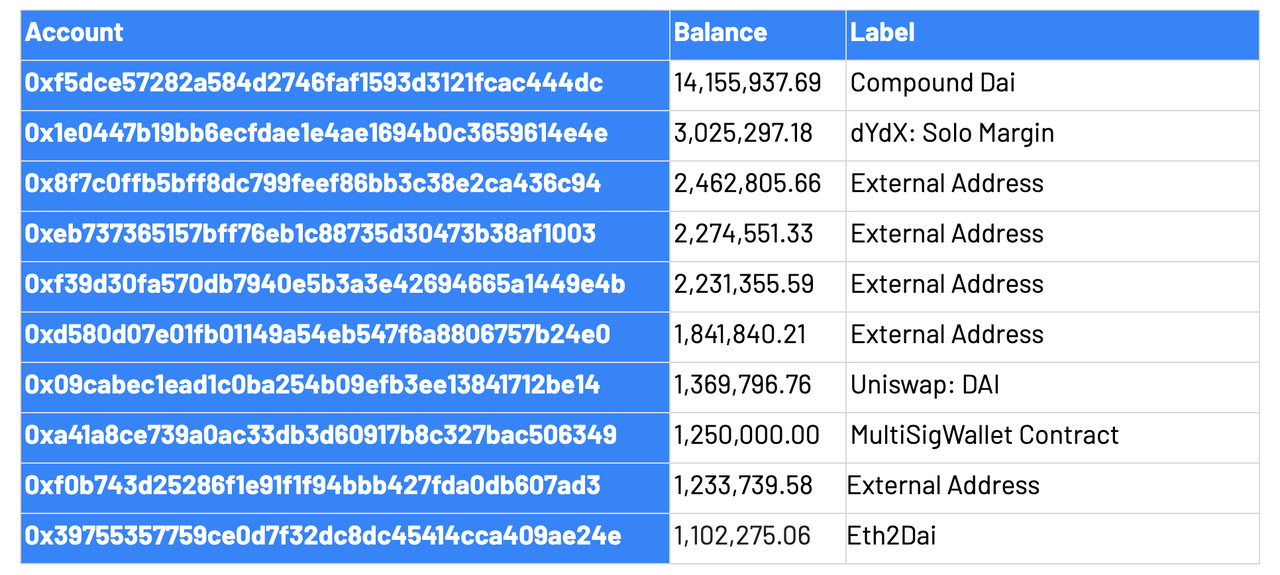
– Table – Top 10 DAI holders –
DAI utilization in each DeFi product
The chart below shows the daily borrowing of DAI on different lending platforms over the past 6 months:
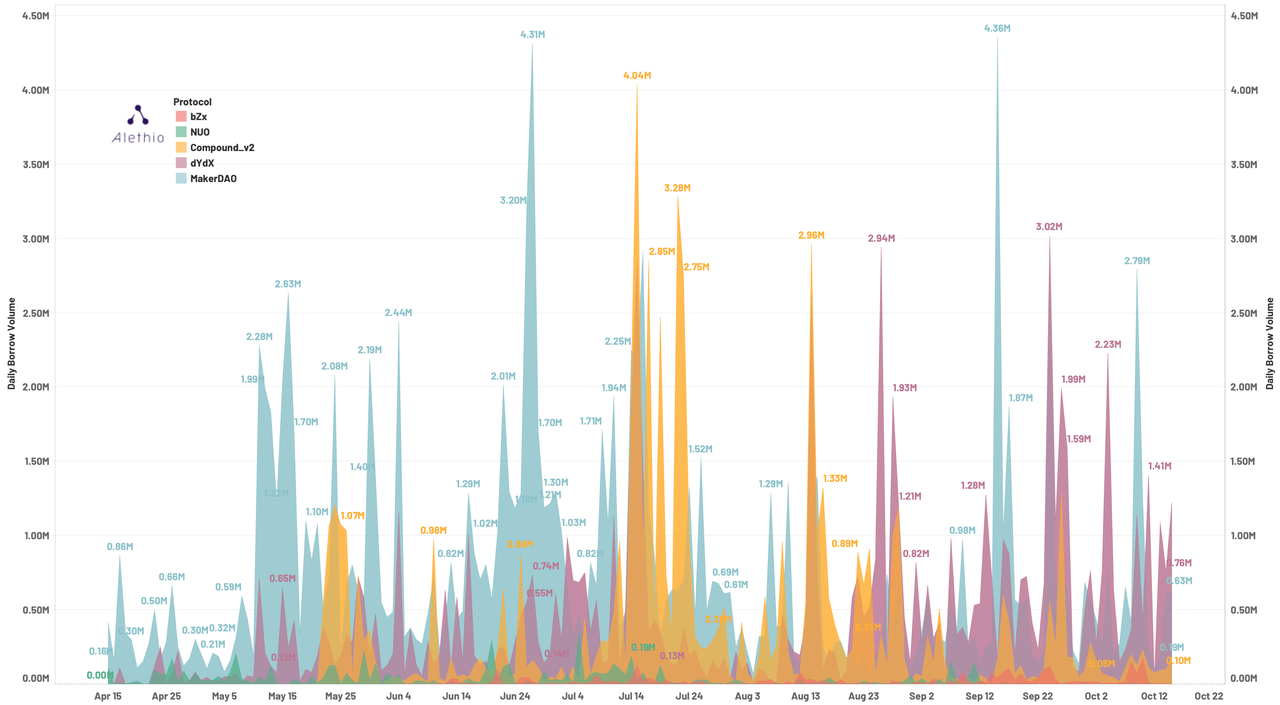
-Fig. Daily borrowing of DAI between platforms (last six months) –
Note that the above figure clearly distinguishes different applications by color and does not stack the quantities together. We can see MakerDAO as the blue zone, which dominated from beginning to end, reaching its highest point in late June and mid-September, reaching a sunrise borrow of about 4.3 million DAI.
In early May, Compound migrated its protocol to the new version, where we only reference the data for the Compound v2 protocol. As can be seen from the partition map, the orange area (Compound v2) has been alternated with the pink area (dYdX) to occupy the second place, each of which has reached a daily borrowing amount of about 3 million at the highest peak.
We can also see that NUO Network (green) and bZx (red) occupy an important position in the market. In the first quarter of the table, NUO Network released their new platform and quickly acquired a large volume of traffic. The borrowing volume of bZx has grown rapidly since June.
The chart below compares the monthly lending behavior between the DeFi projects mentioned above. Among them, dYdX's development of DAI lending has been remarkable for six months: we have collected data showing that DYdX's DAI lending has surpassed MakerDAO for the first time since October 17th since August. In October (as of the 17th), users of dYdX borrowed almost half of all mainstream lending platforms (~49.37%).
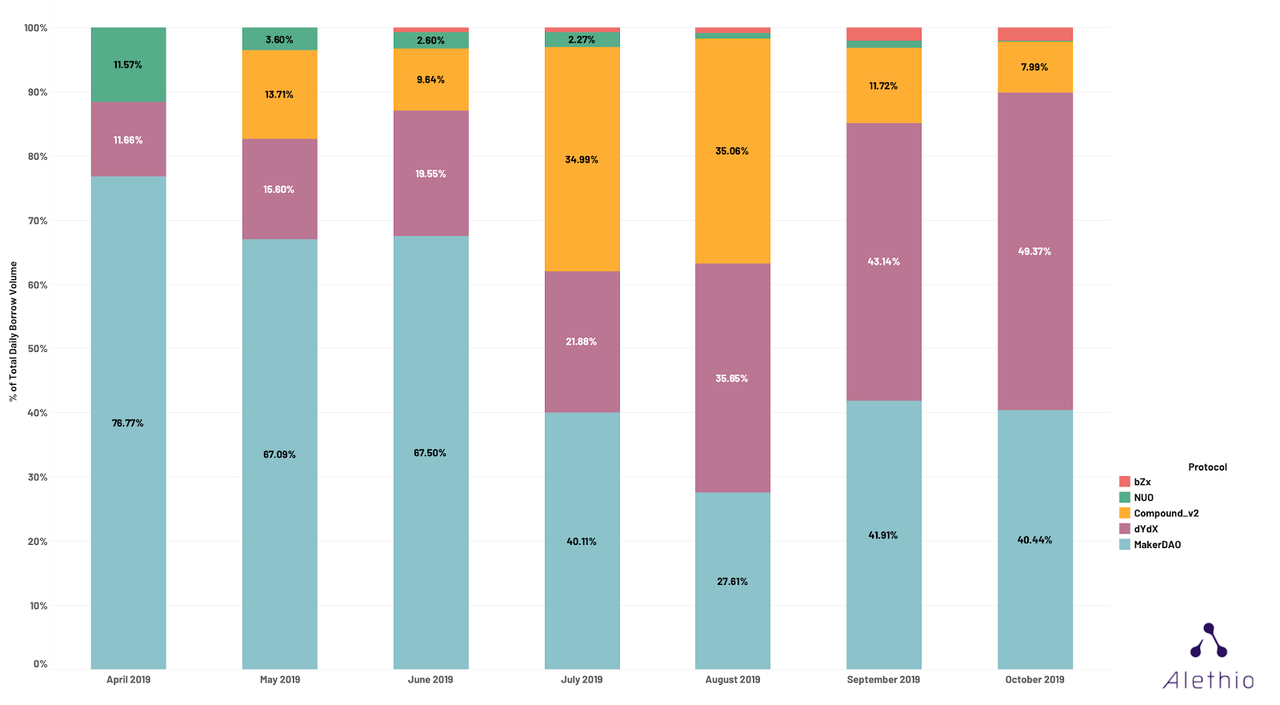
-Fig. The proportion of DAI lending market share of the main outflow platform (data from the past six months) –
DAI's mobility on each DEX
The chart below shows the daily trading activity of several major decentralized exchanges (DEX). It can be seen that OasisDEX is in a leading position, and the exchange is derived from the MakerDAO system. According to the monthly trading volume ranking, the second place is Uniswap, the third place is Kyber, followed by RadarRelay.

-Fig. Mainstream DEX's DAI trading volume market share (2019 data) –
Note that we do not list the 0x protocol here, because the 0x protocol is the underlying protocol of many relay classes DEX (such as RadarRelay, Paradex), and adding in the diagram will result in duplication of transaction volume. Most of the transaction volume of the 0x protocol is already reflected in the RadarRelay, and the shapes of the two are very close.
We used the same approach for dYdX because it directly used OasisDex's Eth2Dai as the exchange market. In order to avoid the total transaction volume ratio exceeding 100%, we included the trading volume of dYdX under OasisDex. The actual DAI volume on dYdX is between Uniswap and Kyber, reaching the highest point of monthly trading volume in June, about 17.9 million.
Overall, according to the above mentioned DEX transaction data, DAI's trading volume has been rising since the beginning of the year, reaching the highest monthly trading volume of 90 million DAI in July, and then squatting 50%.
By combing the above statistics, we can discover the autonomous life cycle of the DAI financial ecosystem. The trends and correlations of the various data in the time series below show how the DAI can be stabilized by the user's incentive to drive behavior :
“Dai adjusts the supply and demand relationship through economic incentives. When the price of Dai is higher than 1 US dollar, anyone can create Dai and sell it at a price that exceeds its original value. Thus, the supply of Dai on the market has increased, making it the price. Eventually fell back to $1.
Similarly, when Dai's price is less than $1, users can repay the account in the system at a cheaper rate. They buy Dai for less than $1 and then pay a fixed rate of 1 Dai$1. repay loan. Dai, which is used to pay off debts, will eventually be destroyed, causing Dai's supply to drop and prices to rise.
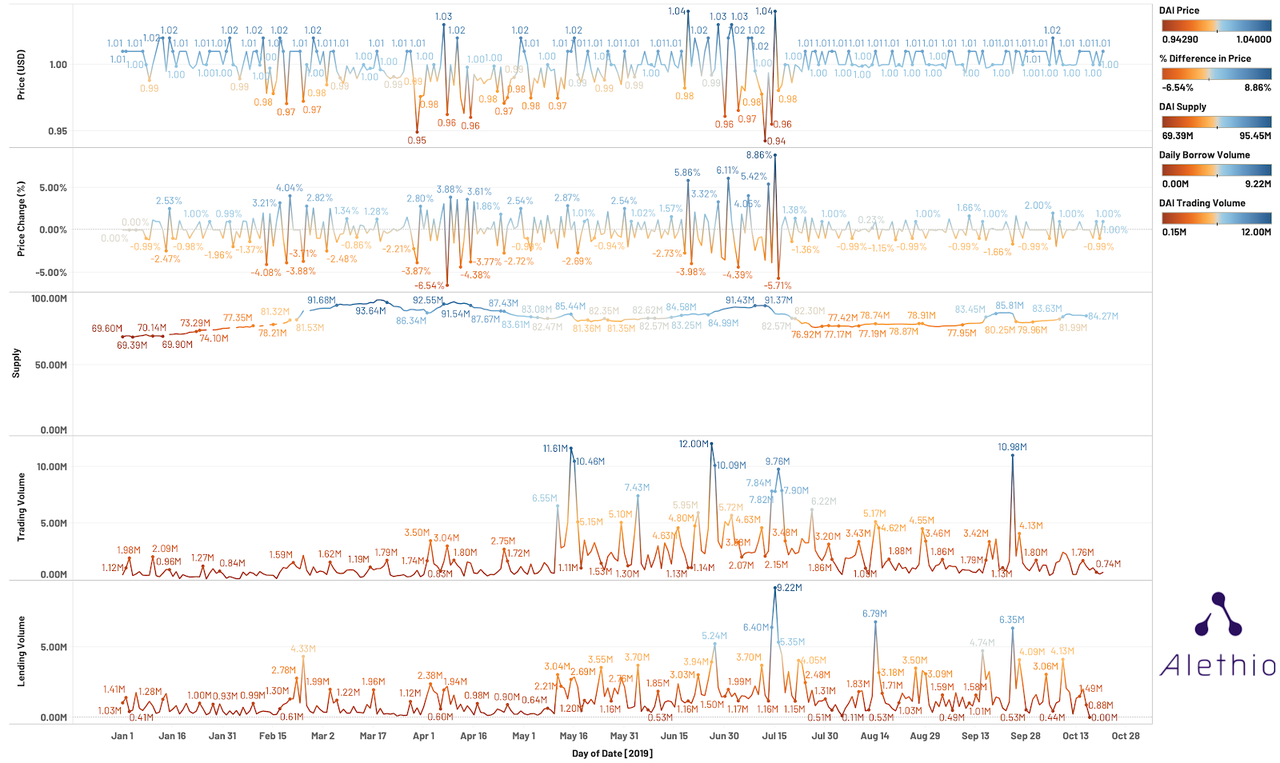
-Fig. 2019 DAI price comparison supply, transaction volume, loan amount (DAI price source is coinmarketcap.com) –
At the beginning of February, Dai's price began to fluctuate slightly (according to the first and second maps), potentially explaining the increase in borrowing/lending in the next few days (fifth image) – on February 24, DeFi The user borrowed 4.33 million DAI in one day, which caused the supply line to turn blue on the same day (the price increased and the supply increased); the cumulative DAI was generated on that day. The rapid increase in supply like this led to the depreciation of Dai in early April, and we can see a price drop of -6.54% from the table, potentially explaining the subsequent volume (fourth) and borrowing (fifth) Rise – When DAI depreciates, borrowers and traders can hold DAI at a lower cost (in US dollars).
It is difficult to deduce the causal relationship between these variable changes, they always interact with each other and cross-intervene throughout the economic system. However, it is certain that they have an in-phase resonance relationship and are closely related.
DAI price fluctuations – Is the stable currency really stable?
Above we can see that DAI prices are largely influenced by user behavior, so you may naturally ask a question: Is DAI really stable? We will then conduct a beta analysis to compare DAI with other stable currencies and assess their risk.
In the regression definition, a stable currency such as DAI is a digital currency that attempts to associate value with other assets. Stabilizing coins that are priced at $1.00 and anchored include DAI, TrueUSD, USDCoin, Tether, and Gemini Dollar. The chart below shows the price changes of several stable currencies over the past 12 months (data collected from CoinMarketCap):

-Fig. Price List & Volatility of price ratios of stable currencies over the past 12 months (Source: coinmarketcap.com) –
As can be seen from the table below, the average price of these stable currencies is around 1.00 USD, and the average value of DAI is closest to 1.00 USD. Their variance is not large, and the USDC has the smallest variance:

– Table – the mean and variance of the price (based on a 365-day window) –
In the above table we also added ETH and BTC statistics as a comparison of mainstream digital currencies. The variance was normalized by N-1 .
Compared to other currencies in the digital currency market, stable currencies should not have huge price fluctuations. Another measure to measure the price volatility of stable currencies is the beta analysis, which establishes a beta relationship with mainstream digital money markets (such as Bitcoin and Ethereum) and compares them. The table below shows the beta values established by several mainstream stable currencies with Bitcoin and Ethereum:

– Table – Stabilization currency vs. ETH/BTC beta coefficient (based on 365 day time window) –
The token has a beta coefficient value of 1 for itself. In the practice analysis of the stock market, this 1 is the critical value for assessing risk:
- When β > 1, it means that the stock is more volatile than the market benchmark (the stock market usually uses the SP500 index). This coefficient can also be interpreted as being more sensitive to changes in the market. For example, when the market heats up, this stock may be greatly affected, bringing higher returns to investors, and of course implying greater risks.
- When β = 1, both have the same volatility.
- When 0 < β < 1, this stock is not susceptible to market trends.
Usually the stock and the market have a positive correlation, ie the beta coefficient is usually a positive number. However, this value may also be negative. At this time, the price of the stock will rise as the market declines.
For the above five stable coins, we can see that the absolute values of their β coefficients are less than 0.1, which means they are more stable than ETH and BTC, and are less affected by the trend of the digital money market. In the appendix, we also attached a table to compare the beta coefficients of other mainstream currencies.
Among these stable coins, USDC and TUSD have the smallest β coefficient and have a negative correlation with Ethereum and Bitcoin, which means that when the market is unstable, these tokens act as “value stores”: when ETH When the price of /BTC rises, users tend to sell TUSD/USDC to enter the market; when the market turns to bear, the user will change the digital currency held by TUSD/USDC to protect their property from depreciation.
More from Alethio
Alethio's DeFi Smart Dashboard has been updated to accommodate more protocols and strategies. Our goal is to continuously expand this list of agreements and grow into a one-stop data platform – if you want to include your own DeFi products on our platform, please contact us!
Disclaimer: Alethio does not have any preference or bias for the above agreement. The number of agreements covered in this article is limited, and we will work hard to expand this list of agreements in the future to gain a more comprehensive view. Alethio solemnly promises to present facts and best judgments based solely on objective and/or validated information, and always maintains a neutral position. This article should not be used as a guide to any malicious conduct or trading strategy.
appendix
The mainstream currency is based on the beta coefficient of the 60-day time window in 2017:

– Table – Beta coefficient of other mainstream currencies against BTC (based on the 60-day time window since 2017-10-05) –
Original link: https://medium.com/alethio/statistics-around-dai-stablecoin-fb359d6881aa Author: Christian Seberino & Danning Sui translation & proofreading: Roger & A sword
(This article is from the EthFans of Ethereum fans, and it is strictly forbidden to reprint without the permission of the author.
We will continue to update Blocking; if you have any questions or suggestions, please contact us!
Was this article helpful?
93 out of 132 found this helpful
Related articles
- Viewing the Governance and Game Theory under the Chain from the Merchant Law in the Middle Ages
- The Swiss Stock Exchange is based on the XTZ-based ETP, and investors can get XTZ staking income.
- Morgan Creek CEO: Every asset in the world will be tokenized, selling Amazon stock to buy bitcoin
- Getting started with blockchain | 10 common misconceptions about blockchain and cryptocurrency
- Do not blow black, a quick overview of the 2019 cryptocurrency 10 development trend
- Last year’s battle, this year’s cold and clear, BCH upgraded this year?
- QKL123 Quote Analysis | Libra will replace Ethereum? Unable to help themselves! (1114)


