Bitcoin Price Prediction BTC Falls by 6%, Is the Worst Yet to Come?
Bitcoin Price Prediction BTC Falls by 6%, More Decline Expected?Author: Ali B., Cryptonews; Translation: Song Xue, LianGuai
In the volatile world of cryptocurrencies, despite the recent significant drop, Bitcoin still maintains its position as the most important digital asset.
As of today, the real-time price of Bitcoin hovers around $25,772, with a slight increase of about 0.25% in the past 24 hours. However, this small increase does not hide the 6% drop that cryptocurrencies have experienced in the past week.
Bitcoin’s 24-hour trading volume is as high as $12.3 billion, maintaining its top position in the CoinMarketCap ranking.
- 2023 Bitcoin Mining Industry In-Depth Report Halving Approaching, Miners’ Survival and Preparation
- Immovable Tencent Blockchain and the Advancing Web3 ‘Goose Factory Gang
- Reviewing my journey of making 10 million US dollars in the cryptocurrency market at the age of 22.
The real-time market value of the currency reached an impressive $502 million, with a circulating supply close to 19,478,418 BTC, close to the ultimate supply limit of 21,000,000 BTC tokens.
The worst time for Bitcoin has not yet come, but with Bitcoin’s brief plunge, investors and market analysts can’t help but wonder: Is the worst time for Bitcoin yet to come?
Bitcoin price prediction
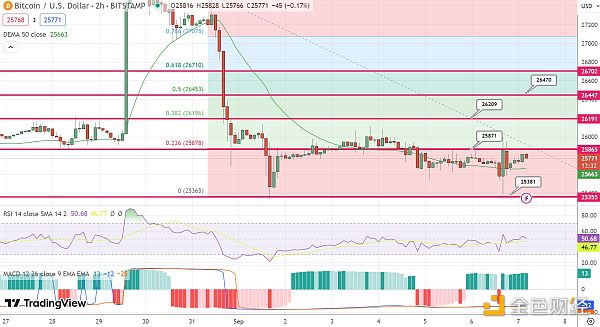
The price of Bitcoin is still in a consolidation phase, maintaining above the $25,500 mark. Although there is potential for corrective rises, any significant upward trend may face resistance near the $26,200 mark.
Previous attempts to break through the $26,000 resistance level were unsuccessful, and Bitcoin lacks the momentum to break through the range between $26,000 and $26,200.
After these failed attempts, cryptocurrencies experienced a bearish pullback, falling below the $25,650 mark. Nevertheless, resilient bulls held on to the support level of $25,350, allowing Bitcoin to recover above the $25,500 region.
Currently, its trading trajectory is below the $26,000 mark and the 100-hour simple moving average line. In addition, a significant bearish trendline has been identified, presenting resistance near $25,950 on the BTC/USD hourly chart.

Bitcoin price chart – Source: Tradingview
The immediate resistance hovers around the $26,000 area, parallel to the trendline and closely aligned with the 23.6% Fibonacci retracement level, which dropped significantly from the peak of $28,150 to the lowest point of $25,333.
The first significant resistance is at the $26,200 mark. If this resistance is clearly broken, it may pave the way for a price increase to $26,750, which is close to the 50% Fibonacci retracement level of the aforementioned major decline.
In addition, the $27,000 resistance level is imminent, and breaking through this resistance level may provide continuous upward opportunities for the bulls, possibly targeting the benchmark of $28,000.
However, if Bitcoin struggles to break through the resistance level of $26,000, a downward trend may occur. Immediate support is located around $25,500, followed closely by $25,350.
A decisive break below the latter could intensify selling pressure, potentially pushing the price towards around $24,500 or even as low as $24,000.
We will continue to update Blocking; if you have any questions or suggestions, please contact us!
Was this article helpful?
93 out of 132 found this helpful
Related articles
- Report Cryptocurrency Rich List Includes 22 Billionaires and 88,000 Millionaires
- Trading volume plummets nearly 97%, is Bitcoin’s ordinal NFT just a flash in the pan?
- How does the economics community view Bitcoin?
- Tracking Sentiment through Liquidity Pools? – Glassnode’s Latest Research Report
- Can DeFi maintain its usability beyond market narrative fluctuations?
- Glassnode Tracking Market Sentiment through Liquidity Pools
- In the context of high inflation and political unrest, Bitcoin has firmly taken root in Africa.


