6 Charts Reviewing Cryptocurrency Market Performance in Q2 2023
6 Charts on Cryptocurrency Market Performance in Q2 2023The original author: Sara Gherghelas, Dapprader; Translated by: BlockingNews
In the second quarter of 2023, the cryptocurrency industry continued to “hold firm” under regulatory pressures and market volatility, demonstrating strong market adaptability and resilience. This article will analyze the evolving industry landscape by examining six charts in depth.
1. Overview of the Dapp industry in Q2 2023
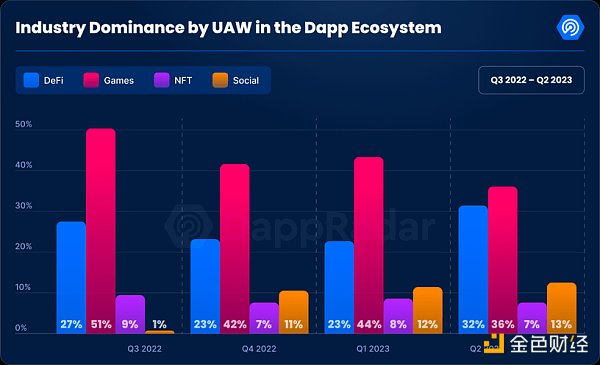
In Q2 2023, the number of daily unique active wallets (dUAW) interacting with on-chain Dapps increased by 7.97% compared to Q1, which may be interpreted as an encouraging sign of market recovery. Despite the widespread regulatory turbulence, the digital asset market is still thriving, and the growing level of market participation reflects this.
- Six Positioning Strategies in Current Financial Environment
- Market Trend Prediction and Potential Alpha: Inverse Finance and Symm
- Bitcoin engraved wallet UniSat Wallet will launch an NFT marketplace next week.
Above: Distribution of daily unique active wallets in Dapp ecology from Q3 2022 to Q2 2023
Games continue to dominate the Dapp field, accounting for 37% of the market share, but this is a decrease from the previous quarter’s dominance of 45%. It is worth noting that, driven by the Memecoin craze and L2 airdrops, DeFi is making a comeback, with its market share rising from 23% to 32%, showing signs of a resurgence in popularity. In addition, the market share of social Dapps has gradually increased, accounting for approximately 13% in the second quarter, an increase of 1% from the previous quarter. In contrast, the growth trajectory of the NFT industry seems to be slowing down, with its dominance dropping to 7%, a level similar to that of Q4 2022.
2. Overview of total locked value (TVL) in DeFi in Q2 2023
In Q2 2023, the total locked value (TVL) in DeFi decreased by 7.1% compared to the previous quarter, reaching approximately $77.6 billion. This decline in locked value is somewhat surprising compared to the expected growth trajectory of the DeFi market.
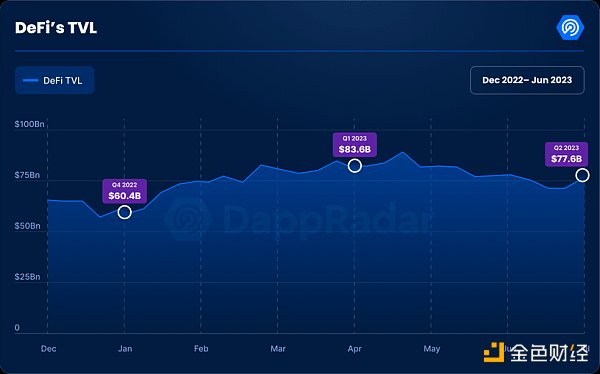
Above: Quarterly data on total locked value in DeFi
Looking at the total lock-up amount of the head blockchain of the Ethereum from the perspective of DeFi, Ethereum is still the leader, although the total lock-up amount of DeFi on the Ethereum chain has slightly decreased by 2% from the previous quarter. On the other hand, in early June, the US Securities and Exchange Commission sued Binance and claimed that Polygon (MATIC) was a security, which had a significant impact on the two major blockchains of BNB and Polygon. The total lock-up amount on the BNB chain decreased by 19%, which is the most severe contraction among all the surveyed blockchains. At the same time, the total lock-up amount on the Polygon chain fell by about 8%, further proving the huge impact brought by US regulatory agencies.
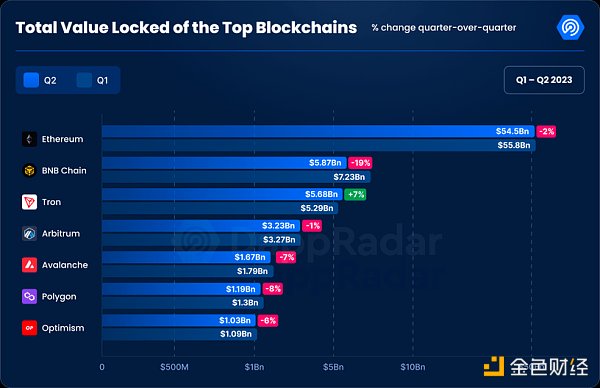
Above: Total lock-up amount of head blockchains in the second quarter of 2023
III. Overview of the NFT market in the second quarter of 2023
The recent trend of the NFT market is also reflected in the data. This quarter has shown a significant decline, with trading volume down 38% to about 2.9 billion U.S. dollars. In addition, the data also shows that the sales volume of NFT in the second quarter of 2023 was about 18.6 million, a decrease of 9.2% from the first quarter. It should be noted that there is not much correlation between trading volume and market excitement, and a decrease in trading volume does not necessarily indicate a weakening of market interest or activity.
Blur still maintains its dominant position in the NFT market, largely due to the incentive measures of the past BLUR airdrops. However, the second-quarter trading volume of the transaction aggregation platform still fell by 34% compared to the previous quarter. In contrast, the second-largest NFT market, OpenSea, was hit harder, with trading volume dropping by more than 56%. Not only that, the trading volume of CryptoPunks dropped by 47%. Surprisingly, the two NFT markets of Immutable X Marketplace and JPG Store have gone against the trend, with trading volumes increasing by 37% and 64%, respectively. It can be seen that even in the current challenging market environment, the prospects of some platforms are still optimistic.
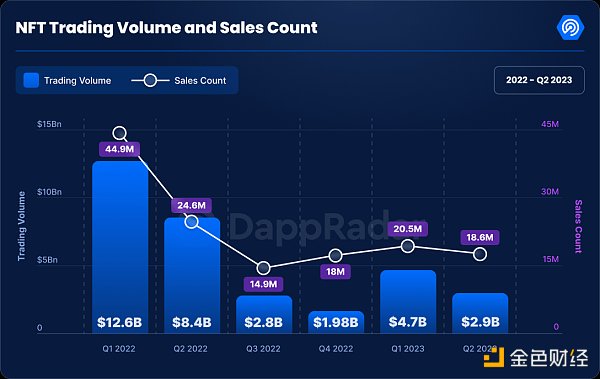
Above: Comparison of NFT transaction volume and sales volume from 2022 to the second quarter of 2023
4. Overview of Bitcoin Ordinals in Q2 2023
In the first half of 2023, the popularity of Bitcoin Ordinals has risen significantly, as evidenced by the significant increase in transaction volume. NFT sales from the Ordinals protocol skyrocketed from $7.18 million in Q1 2023 to $210.7 million in Q2 2023, representing a staggering quarter-on-quarter growth rate of 2834%. In addition, the historical trading volume and number of independent traders for Bitcoin Ordinals reached 554,215 and 150,969 respectively, highlighting the expanding coverage of the NFT protocol and increasing interest from new traders in digital assets on the Bitcoin chain.
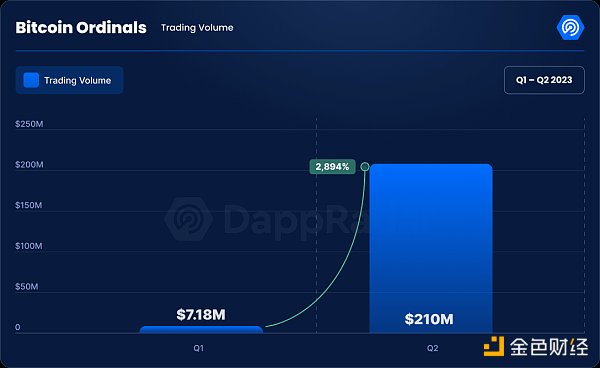
Above: NFT transaction volume for Bitcoin Ordinals in Q1 and Q2 2023
5. Overview of Hacks and Exploits in Q2 2023
In terms of hacks and exploits in the crypto market, there was some improvement in Q2 2023, with Dapp industry losses decreasing from $373 million in Q1 2023 to $206 million in Q2 2023, a decrease of approximately 45%. The most significant security vulnerability occurred on June 4 and June 28, 2023.
-
On June 4, Atomic Wallet was hacked, resulting in losses of up to $35 million.
-
On June 28, the Ackerman Ponzi scheme was exposed, resulting in victims losing over $33 million.
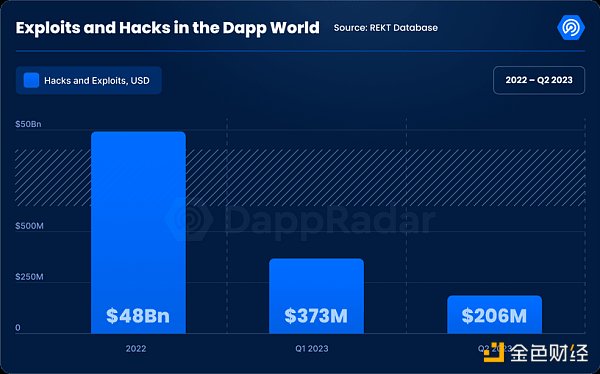
Above: Scale of losses from hacks and exploits in 2022, Q1 2023, and Q2 2023
Summary
The Q2 2023 data paints an interesting picture of the industry – blockchain and the crypto market are undergoing transformation amid regulatory pressure and volatility, while also demonstrating great resilience.
In the past quarter, more independent wallets have interacted with blockchain applications, with the average number of daily active independent wallets (dUAW) increasing by 7.97% compared to Q1, indicating that users are still actively participating in and adopting Dapps, with the gaming industry remaining dominant in the Dapp market. On the other hand, regulatory actions by the US Securities and Exchange Commission have had a significant impact on the lock-up volume of BNB and Polygon chains. At the same time, although NFT sales have decreased by 38%, the decrease in trading volume is not significant (only 9.2%), indicating that market interest and trading activity persist, and the rapid rise of the Bitcoin NFT protocol Original indicates increasing user interest in new digital assets. Even more encouragingly, losses from exploit attacks in the crypto industry have decreased significantly in Q2, indicating growing confidence in the security mechanisms of the crypto ecosystem.
In summary, Q2 2023 cryptocurrency market data shows that a vibrant industry is embracing and adapting to new challenges.
We will continue to update Blocking; if you have any questions or suggestions, please contact us!
Was this article helpful?
93 out of 132 found this helpful
Related articles
- Interpreting the data on the growth of the NFT market in 2023: Is it due to new funds entering or old funds circulating?
- Breaking down the past three Bitcoin cycles: Who will drive the next cycle?
- Breaking down the past three Bitcoin cycles: what will drive the next cycle?
- Analysis: Why did the cryptocurrency market fall today?
- Arthur Hayes: Bitcoin Will Become the Currency of Artificial Intelligence
- Arthur Hayes: Why Bitcoin Will Become the Preferred Currency of Artificial Intelligence?
- Has Inverse Finance successfully transitioned from CDP lending products to fixed-rate lending markets?


