Interpreting the data on the growth of the NFT market in 2023: Is it due to new funds entering or old funds circulating?
Analyzing NFT market growth in 2023: Is it from new or circulating funds?Authors: Helena L, Zixu H; Eocene Research
Translation: Node Lab
Through on-chain data analysis and address clustering algorithms, we studied the transaction volume and investment proportion of new and old address entities in the entire NFT market in 2023, as well as the sources of transaction and capital increments, in order to reveal whether the activity and new momentum in the NFT market mainly come from old players or new entrants from outside the market.
Since the end of June 2022, the NFT market has entered a bear market, but after Blur launched the Airdrop incentive mechanism at the end of 2022, the trading volume of the NFT market has improved (Figure 1). During Blur’s airdrop campaign, its contribution to the transaction volume of the entire NFT market continued to increase (Figure 1).
- Breaking down the past three Bitcoin cycles: Who will drive the next cycle?
- Breaking down the past three Bitcoin cycles: what will drive the next cycle?
- Analysis: Why did the cryptocurrency market fall today?
Figure 1: NFT daily transaction volume
The reward mechanism of Blur’s airdrop and the successful issuance of tokens are undoubtedly the biggest factors for the surge in NFT trading volume in 2023. However, behind the surge in trading volume, what is the real situation of the entire NFT market? In other words, is there actual incremental on-chain capital for NFTs, and are there new capital inflows into the market, or is it mainly the internal circulation of old capital?
We 1) investigated the sources of incremental transaction volume and capital for the entire NFT market in the second quarter compared to the first quarter; and 2) compared the transaction volume and investment proportion of different address entities in the entire NFT market during Blur’s first and second quarter airdrop campaigns.
Research Process
1. Obtain transaction volume data for each address
First, we selected the research time interval as time period A (October 19, 2022, to February 14, 2023) and time period B (February 15, 2023, to May 31, 2023)¹;
Second, we studied the transaction volume and capital from the perspective of buyers, because the focus of the research is on “the investment of NFT market participants in NFTs”;
Third, there are many participants in the NFT market during the research period, but the data shows that the top transaction volume addresses that contribute 90% of the transaction volume/capital volume of the entire NFT market only account for 8% of all addresses. Therefore, for ease of analysis, we defined the scope of the study as “the top transaction volume addresses that contribute 90% of the total transaction volume/capital volume in each time period,” thereby screening out a total of over 70,000 addresses;
Finally, we removed wash trades² to obtain the actual transaction volume and number of transactions for each address.
[1] Time period A corresponds to the Blur first quarter airdrop, and time period B corresponds to the Blur second quarter airdrop. February 14th, the day BLUR tokens were issued, was chosen as the boundary because the issuance of BLUR tokens clearly quickly boosted activity in the NFT market.
[2] Wash trade exclusion rule: buyer = seller, buyer and seller have a common EOA funding source.
2. Determine the amount of funds invested based on transaction volume and number of transactions
Based on the transaction volume and number of transactions for each address obtained earlier, calculate the amount invested by each buyer in the various token_ids of each NFT collection³;
Sum up all the invested amounts for each buyer to obtain the amount of funds invested in NFTs for each address.
[3] When token_standard=erc 721, each token_id corresponds to the same token, so the amount invested for each token_id is the average price paid for buying that token_id (average price = total payment amount / number of purchases); when token_standard=erc 1155, each token_id can correspond to multiple tokens, so we assume that the amount invested for each token_id is the total amount spent for buying that token_id.
3. Divide into different entities based on address clustering algorithm
Based on the logic of fund correlation, addresses that are highly likely to be controlled by the same entity are grouped together, and the sources of transaction volume and funds for the two periods of time are studied based on the entity dimension.
We define clustering based on the following criteria⁴: 1) there has been a transfer of ETH or stablecoins between addresses; 2) two addresses must have transferred to each other, where the number of transfers in one direction >= 3 and the number of transfers in the other direction >= 1; 3) only transactions between addresses in 2023 are restricted.
Using the algorithm to cluster addresses based on the above criteria, different address groups are obtained, and s 1 _ind and s 2 _ind are used to identify whether the addresses participated in NFT transactions during time periods A and B⁵. If at least one address with s 1 _ind=1 is included in the address group, the address group is an old entity; if all addresses in the address group have s 1 _ind = 0, the address group is a new entity.
[4] Our algorithm can identify direct or indirect relationships between wallets. “Direct” refers to interactions between two NFT players that meet the standard. When multiple NFT players have interacted with the same address (whether or not that address is within the scope of analysis) and the interactions meet the above criteria, these NFT players form an “indirect” link.
[ 5 ] If s 1 _ind= 1 and s 2 _ind= 1, it means that the address participated in NFT transactions in both time periods; if s 1 _ind= 1 and s 2 _ind=0, it means that the address only participated in NFT transactions in time period A; if s 1 _ind=0 and s 2 _ind= 1, it means that the address only participated in NFT transactions in time period B.
Research Results and Analysis
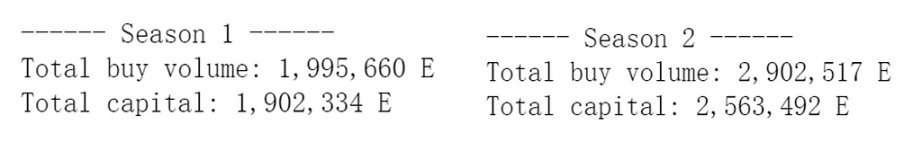
1. Data results⁶ (buy volume is “transaction volume,” capital is “funds”; Season 1 corresponds to time period A, and Season 2 corresponds to time period B)
1.1) Transaction volume and capital for each time period:
 Transaction volume and capital for time periods A and B
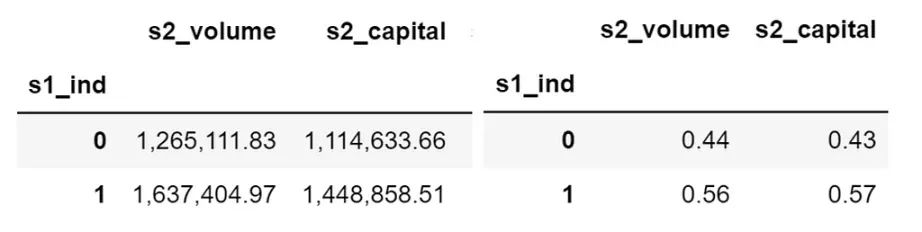
1.2) Transaction volume and capital for new and old addresses⁷ in time period B (left in ETH units, right is percentage):
 Transaction volume and capital for new and old addresses in time period B
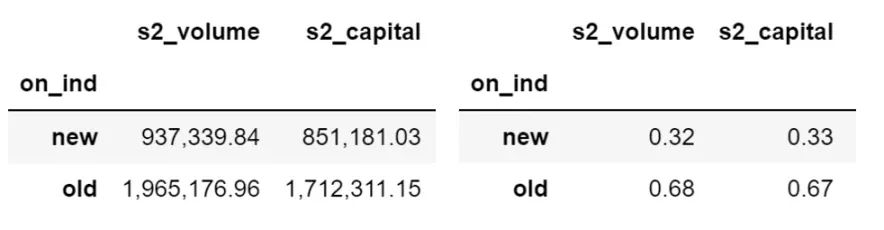
1.3) Transaction volume and capital for new and old entities⁸ in time period B (left in ETH units, right is percentage):
 Transaction volume and capital for new and old entities in time period B
[ 6 ] The separate outputs of “transaction volume and capital in time period B” from the perspective of addresses and entities are to compensate for the potential defects of address clustering (such as incorrectly classifying some new entity addresses into old entities, resulting in a virtual increase in the transaction and capital amounts of old entities), so as to obtain a baseline for the data.
[ 7 ] If s 1 _ind= 1, it is an old address; if s 1 _ind=0, it is a new address.
[ 8 ] If on_ind=old, it is an old entity; if on_ind=new, it is a new entity.
2. Result analysis
2.1) Growth of NFT on-chain funds The total transaction volume and capital for time period B are both greater than those for time period A, and the absolute values of the transaction volume and capital increment are 906, 857 ETH and 661, 159 ETH, respectively. Both the transaction volume and capital show an upward trend, indicating that the NFT market is growing overall.
2.2) Sources of new funds The capital increment is smaller than the capital of new entities in time period B (661, 159 ETH vs 851, 181 ETH), so the new funds mainly come from the new entities, and at least some of the capital invested by old entities in the NFT market is shrinking.
2.3) The proportion of trading volume and funds between old and new entities
Comprehensive data on trading volume and funds from the perspective of addresses and entities in Time Period B. The proportion of trading volume and funds of old entities is roughly between 55% and 70%.
The proportion of trading volume and funds of old entities in Time Period B is both over 50%, indicating that old entities are the main contributors to the activity of the NFT market;
However, it should be noted that there is no significant difference in the proportion of old and new entities. Therefore, we believe that the contribution of new entities to the NFT market cannot be ignored.
Conclusion
Through the study of the proportion of trading volume and investment funds between old and new entities in the NFT market (the proportion of old entities is about 60%), as well as the source of trading and fund increments (mainly from new entities), we believe that old players (old entities) are the main contributors to the activity of the NFT market, while new entrants (new entities) outside the market are the source of new momentum for the NFT market.
It should be noted that the increase in funds and new players entering the market does not necessarily mean that the NFT market is booming. This is because most of the increments are concentrated on Blur, which is highly likely to be attracted by token rewards rather than the value of NFT itself. As for how to maintain the long-term prosperity of the NFT market after the airdrop, it is still a major challenge faced by the market as a whole.
We will continue to update Blocking; if you have any questions or suggestions, please contact us!
Was this article helpful?
93 out of 132 found this helpful
Related articles
- Arthur Hayes: Bitcoin Will Become the Currency of Artificial Intelligence
- Arthur Hayes: Why Bitcoin Will Become the Preferred Currency of Artificial Intelligence?
- Has Inverse Finance successfully transitioned from CDP lending products to fixed-rate lending markets?
- “Fortune” interview with Sister Wood: Will ARK win the first Bitcoin spot ETF?
- Lightning Labs launches AI Bitcoin tool that enables sending Bitcoin on the Lightning Network
- What is Bitcoin Recursive Mnemonic?
- How is the market searching for logic in the old-school DeFi as COMP and MKR continue to rise in recent days?


