Multi-dimensional analysis of NFT in the second quarter: Multi-chain competition intensifies outside of Ethereum, and Blur’s growth rate far outstrips its competitors.
NFT analysis in Q2: Multi-chain competition increases, Blur grows fastest.Author: Nancy, BlockingNews
After a good start in 2023, the NFT market did not see a reversal in the second quarter, and even experienced a “collapse wave”. Looking back on the second quarter, the development environment of NFT became more depressed and changeable, and challenges were everywhere. Recently, BlockingNews analyzed the core data of the second quarter, allowing users to perceive the development trend and temperature of the NFT market from multiple dimensions. The data in this article is provided by NFT data service provider NFTScan.
Key summary:
1. The total transaction volume of the NFT market in the second quarter exceeded 66.5 billion U.S. dollars. Although Ethereum has an absolute advantage with a market share of as high as 96.7%, it has declined compared with Q1. In contrast, Solana, Polygon, and BNB Chain maintain a growth momentum;
- False exit, true entry: SEGA is raising the banner in the Web3 blockchain gaming arena
- How to stake on the EigenLayer mainnet
- Aptos proposal “Gradual Upgrade of Mainnet Framework to v1.5.0” has opened for voting, which will introduce a new standard for creating replaceable assets.
2. A total of more than 1.077 million NFT projects were launched in a single quarter in the NFT market. BNB Chain launched as many as 417,000 new projects this quarter, which is 9.5 times that of the first quarter. At the same time, from the daily average number of new projects, Solana has grown by more than 1074.8% from the previous quarter, while Ethereum is in a negative growth trend;
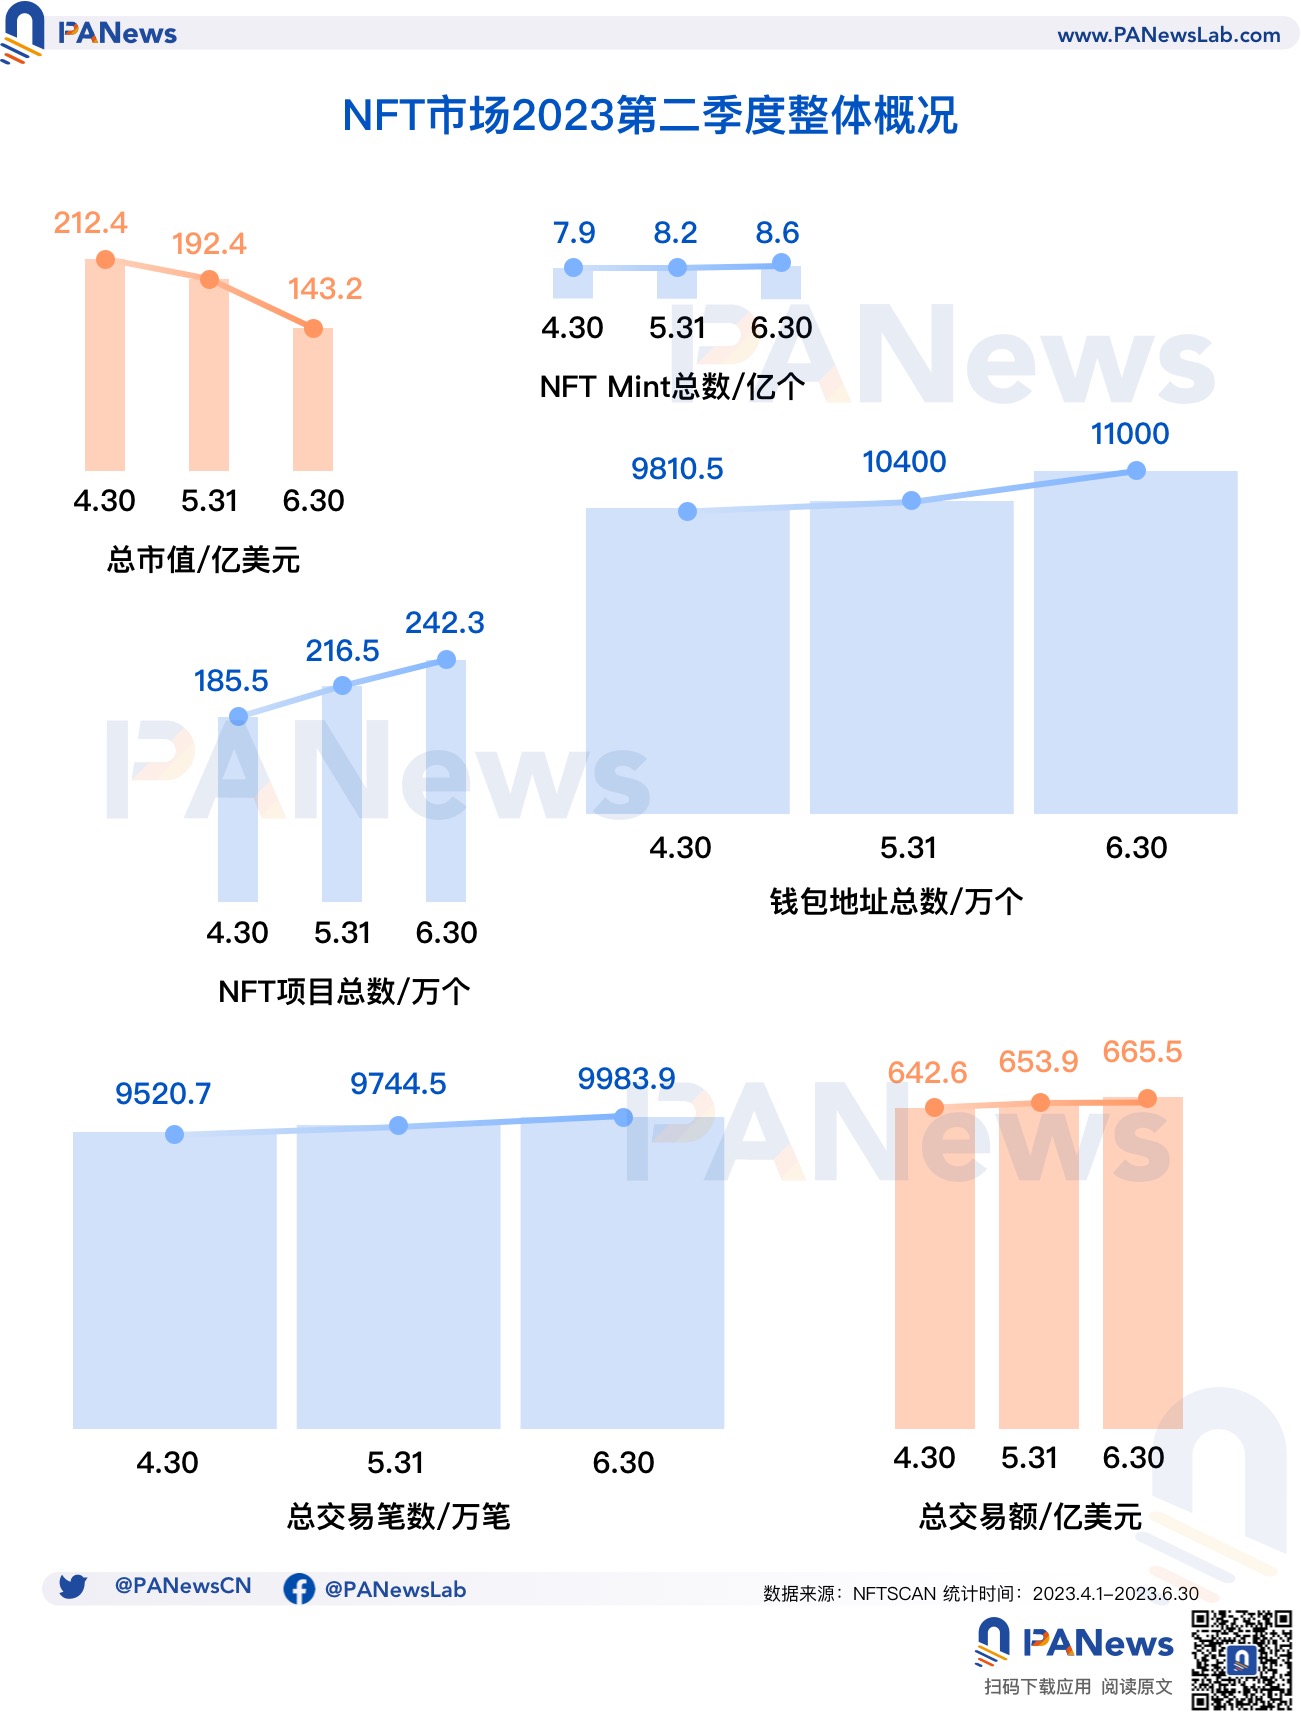
3. The total number of NFT wallet addresses in the second quarter exceeded 18.984 million, an increase of only 1.794 million from Q1, and the average holding assets decreased by about 33.1%. The growth rate of BNB Chain address is about 49.8%, while Ethereum and Solana are in a negative growth trend;
4. In Q2, the NFT market cast more than 110 million NFT assets. Among them, Polygon and BNB Chain added the most new assets, and the cumulative newly cast NFTs accounted for 68.9% of the total, and only BNB Chain achieved a positive growth in daily casting volume;
5. Compared with the first quarter, the market value and average price of blue-chip NFTs this quarter were quite weak, facing the pressure of capital outflow, but some still showed high market popularity;
6. OpenSea is still the absolute monopolist in the market, but its various data only achieved single-digit growth in the second quarter, while Blur’s growth in transaction volume, sales volume, and number of users far exceeded the average level.
The growth rate in the second quarter has slowed down, and Polygon continues its strong momentum from the previous quarter

By the end of the second quarter of 2023, the total transaction volume of the NFT market had reached 66.55 billion U.S. dollars, an increase of more than 10.9% compared with Q1. Looking at the overall market pattern, Ethereum, Solana, Polygon, and BNB Chain jointly occupy about 99.6% of the market share in the second quarter. Among them, Ethereum’s total transaction volume has increased compared with Q1, reaching 64.38 billion U.S. dollars. Although its market share is as high as 96.7%, it has declined by about 0.6% compared to the first quarter. The second is Solana’s transaction volume of about 1.04 billion U.S. dollars, which has increased by about 11.3% from the previous quarter, accounting for nearly 1.6% of the market share; followed by Polygon and BNB Chain, the market share totals more than 1.3%, and Polygon’s transaction volume has doubled compared with Q1, especially in May, accounting for 62.7% of its total growth in Q2. BNB Chain only increased by about 3.2% compared with Q1.
Moreover, looking at the amount of re-minting, more than 110 million NFT assets were minted this season, with a growth rate of over 15.1%, and a daily average of 1.264 million new mintings. Among them, Polygon ranked first with more than 55.571 million mintings, accounting for 50.5% of the total, a decrease from the previous season, with a daily average of 617,000 mintings; followed by BNB Chain, with a new minting of over 20.342 million, accounting for approximately 18.4% of the total, an increase of 24.8% from the previous quarter, and a daily average of nearly 226,000 mintings; Ethereum and Solana had minted 9.179 million and 2.488 million assets, respectively, with daily average mintings dropping by over 31.1% and 40%, respectively, from the previous quarter.
Blue-chip NFTs witness capital outflow, who are the big gas consumers on Ethereum?
As the leading trend and heat of the NFT market, blue-chip NFTs continue to face continuous price declines and accelerated community consensus loss this season, and many blue-chip projects have to some extent dragged down the market performance of the entire NFT market in the second quarter. In particular, the release of Azuki’s new work, Azuki Elemental, not only attracted community criticism, but also dealt a heavy blow to the confidence of the NFT market.

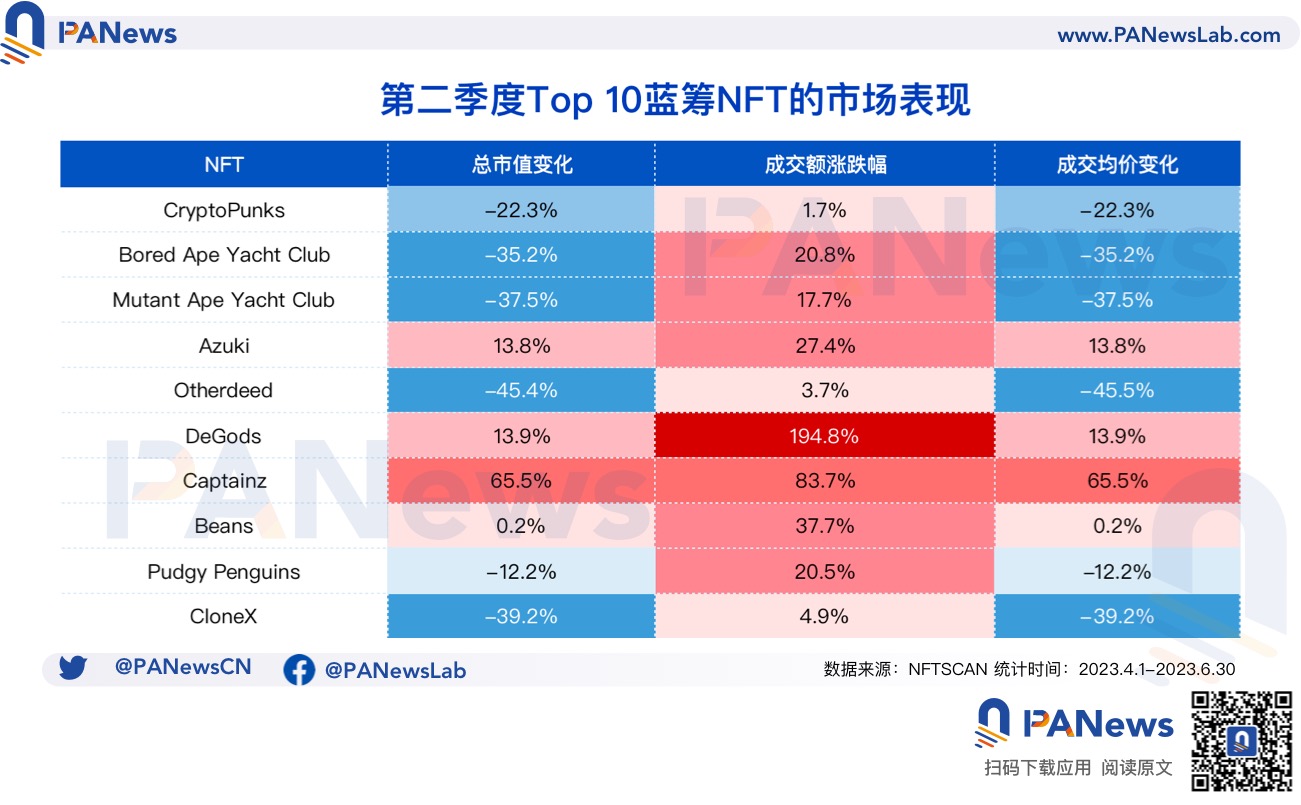
Looking at the market performance of the top 10 representative projects on Ethereum in the second quarter, these blue-chip projects saw an overall average market cap decline of 9.8% compared to the end of the first quarter. Among them, the market caps of CryptoPunks, BAYC series, and CloneX experienced large declines, with an average decrease of 35.9%. Captainz and DeGods performed relatively well overall, while Azuki and Beans performed better than many blue-chip projects because the Elemental presale qualification was offered to holders of these two series.
Looking at the transaction volume of the top projects, although the overall transaction volume this season showed a growth trend compared to the first quarter, increasing by about 41.3%, it was mainly due to the surge in DeGods and Captainz, especially DeGods, which attracted a higher market popularity and saw a rise of over 195.8% in transaction volume. At the same time, compared to the previous quarter, most blue-chip NFTs faced capital outflows in addition to continuous weak trading volumes, with an overall average transaction price decline of about 9.9%, with CryptoPunks, BAYC series, CloneX, and Pudgy Penguins experiencing declines higher than the average.

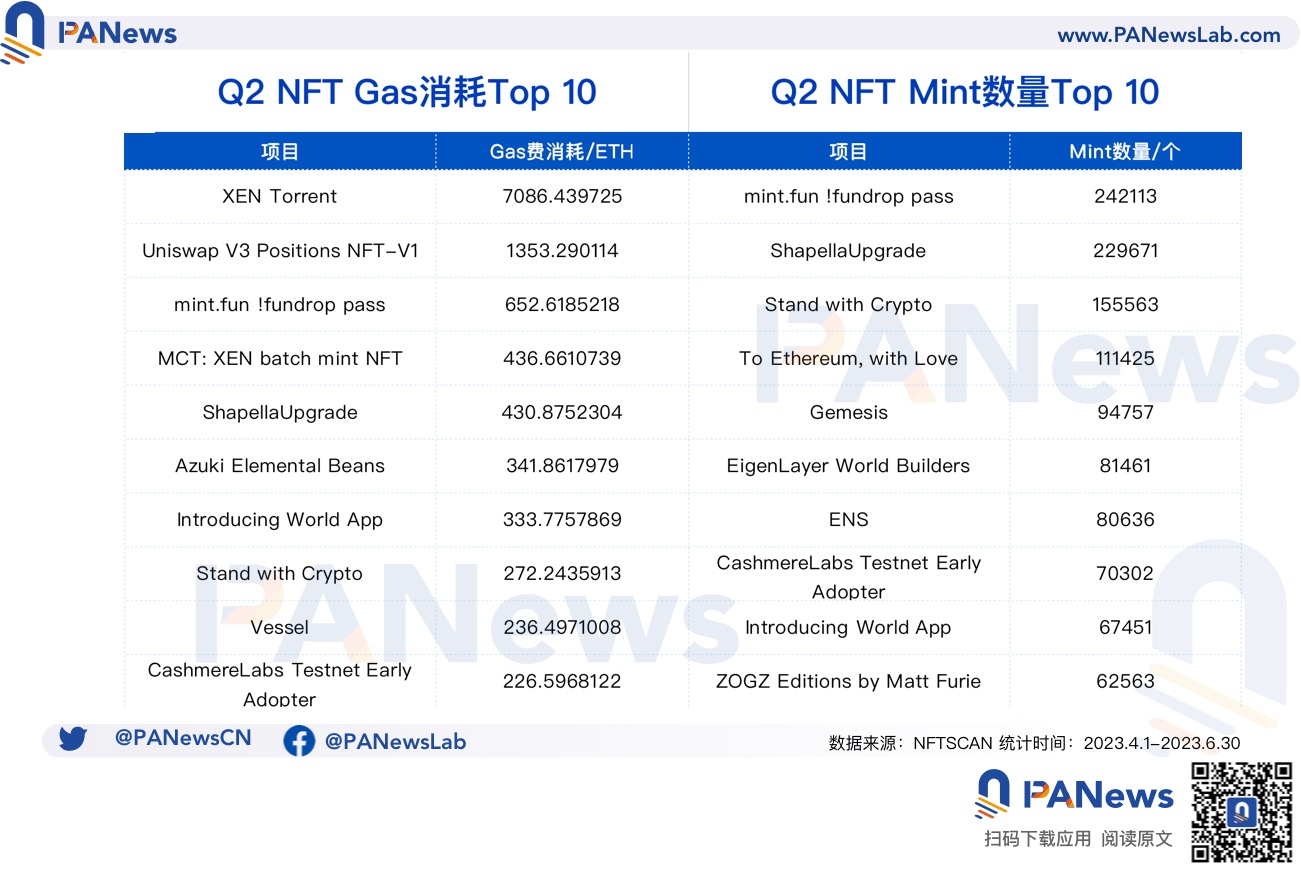
Meanwhile, gas consumption is one of the “touchstones” for judging whether an application is active. The top 10 NFT “big players” in terms of gas consumption in the second quarter consumed more than 11,000 ETH, with XEN Torrent and Uniswap V3 Positions NFT-V1 as the main contributors, accounting for about 74.2% of the total, of which XEN Torrent’s gas consumption was the highest, about 2.3 times higher than the previous quarter.
In addition, the project’s minting volume also to some extent captures user preferences and emotional opportunities. The top 10 NFT projects in terms of Ethereum minting volume minted more than 1.195 million NFTs in the second quarter, down 12% from Q1. Among them, mint.fun !fundrop Blockingss, ShapellaUpgrade, and Stand with Crypto minted more than 627,000 NFTs in total.
Overall slowdown in the development of trading platforms, Blur still maintains a relatively high growth rate
As the market competition becomes increasingly fierce, major NFT trading markets are beginning to build competitive narratives around royalty reform, airdrop incentives, diversified functions, and the implementation of multi-chain markets. Perhaps the changes in the NFT market can be more directly perceived from the data of the six major trading markets.

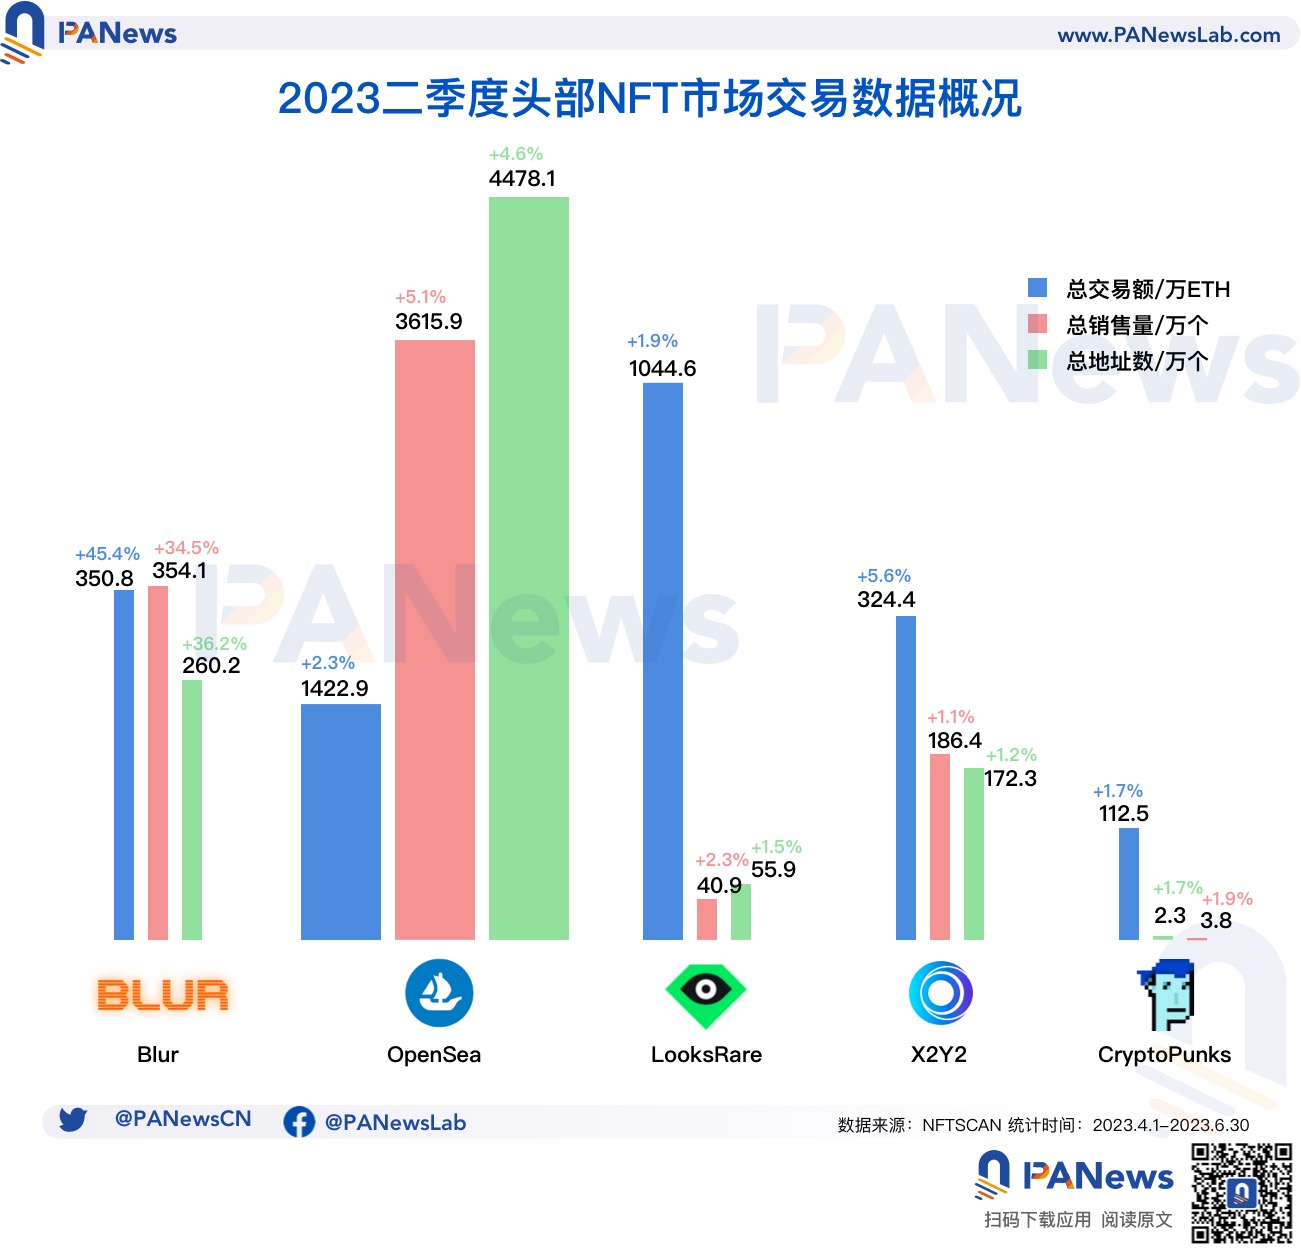
In terms of total transaction volume, the six major trading platforms in the second quarter had a cumulative transaction volume of about 32.554 million ETH, an increase of only about 5.9% from the previous quarter. Among them, Blur’s transaction volume still ranked first with more than 35.083 million ETH, achieving a growth rate of 45.4%, mainly due to the platform’s opening of second-quarter airdrops, opening of the Blend lending market, and other reasons; OpenSea, LooksRare, and X2Y2 followed closely with 14.229 million ETH, 10.446 million ETH, and 3.244 million ETH respectively, but these platforms only achieved single-digit growth in the second quarter.
Meanwhile, although the overall sales volume of various NFT markets in the second quarter reached 41.998 million, the growth rate was slow, up only 6.8% from the previous quarter, with an average daily sales volume of about 30,000. Among them, OpenSea’s sales volume of 36.159 million became the absolute monopolist of the market, accounting for 86% of the total, but the growth rate was lower than the overall growth rate, up only 5%, and the daily average sales volume was 19,000; Blur’s sales volume of 3.541 million grew at a rate of 34.5%, far higher than that of other platforms, with a daily average sales volume of 10,100; while LooksRare, X2Y2, and CryptoPunks accounted for only 5.4% of the total sales volume, with a daily average sales volume only a fraction of OpenSea’s.
Similarly, the user base of the trading market in the second quarter did not show significant growth, with only 2.697 million new users added, and an average of only about 2.9 new addresses added per day. Among them, OpenSea added 1.975 million addresses, accounting for 73.2% of the total new addresses, with an average of nearly 22,000 new addresses per day; Blur added 692,000 addresses, with a growth rate of 36.2%, and an average of 7,695.7 new addresses per day; LooksRare, X2Y2, and CryptoPunks lag behind the average in terms of the number of new addresses added, and all achieved only single-digit growth.
We will continue to update Blocking; if you have any questions or suggestions, please contact us!
Was this article helpful?
93 out of 132 found this helpful
Related articles
- Regulatory Pressure Slows Down Capital Inflow, Ethereum’s Collateralization Rate Approaching a Key Milestone
- AlloyX: A liquidity collateral protocol based on RWA assets
- NFT lending protocol Gondi, developed by Florida Street, has completed a $5.3 million seed round of financing, led by Hack.vc and Foundation Capital.
- Injective, the pioneer of native chain order book.
- Bored Ape suffers from losses and is forced to sell, aristocratic holders become big losers
- Cross-chain vs Multi-chain
- Arkham Product Performance, Financing Status, and Investor Expectations


