Observation | The total amount of USDT in Ethereum is close to the Bitcoin network, and the revenue of Bitcoin miners exceeds US$15 billion.
This article is for cryptocurrency market data observation. Through the data, we will be able to find some very important things. For example, USDT continues to move from the Bitcoin network to the Ethereum network. The two networks are now basically flat, and it is likely to continue to Ethereum. Network transfer.
The recent Ethereum network transaction cost twice exceeded the Bitcoin network transaction fee, showing the prosperity of the Ethereum network, which proves the health of the Ethereum network and is one of the proofs of the Ethereum network value capture capability. The Bitcoin network shows its own expensive data. The total transaction cost of the Bitcoin network has reached nearly $1 billion as of October 6, and the mining revenue is about to exceed $15 billion. This article will use data to tell you some important data in the encryption market to better understand the encryption market.
First, the data summary
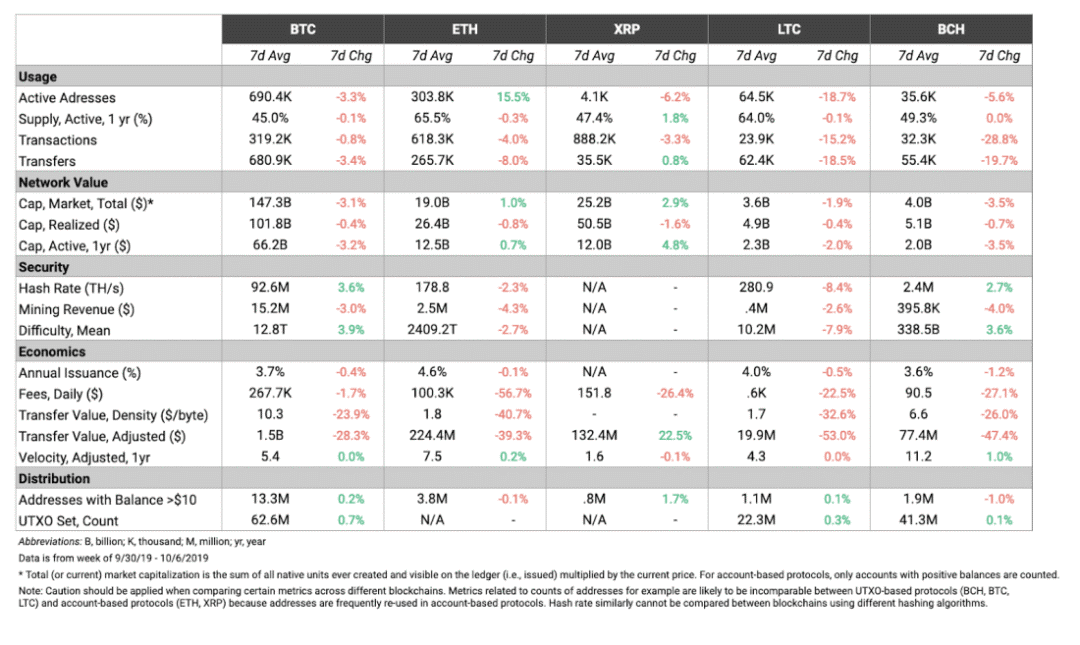
The market value of BTC and the realized market value (Realized Cap) continued to decline in the past week, down by 3.1% and 0.4% respectively. On the other hand, the market value of ETH has increased last week, the market value has increased by 1%, and the market value has increased by 0.7%. The active address of ETH also surged, growing by more than 15.5%.
- The blockchain national team is here! National Information Center and UnionPay jointly released blockchain service network
- Science | Compound cToken and related core functions
- Research Report | Cryptographic Liquidity Analysis: BTC, ETH and Stabilizing Coins are the most liquid assets
In the past week, the adjusted transfer value of BTC and ETH has also dropped significantly, exceeding 28%. The adjusted transfer value of LTC and BCH also experienced a bad week, both falling by more than 47%. However, XRP is another scene. The adjusted transfer value of XRP increased by 22.5% compared with last week.
Highlight
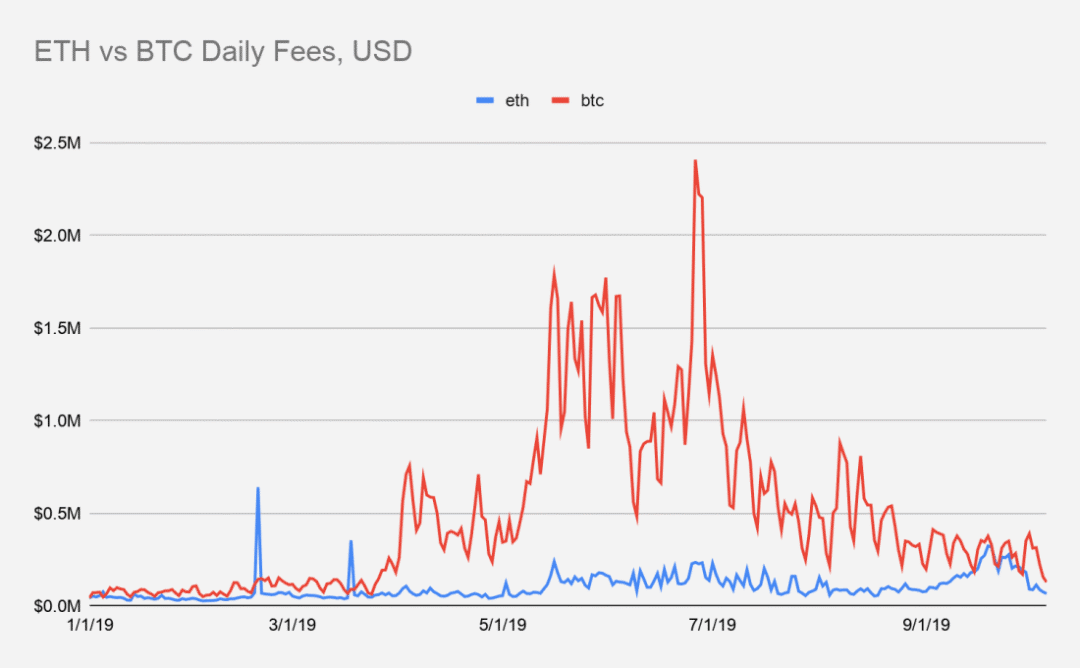
ETH continues to challenge BTC's daily trading costs.
The ETH daily fee briefly exceeded the BTC daily fee on September 28th and 29th, with a difference of approximately $20,000 for both. However, BTC took the lead again. On October 6, BTC's daily transaction costs exceeded $128,000, while ETH was slightly above $66,000.
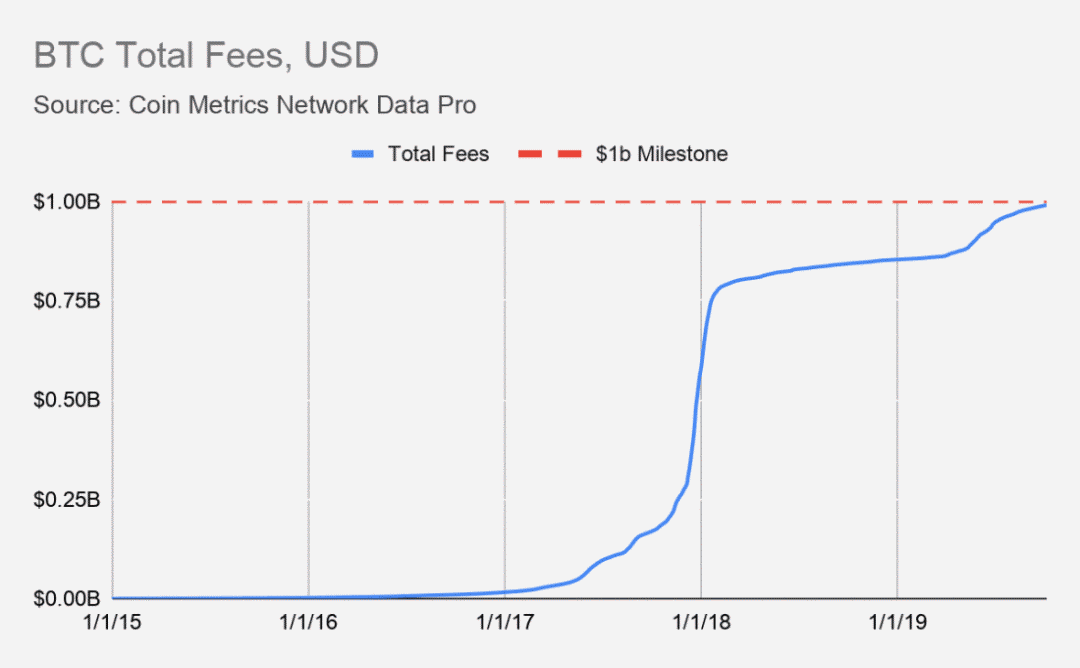
The total cost of the BTC (that is, the accumulated cost ever) is close to $1 billion.
As of October 6, the total cost of the BTC was $990,237,685. The total cost of the BTC should exceed the $1 billion milestone around October 14. Coincidentally, BTC's miners' income (including handling fees and block awards) should reach $15 billion on the same day (possibly one or two days apart) .
Second, market data
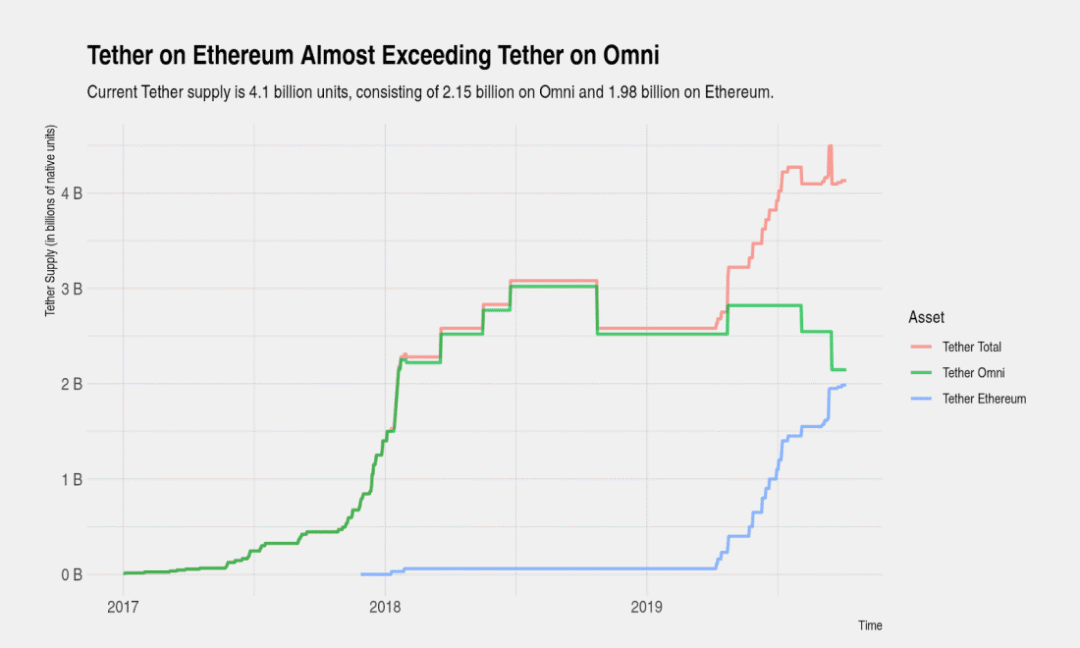
Tether on Ethereum almost exceeds Tether on Omni
A small number is also distributed in other blockchains, with 140 million on Tron and 550 million on EOS. The latest supply change occurred on September 16, when Tether Treasury destroyed 400 million on Omni and subsequently issued the same amount on Ethereum.
The decline in Tether supply provides more insight into the relationship between research and bitcoin prices
Although it is not clear why the other Tether mechanisms are being issued, there are several explanations. A set of explanations given by the representative of Tether is that Tether will be issued occasionally to fulfill the dealer's future purchase obligations.
The mass release of Tether is purely for convenience. Another set of explanations is that it is essentially conspiracy and believes that Tether and its associated entities may be involved in price manipulation. The lack of transparency has led to these explanations.
Regardless of which interpretation is closest to the truth, both interpretations may imply a relationship between Tether's release and future price movements. There is also a second-order effect, which is widely known and recognized, and such beliefs may drive the behavior of traders and allow them to be confirmed by themselves.
Recent changes in Tether supply have provided more observations for studying this relationship. In August, Tether Treasury destroyed 300 million Tethers on Omni, resulting in a second reduction in Tether supply in history. Below we use blue to indicate a one-month change in bitcoin price, and red to indicate a one-month change in Tether.
Recent price movements indicate that bitcoin prices have fallen after Tether's supply decline (with a short lag), as was the case at the end of 2018.
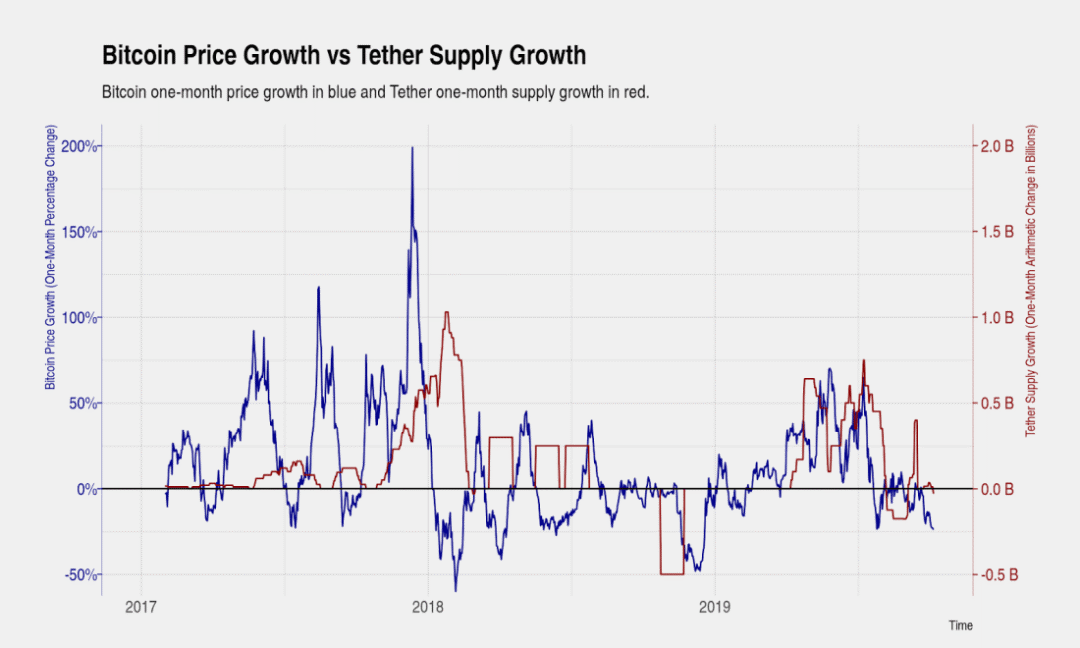
The relationship between Tether supply and bitcoin prices deserves to be studied. Areas of interest to consider include analyzing the exact timing of transactions between Tether Theasury and the exchange.
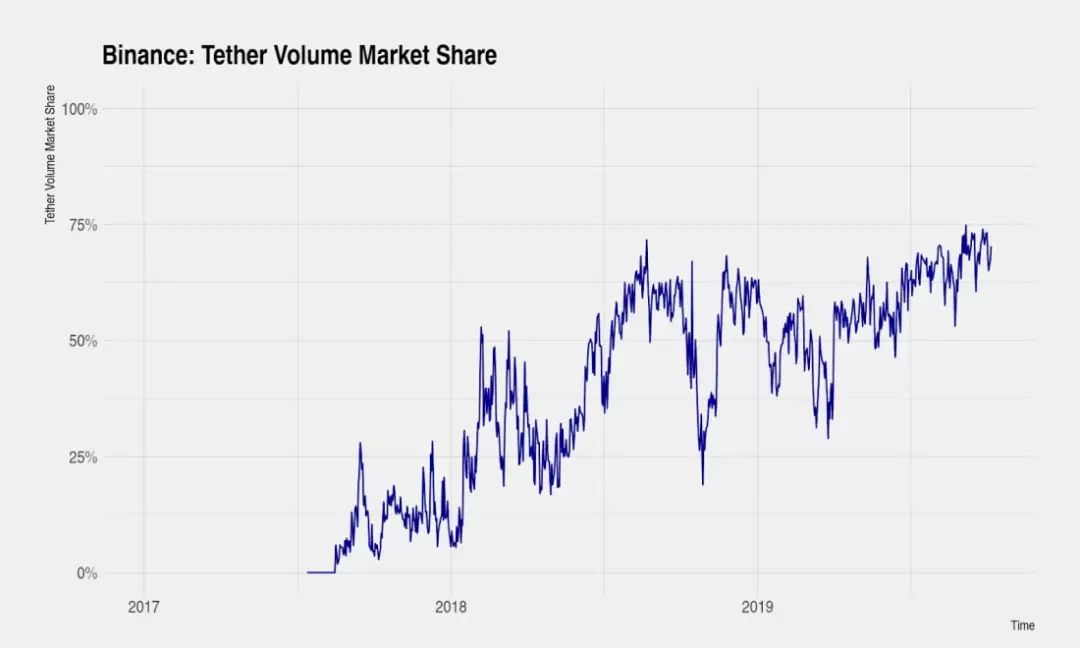
Despite increasingly strict regulatory scrutiny and increasing litigation against Tether, it remains a vital component of the cryptocurrency market and its system is growing in importance. The market share of Tether trading volume has recently approached 75% in currency security and shows a long-term growth trend.
Note: The Realized Cap is an indicator created by Coin Metrics that estimates the market value of each bitcoin supply at the price of its most recent transfer.
Therefore, if someone transferred 1 BTC in 2017 and the market price was $2,500 at the time, the cost price of the coin would be $2,500 instead of the current market price of $10,000. This provides a more realistic measure of the economic significance of cryptocurrencies. According to calculations, the current average market cost of Bitcoin is approximately $5,859.97. According to the trend, this number continues to grow.
-END-
Source: Coin Metrics' Newsletter
Translator: Chuan, Contributing Author of Blockchain Research Institute
Disclaimer: This article is the author's independent point of view, does not represent the position of the Blockchain Institute (Public Number), and does not constitute any investment advice or suggestion , the image source network .
We will continue to update Blocking; if you have any questions or suggestions, please contact us!
Was this article helpful?
93 out of 132 found this helpful
Related articles
- Suspected fraud or trading volume is zero? Inventory the reasons why the year's encryption project disappeared
- Does Tether manipulate the market?
- Cross-border big frame: C-position of "emerging" station, "classical" sides
- A number of mining machines approached the shutdown line, and only half a year later, the mining machine has to sell it?
- I understand the current status of blockchain games: To what extent is it going to happen, will there be hope in the future?
- In Devcon 5, Osaka, I saw Ethereum's diverse DeFi ecology.
- Introduction to Blockchain | Cryptography in Bitcoin: Fundamentals of Digital Signature and Transfer