Interpreting the Performance of 14 L1 Public Chains in Q1: Stacks Emerges as Dark Horse, Network Usage Rate Generally Decreases
Performance of 14 public chains in Q1: Stacks emerges as dark horse, network usage generally decreases.Author: Excerpt from Messari
Translation: Felix, BlockingNews
Key Points
- Network usage did not rebound with the cryptocurrency market in the first quarter. Although L1’s market share increased by an average of 83% compared to the previous quarter, network usage decreased by about 2.5%.
- With the emergence of Ordinals, the market’s interest in programmable Bitcoin has been reignited, and Stacks outperforms other public chains in multiple indicators, reflected in market capitalization (340%), revenue (218%), network usage (~35%), DeFi TVL (276%), and DEX trading volume (330%).
- Ethereum still leads in most key indicators, including market capitalization, revenue, DeFi TVL and trading volume, NFT trading volume, and full-time developers.
- Due to the impact of the USDC unpegging and the suspension of BUSD issuance by Blockingxos, the dominant position in the stablecoin market has shifted to USDT, benefiting TRON on the TRON network. The market capitalization of stablecoins on the TRON network increased by 30% month-on-month to US$43.6 billion; the market capitalization of stablecoins issued by other L1s all decreased month-on-month.
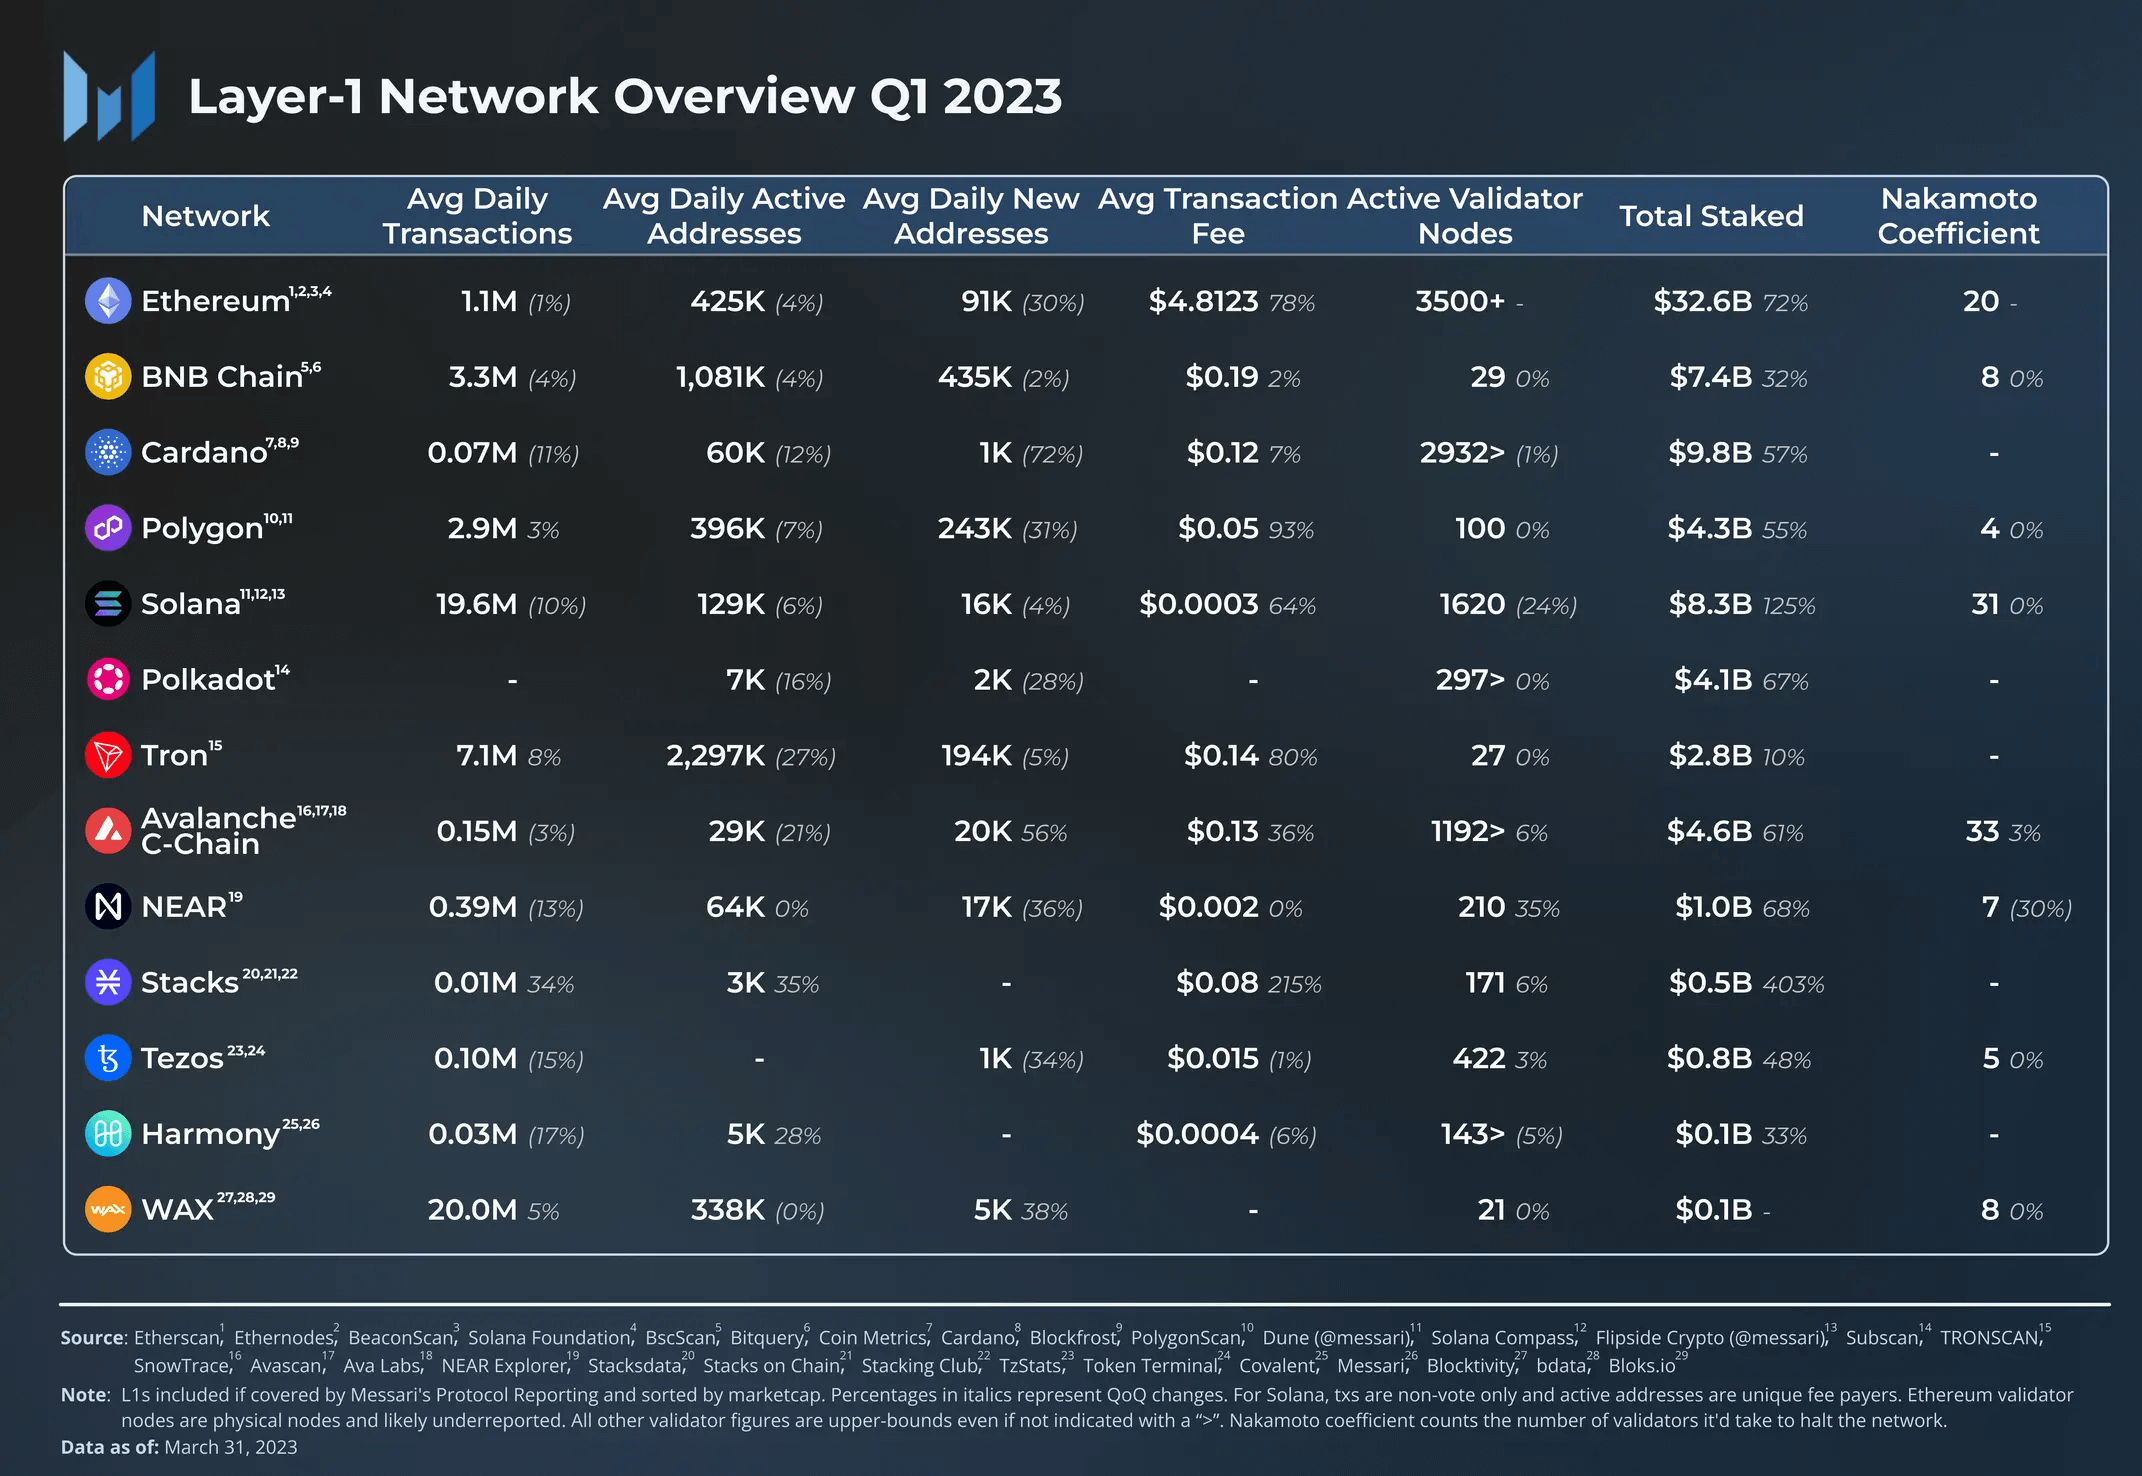
This report summarizes and compares the finances, networks, and ecosystems of 14 L1 blockchains, including Avalanche, BNB Chain, Cardano, Ethereum, Harmony, Hedera, NEAR, Polkadot, Polygon, Solana, Stacks, Tezos, TRON and WAX.
Financial Analysis
- Understanding the Equity Staking Mechanism of Blockchain, Oracle, and DeFi in one article
- How to find the address of a whale that earned 50 times in 3 days using existing resources?
- Analysis of Beijing’s Internet 3.0 White Paper (Full Text Included): Separating from Web 3.0, Focusing on Artificial Intelligence and Metaverse
Market Capitalization
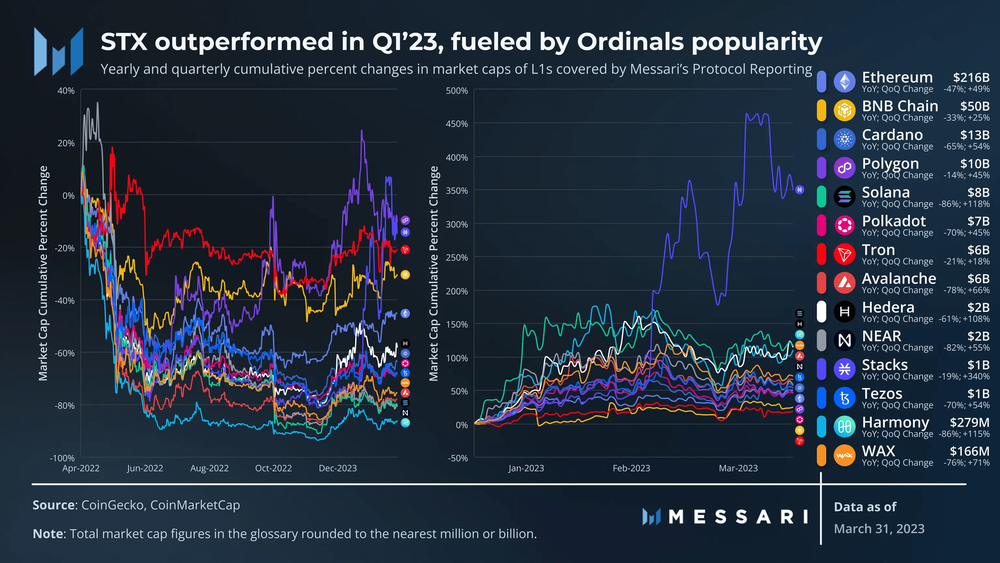
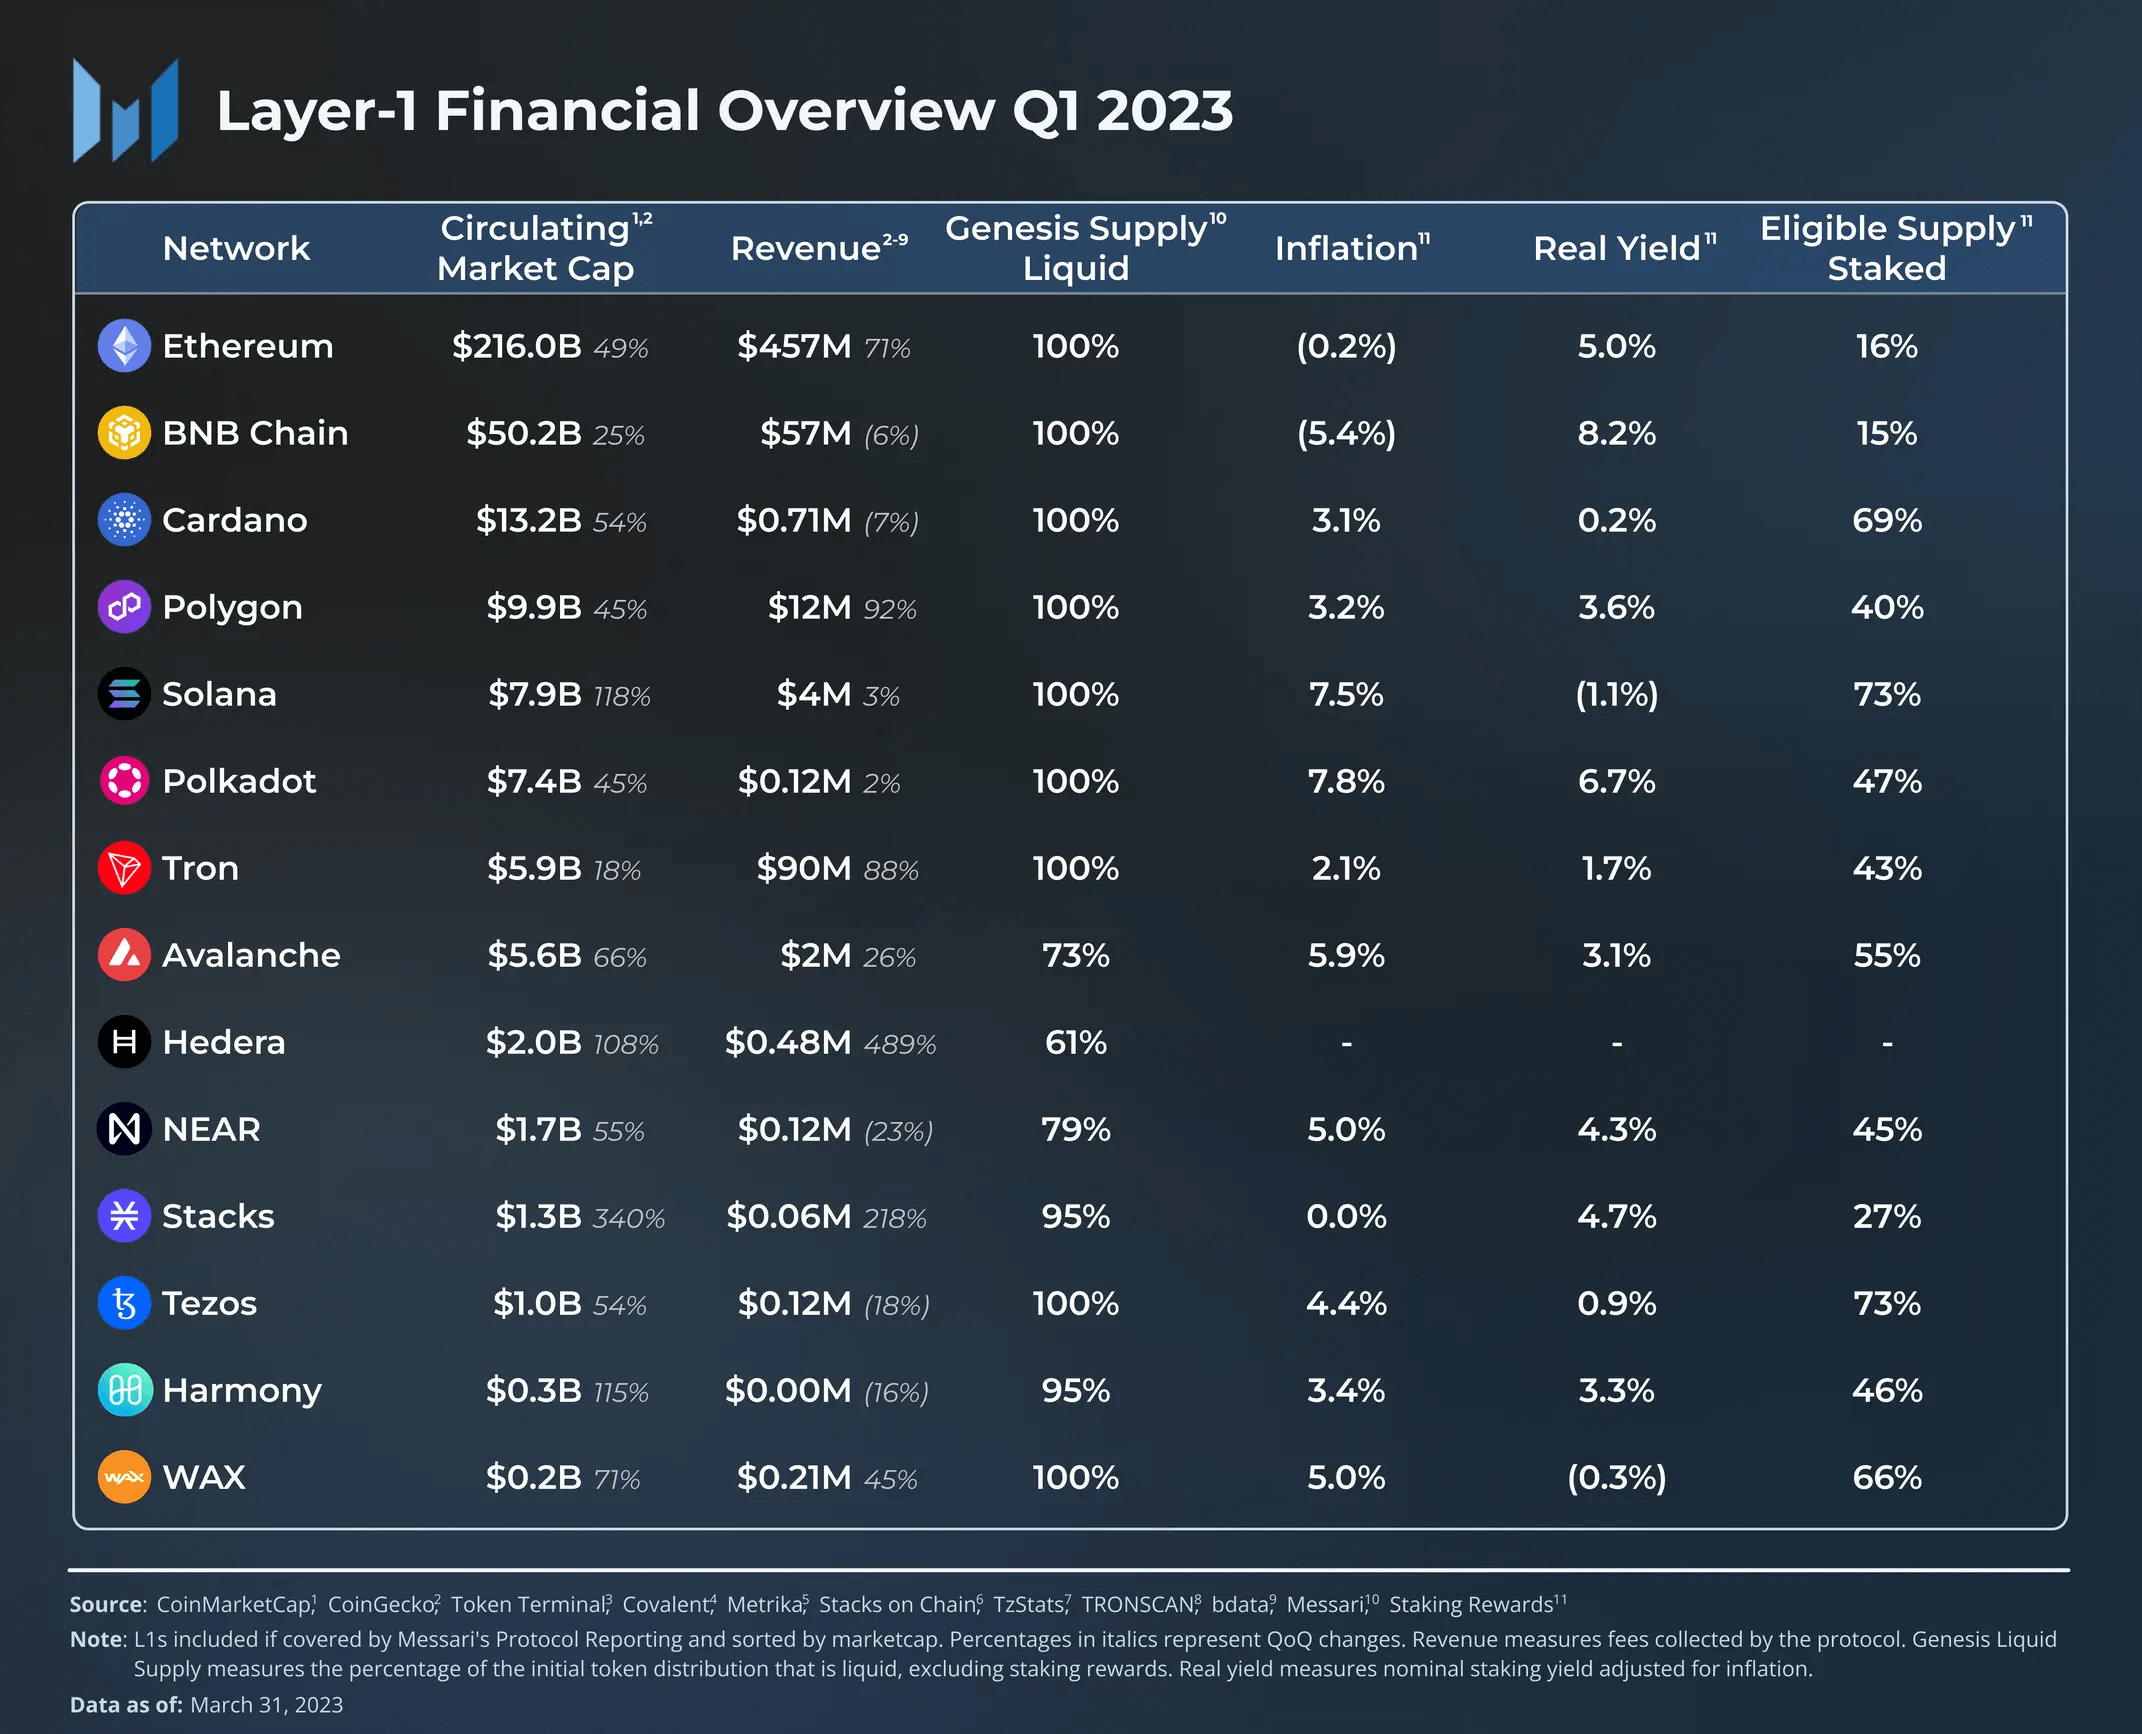
After a turbulent 2022, the cryptocurrency market rebounded in the first quarter of 2023. On average, L1’s market capitalization increased by 83% compared to the previous quarter, but it still decreased by 58% year-on-year. Driven by Bitcoin Ordinals, Stacks’ STX token performed well in the first quarter, reigniting the market’s interest in programmable Bitcoin. In absolute terms, ETH’s market capitalization is still more than twice the sum of all other public chain tokens.
Revenue
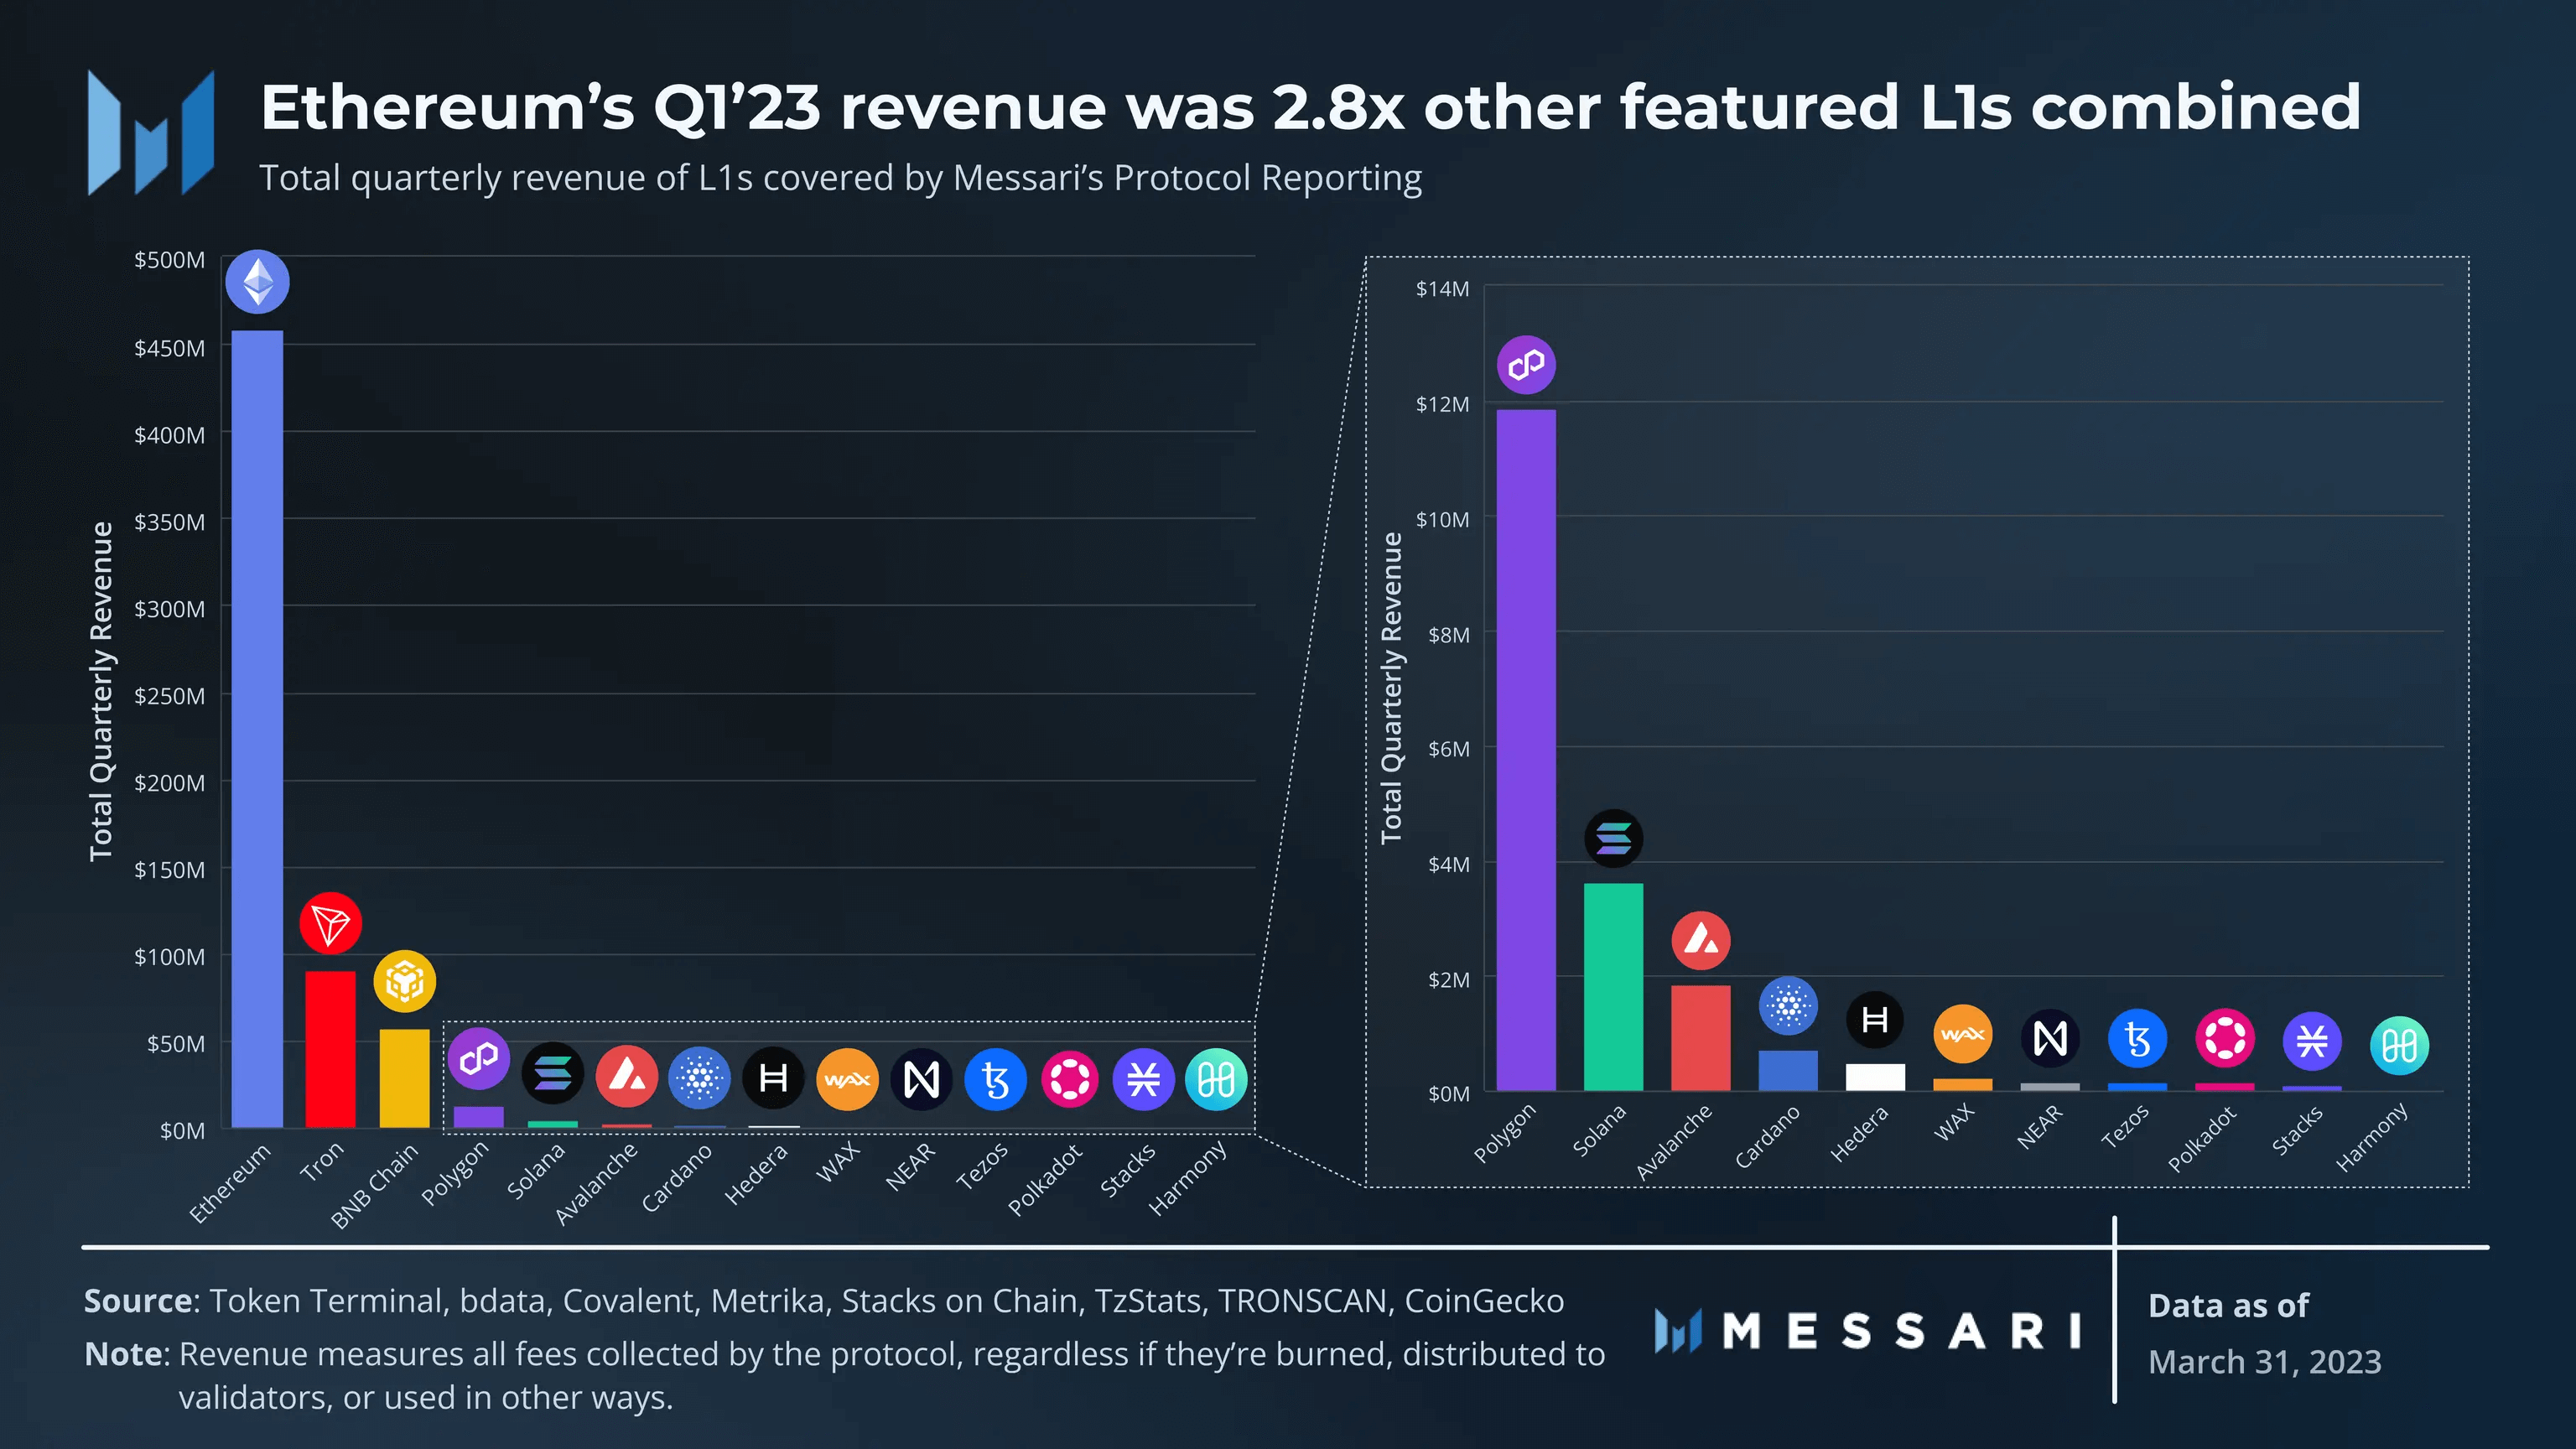
Here, revenue refers to the total fees charged by the protocol. Due to relatively high usage and gas fees, Ethereum’s revenue in the first quarter was US$457 million, almost 2.8 times the total revenue of all other L1s. The most significant revenue growth was Hedera, which increased by 489% month-on-month, largely driven by the increased use of its consensus service, which provides verifiable timestamps and event ordering for Web2 and Web3 applications. These applications include tracking sources, calculating votes in DAOs, and monitoring IoT devices.
Market-to-Sales Ratio
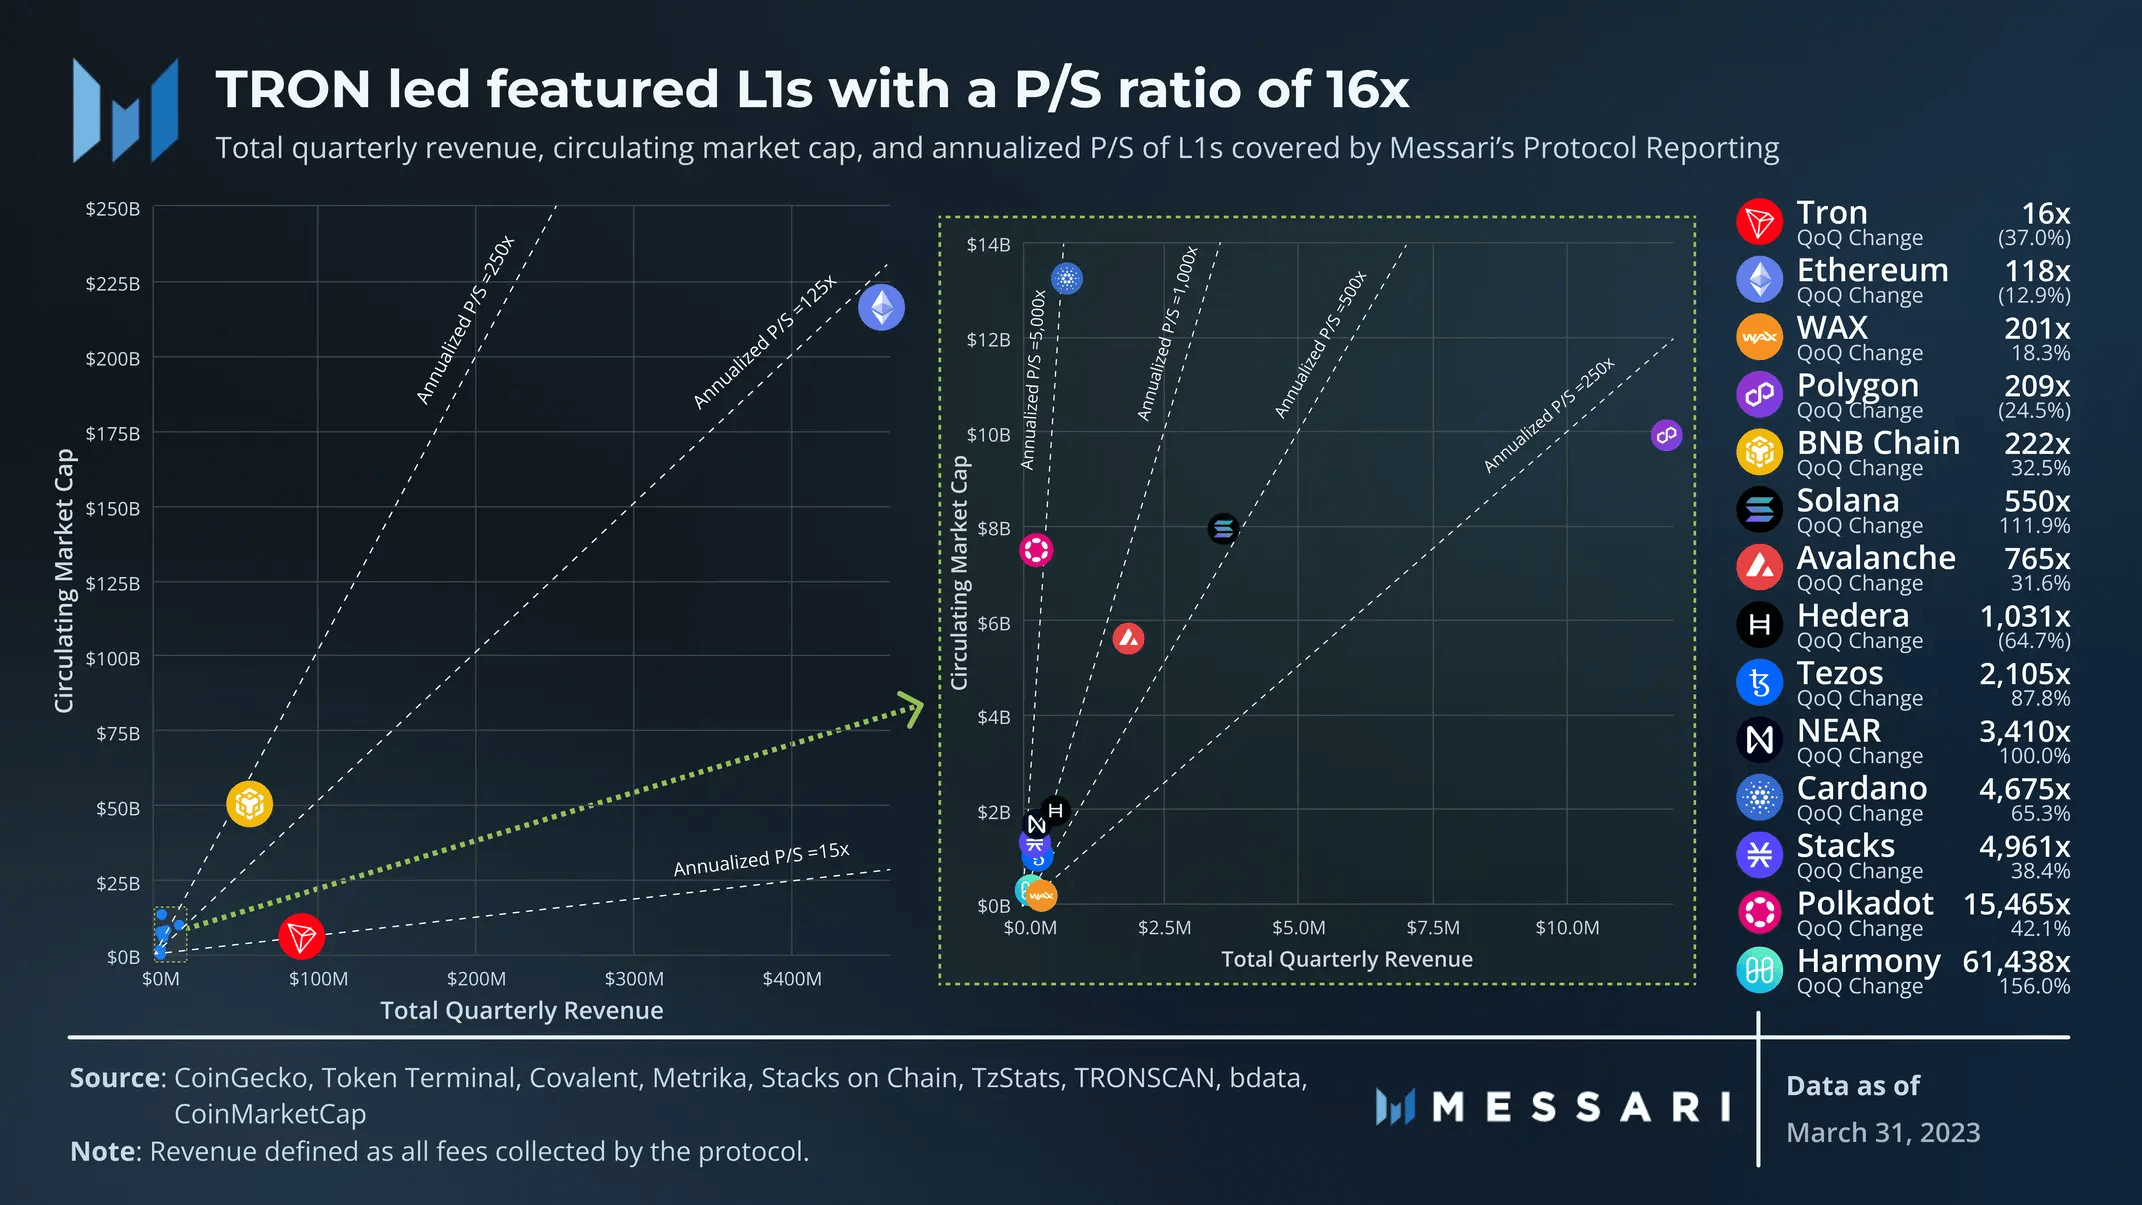
The market-to-sales ratio shows the ratio of the token’s market value to its revenue. TRON led with a 16x market-to-sales ratio in the first quarter, followed by Ethereum at 188x. WAX was the only public chain outside the top 20 market caps with a high market-to-sales ratio. While most public chains generate revenue from transaction fees, WAX’s revenue is driven by the 2% tax on its NFT market.
TRON, Ethereum, Polygon, and Hedera were the only public chains with a decrease in market-to-sales ratio in the first quarter, meaning their revenue growth outpaced the growth in token market value. On a quarterly basis, the public chains with the largest increase in market-to-sales ratio were NEAR (100%), Solana (112%), and Harmony (156%).
Inflation
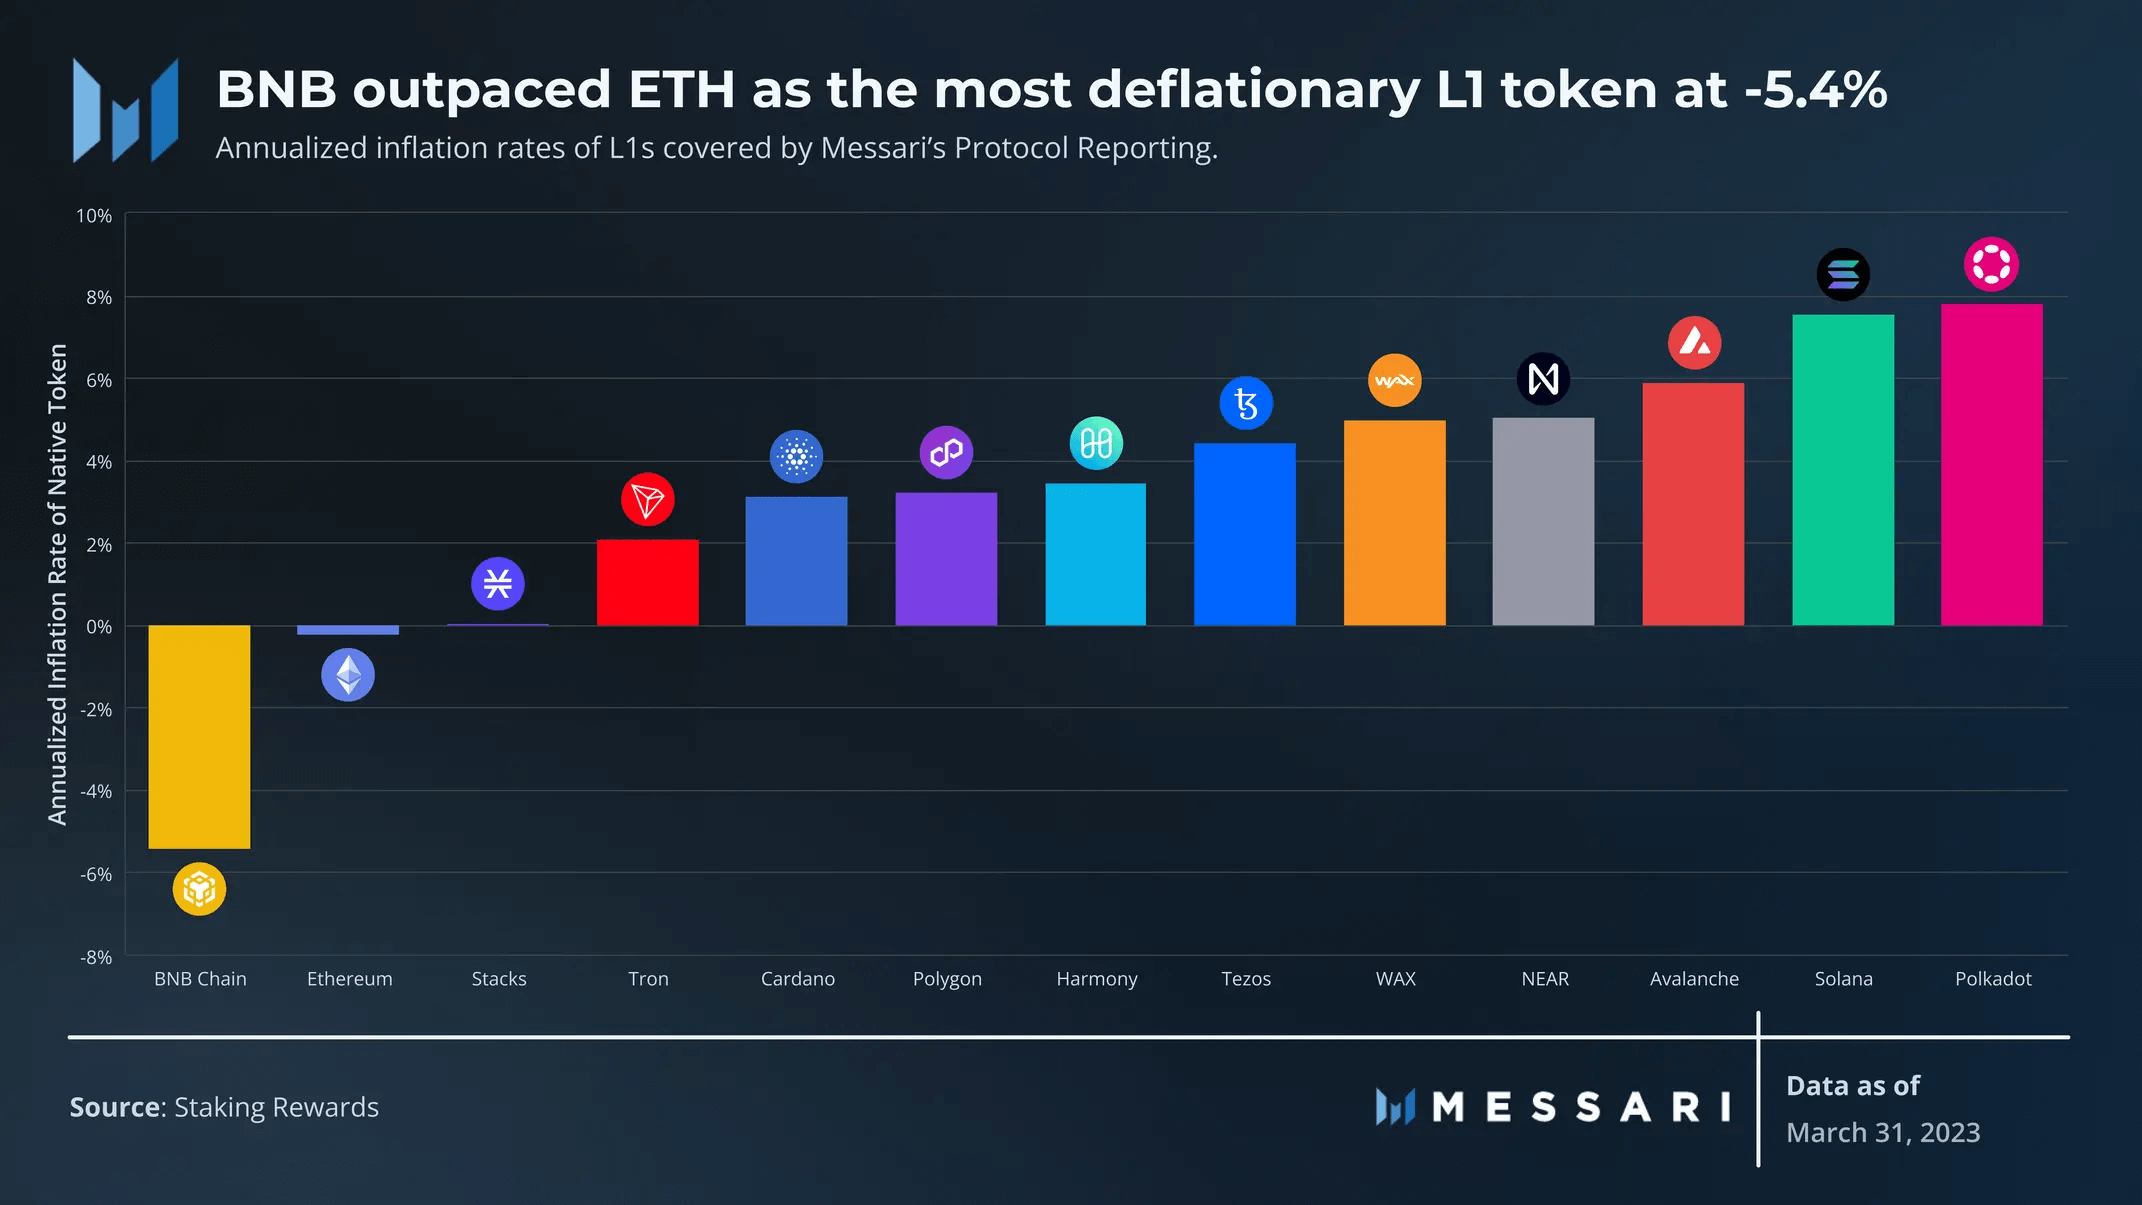
Inflation caused by PoS reward issuance is a transfer of wealth from holders to stakeholders. The higher the inflation rate, the more advantageous it is for validators and the less advantageous it is for holders, and vice versa.
BNB and ETH were the only deflationary tokens in the first quarter of ’23, at -5.4% and -0.2%, respectively. Both public chains burn a portion of their transaction fees. Additionally, Binance buys back and burns tokens every quarter, which is the main reason for its deflationary pressure.
Token Circulating Supply
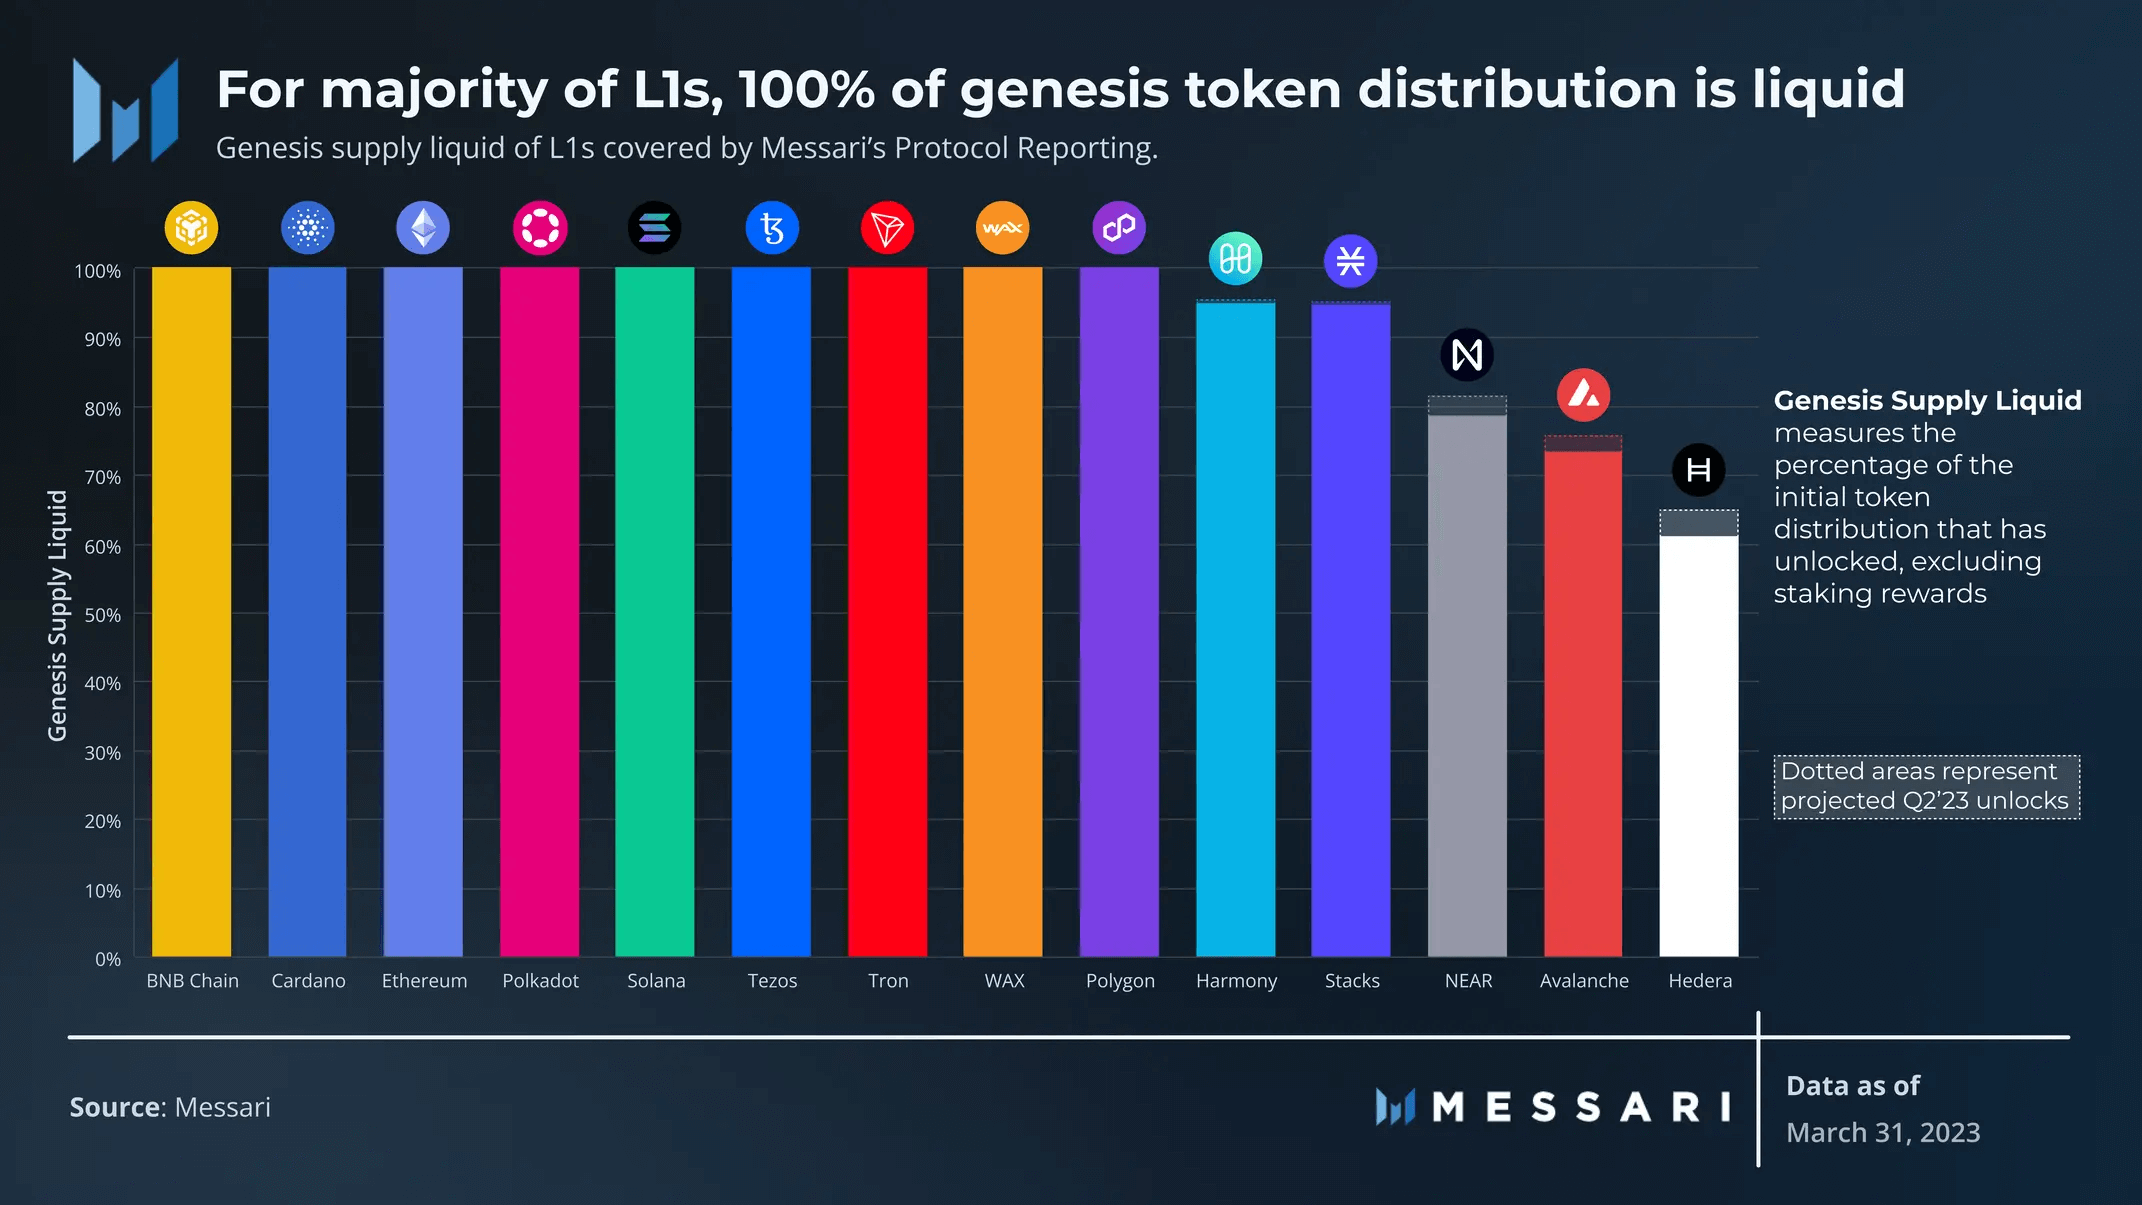
In addition to PoS rewards, the unlocking of genesis tokens can also create inflationary pressure. Genesis Supply Liquid measures the percentage of unlocked genesis tokens, excluding staking rewards. This metric is standardized between networks with capped supply (fixed staking rewards included in the initial allocation) and those with uncapped supply (infinite staking rewards not included in the initial allocation).
With the exception of Avalanche, Hedera, NEAR, and Harmony, most public chains have fully unlocked their tokens:
- Stacks has unlocked roughly 95%, with about 0.5% unlocking to the treasury in 2Q23.
- Harmony has unlocked roughly 95%, with about 0.6% unlocking in 2Q23 for ecosystem development.
- NEAR has unlocked approximately 79%, with an additional 3% unlocking in 2Q23 for grants, core contributors, and investors.
- Avalanche has unlocked approximately 73%, with an additional 2.5% unlocking in 2Q23 for strategic partners, the foundation, and the core team.
- Hedera has unlocked approximately 61%, with an additional approximately 4% unlocking in 2Q23.
Avalanche and Hedera have supply caps, and these unlocking percentages are for Genesis supply (excluding staking rewards) rather than total supply.
Realized Yield and Eligible Staking Supply
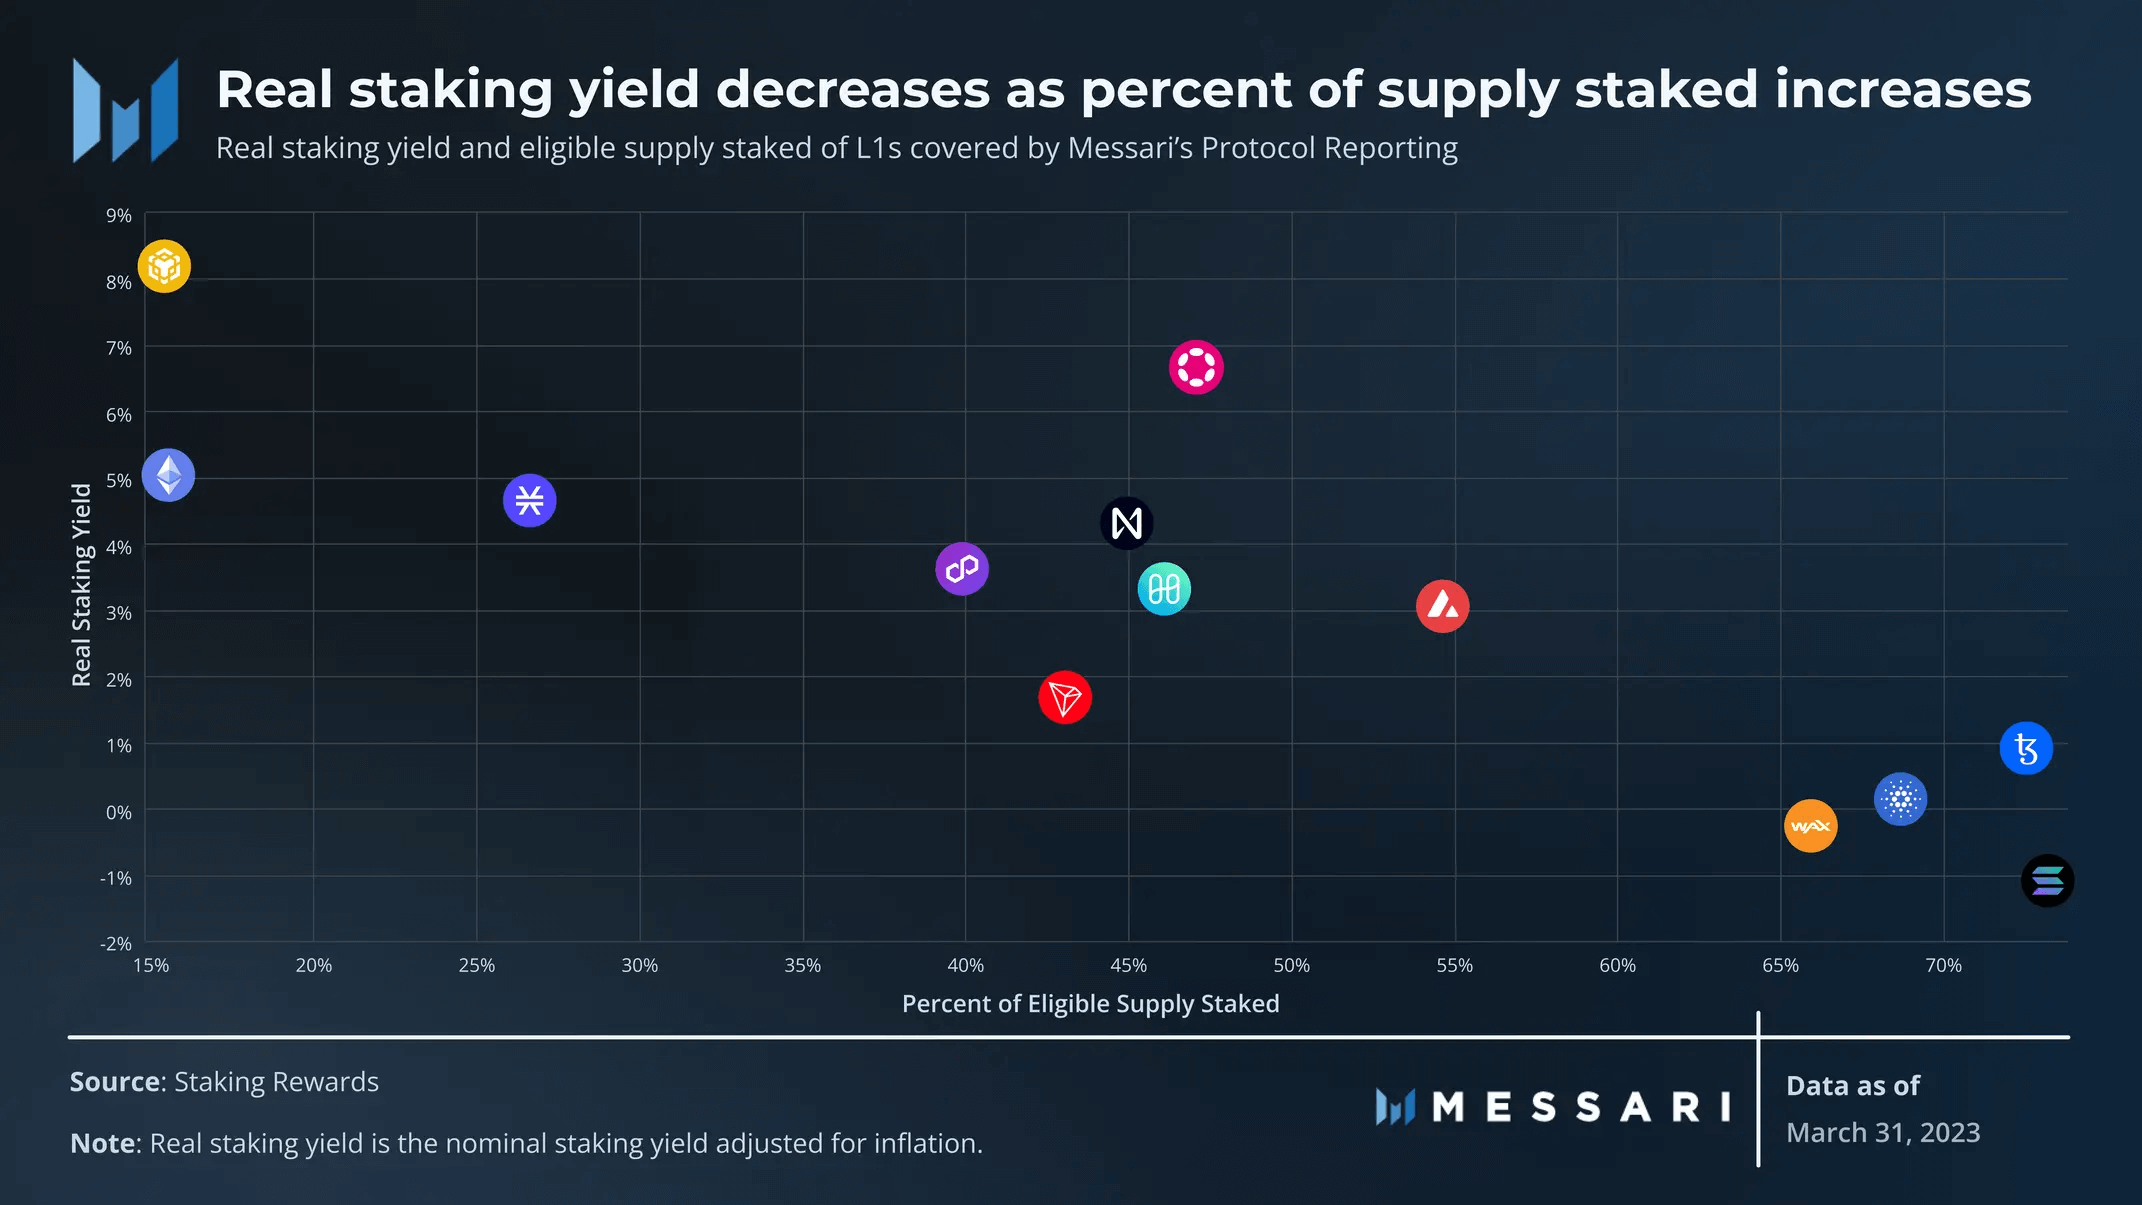
The distribution rate of PoS rewards typically depends on the percentage of staked supply and/or the number of validators. Tokens with low inflation rates such as BNB, ETH, and STX allow holders to freely use the token without punishment for not staking, resulting in lower staking rates. On the other hand, tokens with higher inflation rates are optimized for higher staking rates. Although liquidity staking allows staked tokens to participate in the ecosystem, it typically comes with worse liquidity, smart contract risks, and different tax implications.
Network Analysis
User Activity
User activity is difficult to compare across different systems (e.g., EVM, SVM, and Antelope). Each system architecture has a unique way of processing and recording transactions and address activity. Additionally, the ratio of addresses to users is not 1:1 and varies by public chain.
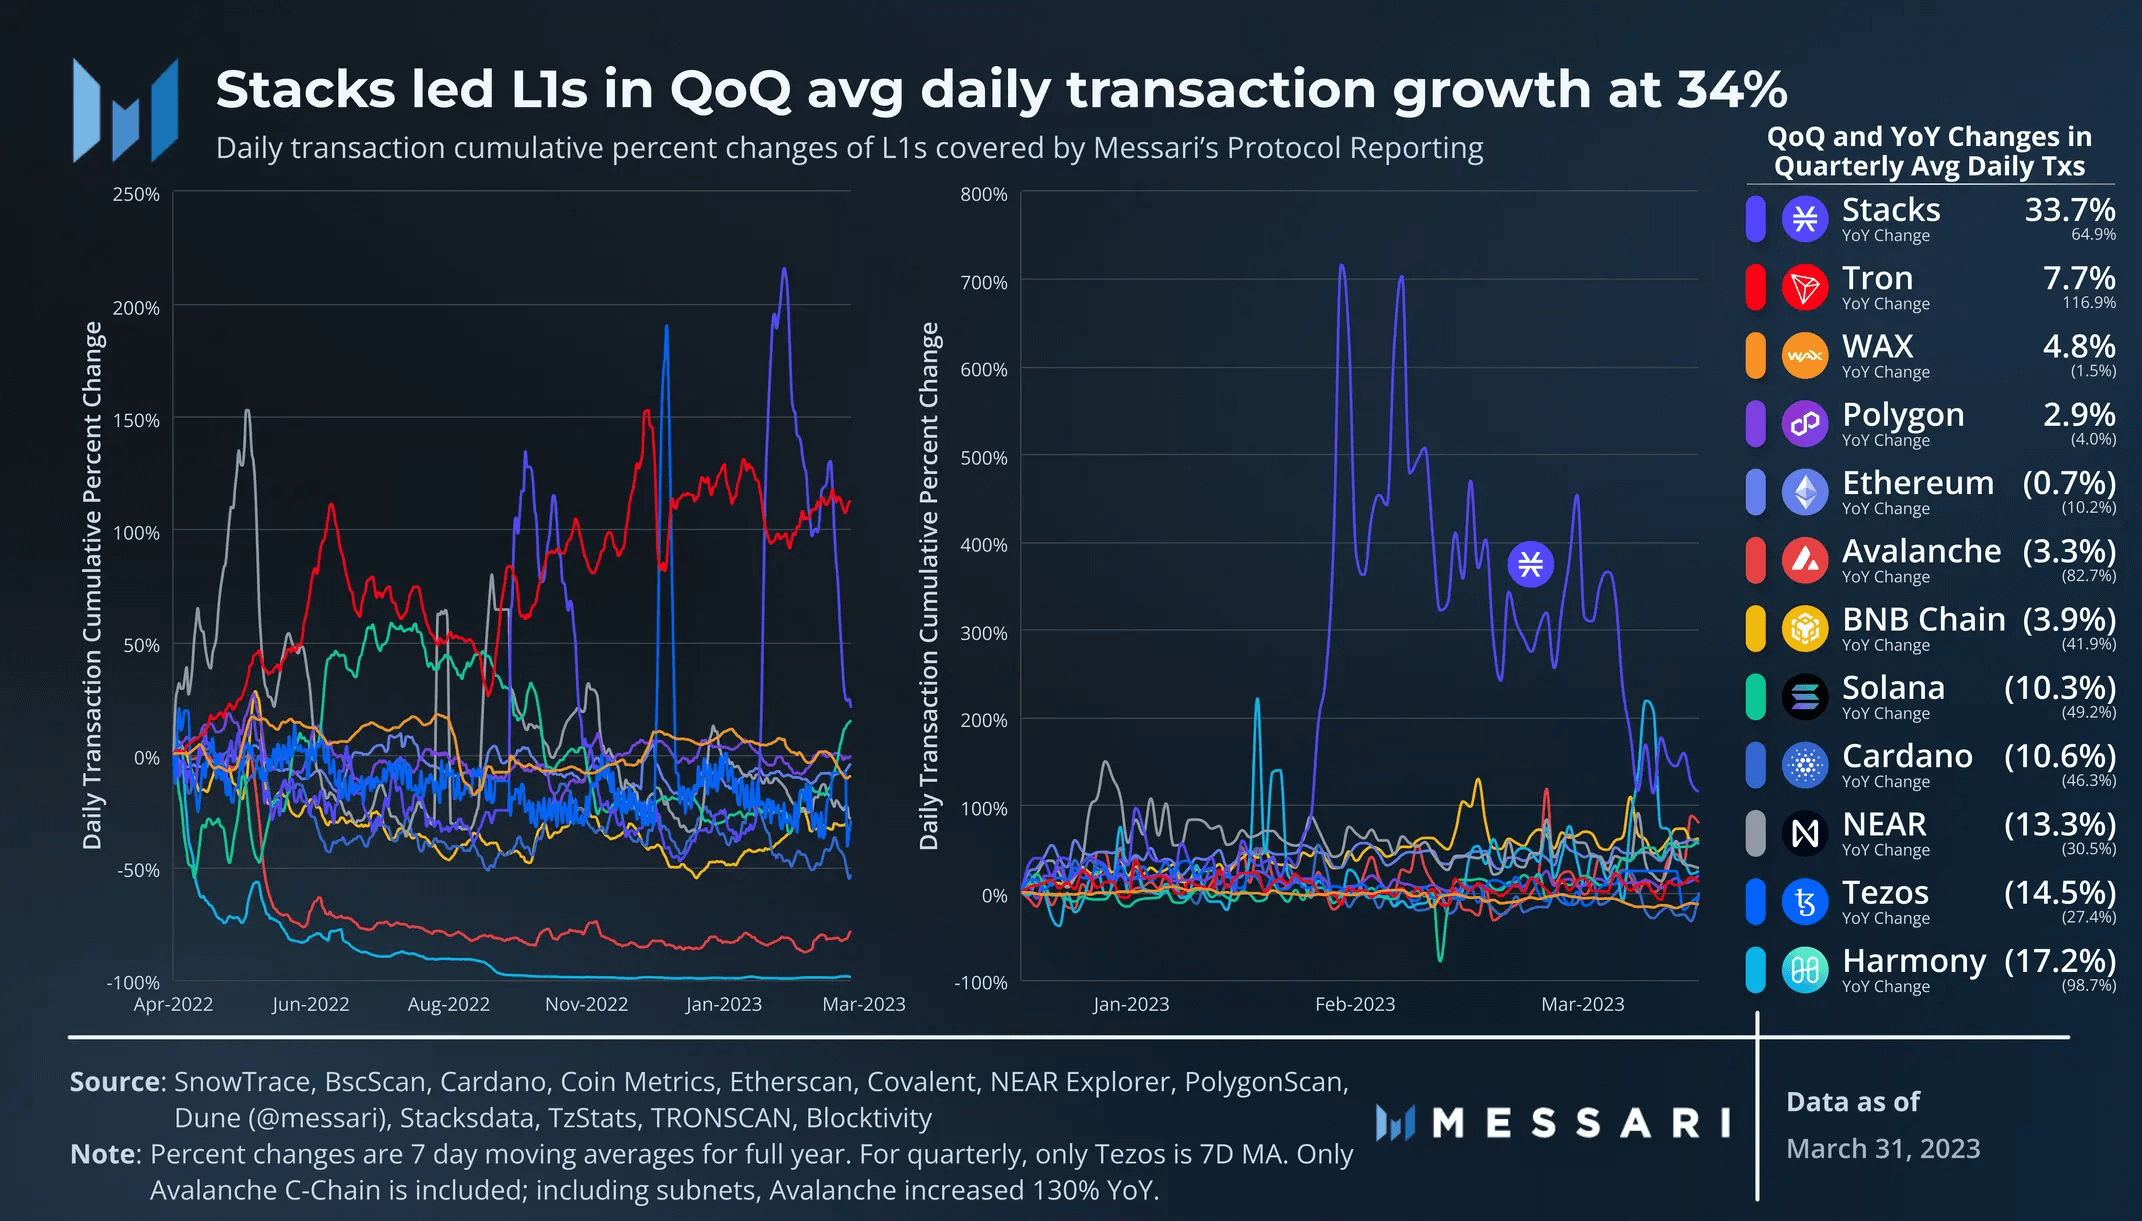
Trading activity did not increase with the market rebound. The average daily transaction volume change was -2%. Stacks is a clear exception: its user activity growth slightly preceded the STX price surge and increased by 34% MoM at the end of this quarter.
Note that Avalanche data only includes C-chain activity. Due to the launch of subnets, C-chain transactions decreased by 82.7% YoY. Including subnets, the average daily transaction volume increased by 130% YoY.
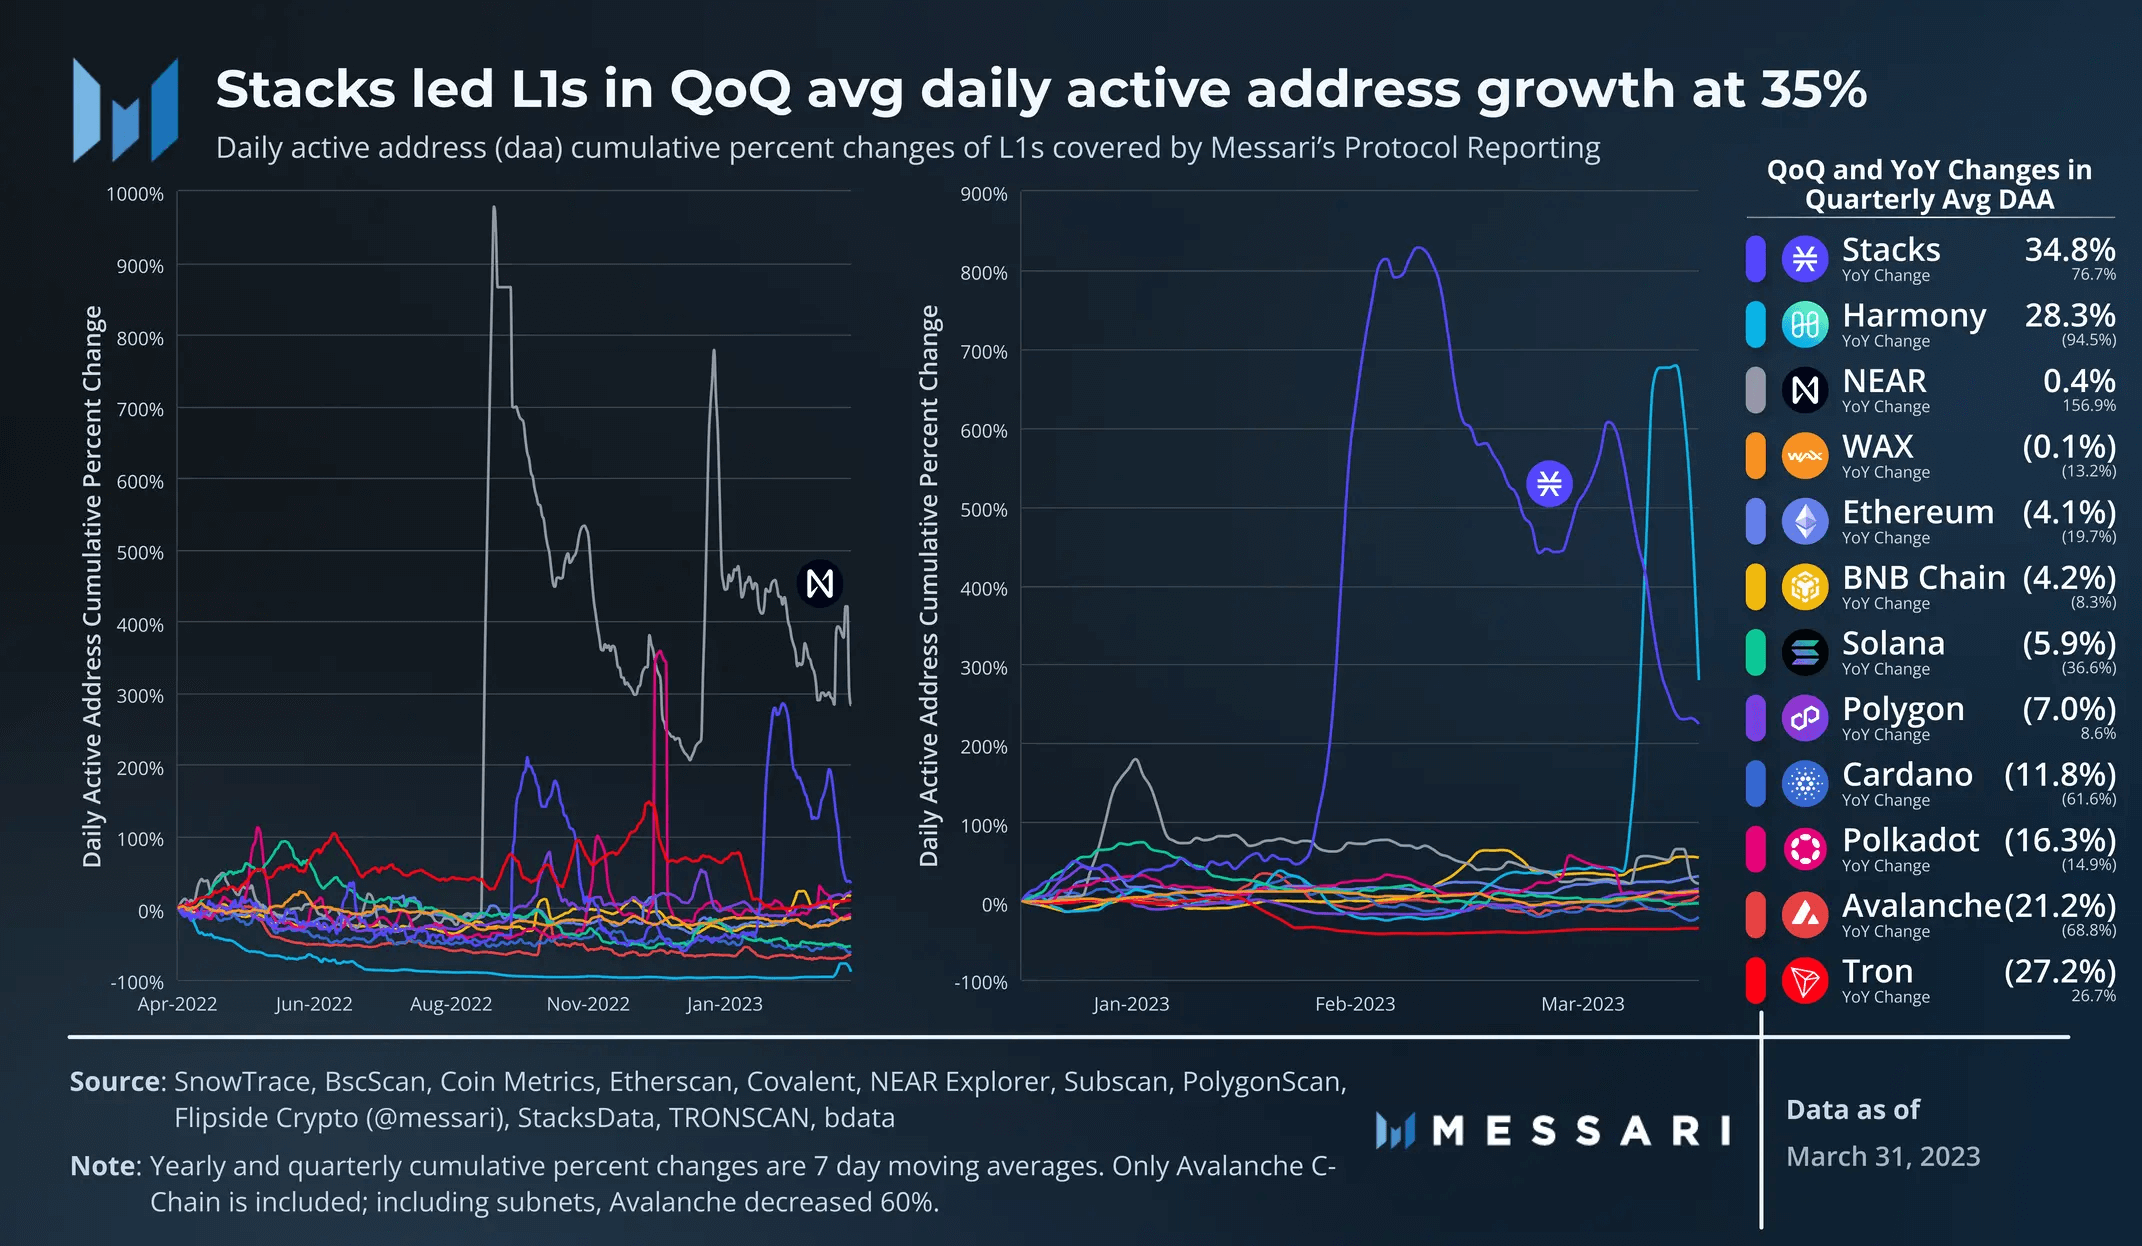
The average MoM change in daily active addresses was -3%. In terms of trading, Stacks led with a 35% increase. Harmony’s 28% increase was mainly due to an abnormal surge at the end of this quarter, but it did not persist.
NEAR had the largest YoY increase in average daily active addresses, reaching 157%, due to the launch of Sweat Economy in mid-September of last year.
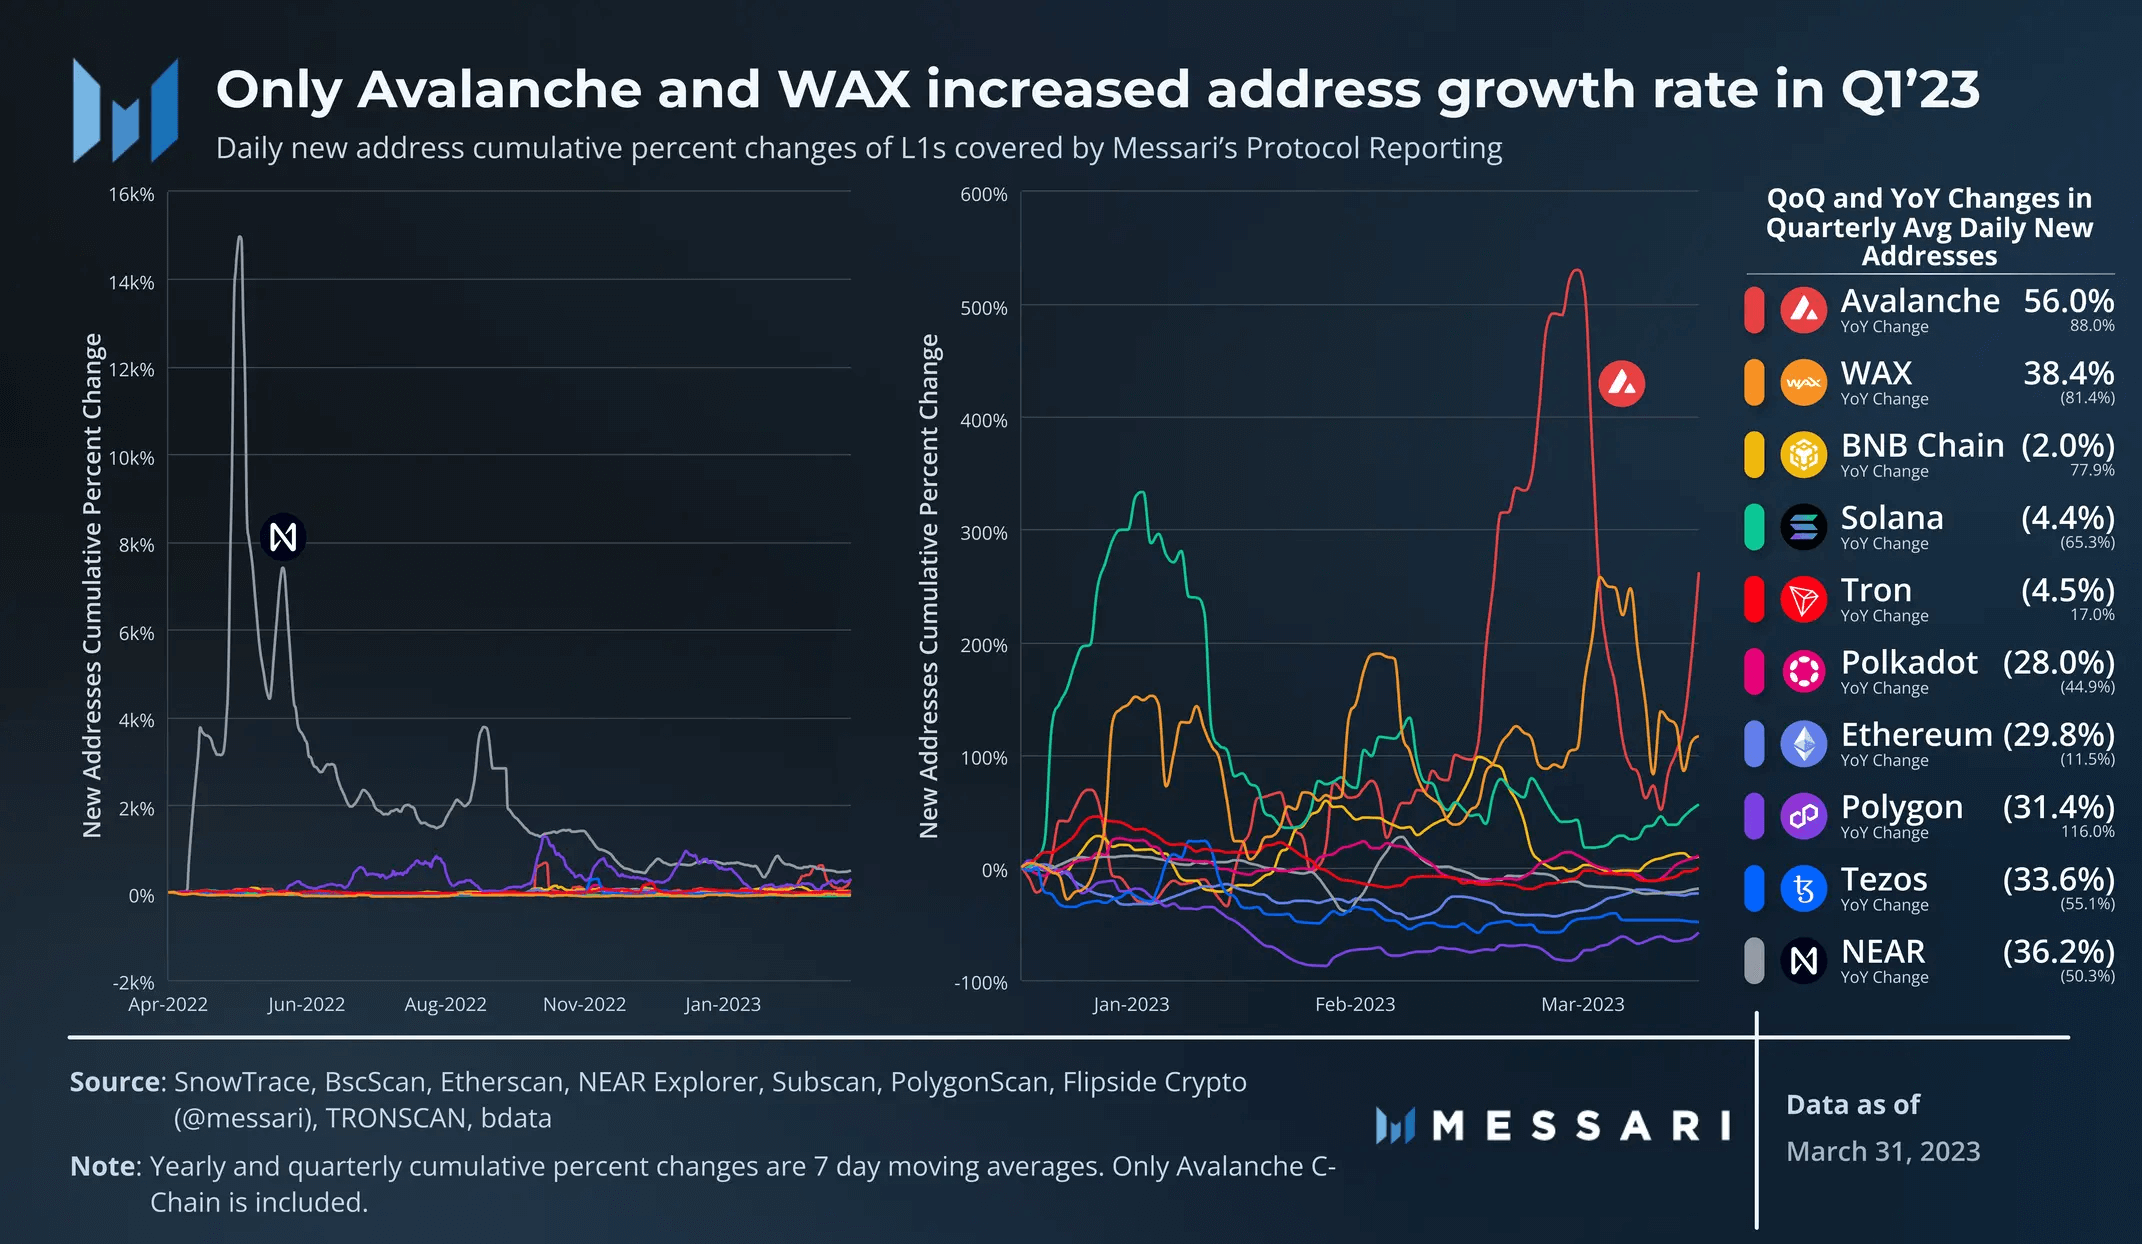
Only Avalanche C-Chain and WAX saw an increase in address growth rate in Q1. Avalanche’s new addresses increased by 56% MoM. WAX increased by 38% MoM.
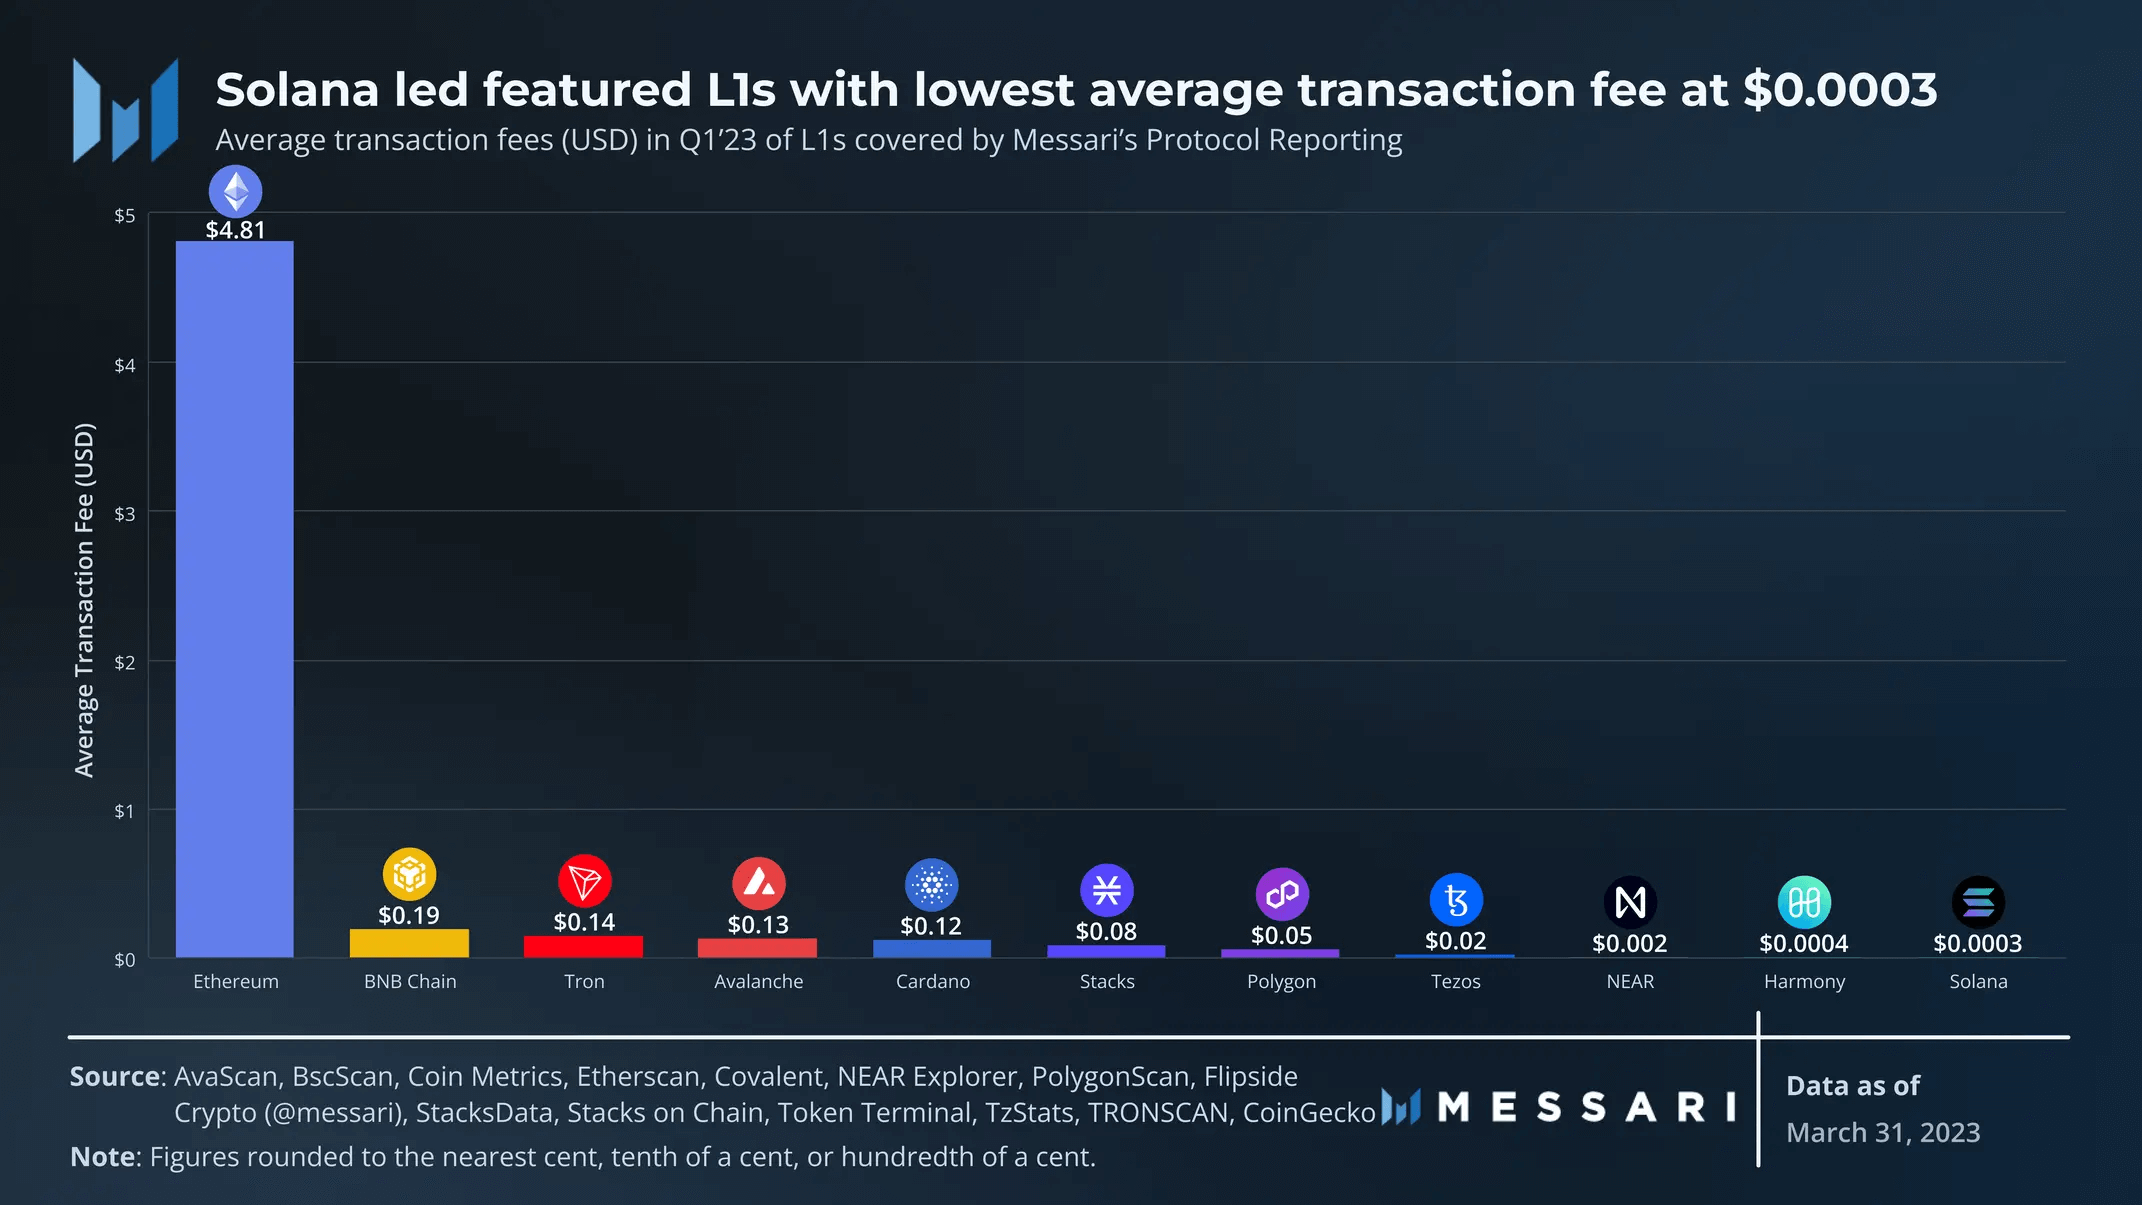
Solana’s average transaction fee was $0.0003 in Q1, far lower than other L1s. The Solana development team has released numerous upgrades over the past year to improve its fee market and overall network performance.
Validators
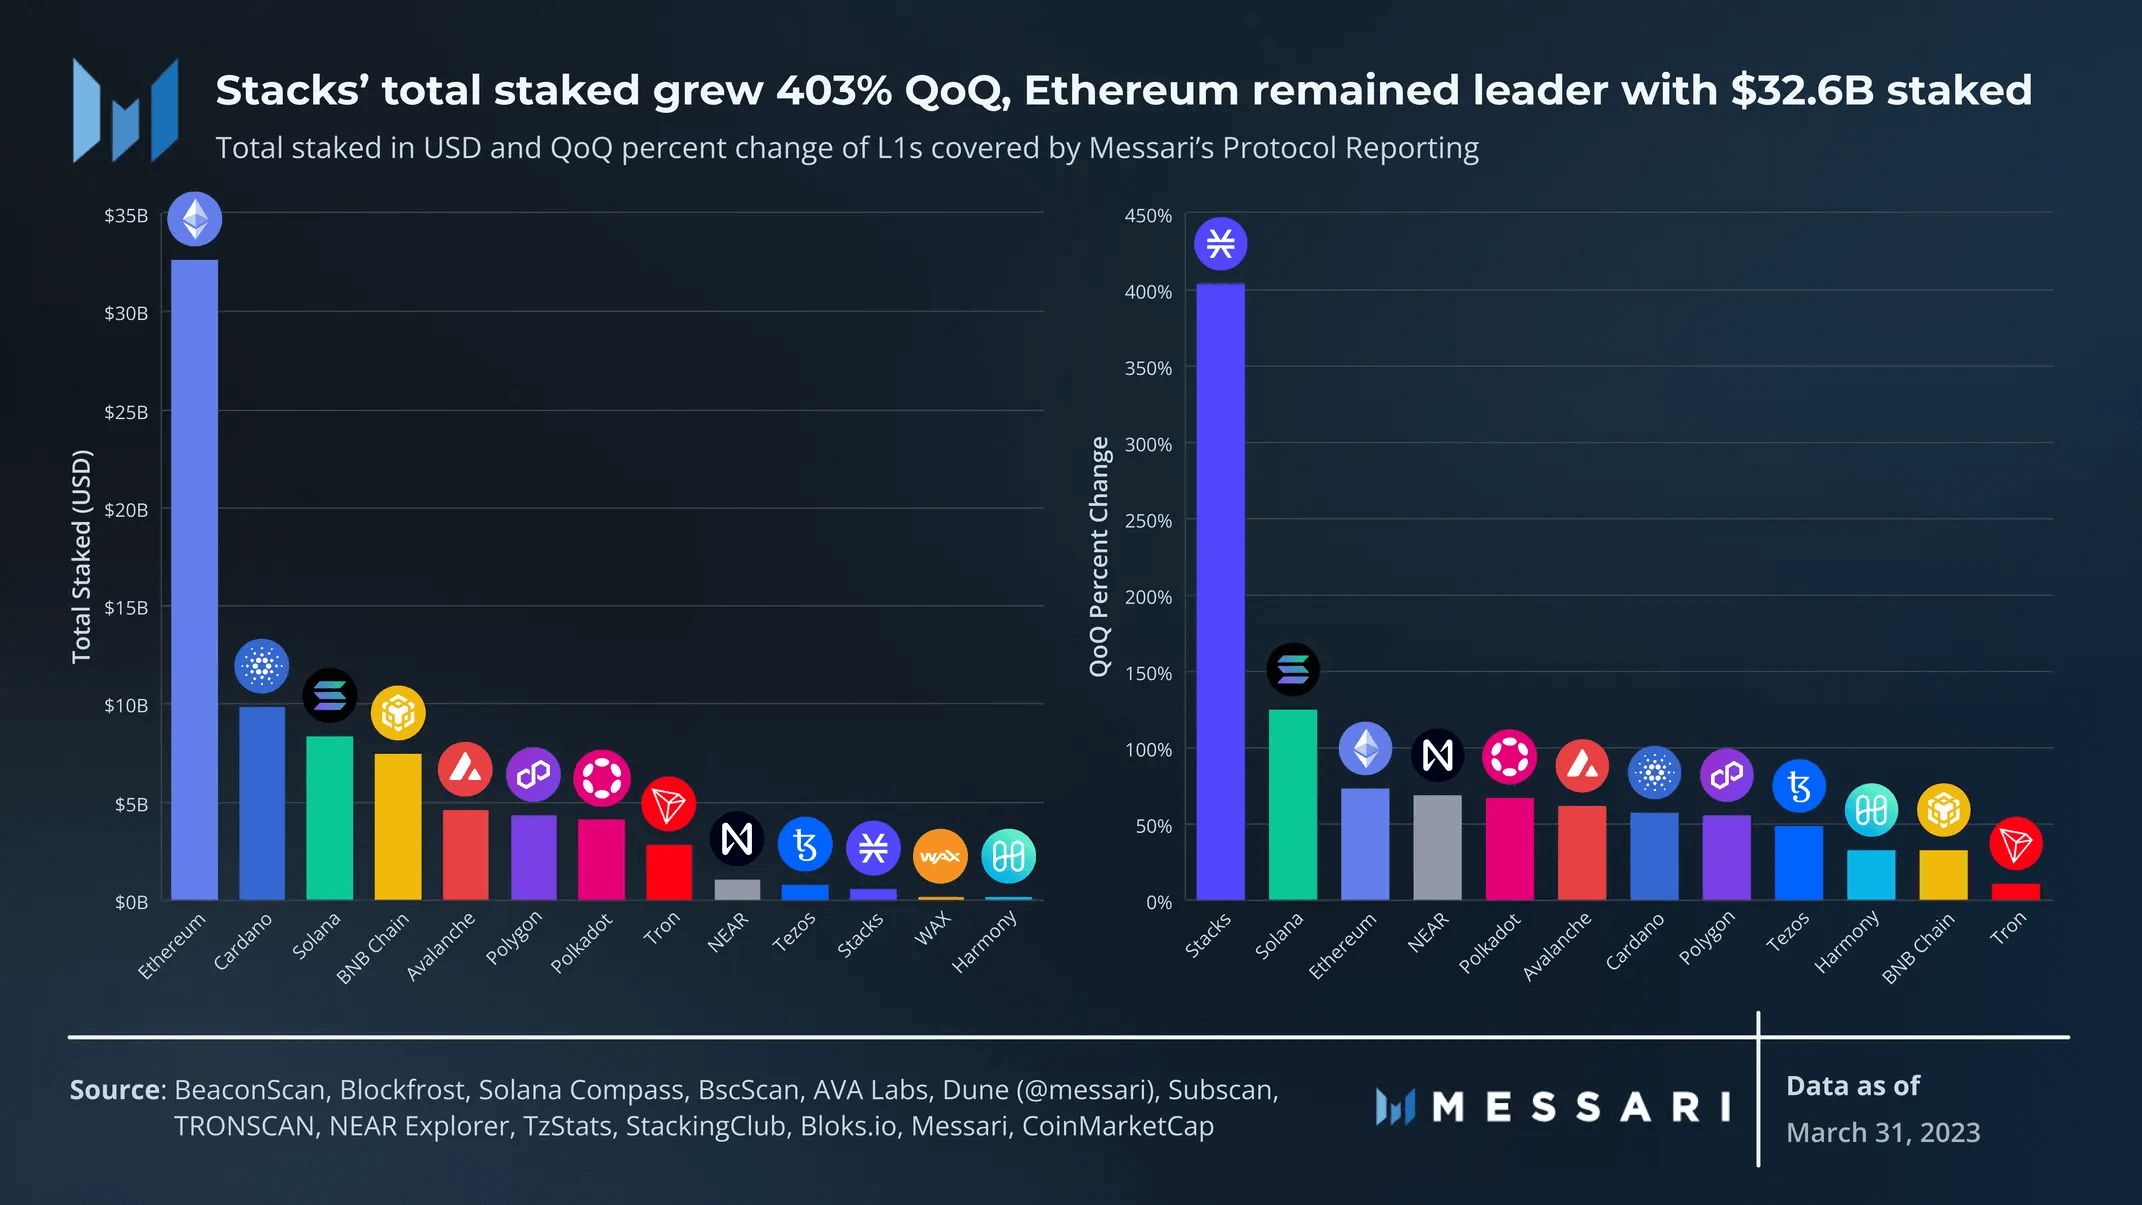
As expected during a market uptrend, total staked tokens in USD increased MoM across all networks, with Stacks (403%) and Solana (125%) leading the growth. The growth in total staked USD for each network slightly outpaced the growth in their market caps, indicating net growth in staked native tokens. Ethereum’s security budget remains the largest, exceeding $20 billion, with staked ETH reaching $32.6 billion at the end of Q1.
Like users, the number of validators is not standardized across networks. While tracking the number of validators is straightforward, tracking the number of node operators is more difficult. The ratio of validators to node operators varies by network and is primarily determined by the staking weight mechanism.
- Ethereum: Staking weight limit of 32 ETH (0.0001% of total staked at the end of Q1).
- Avalanche: Staking weight limit of 3 million AVAX (1.3% of total staked at the end of Q1 2021).
- Cardano: Staking weight limit is determined by dynamic parameters and is currently 70 million ADA (0.3% of total staked at the end of Q1 2023).
- Polkadot: All active validators receive the same rewards regardless of weight. Minimum staking weight is dynamic and is currently approximately 2.14 million DOT (0.3% of total staked at the end of Q1).
- Harmony: Staking weight is restricted between 85% and 115% of the median effective stake.
Ethereum has the lowest staking weight limit relative to its total staked. While there were over 560K validators at the end of Q1, there were far fewer node operators. According to ethernodes, there were over 3,500 syncing physical validator nodes. This may be an underestimate, as Nodewatch’s data is roughly twice this number, though it is currently unclear whether Nodewatch includes nodes other than validators.
Ecosystem Analysis
DeFi
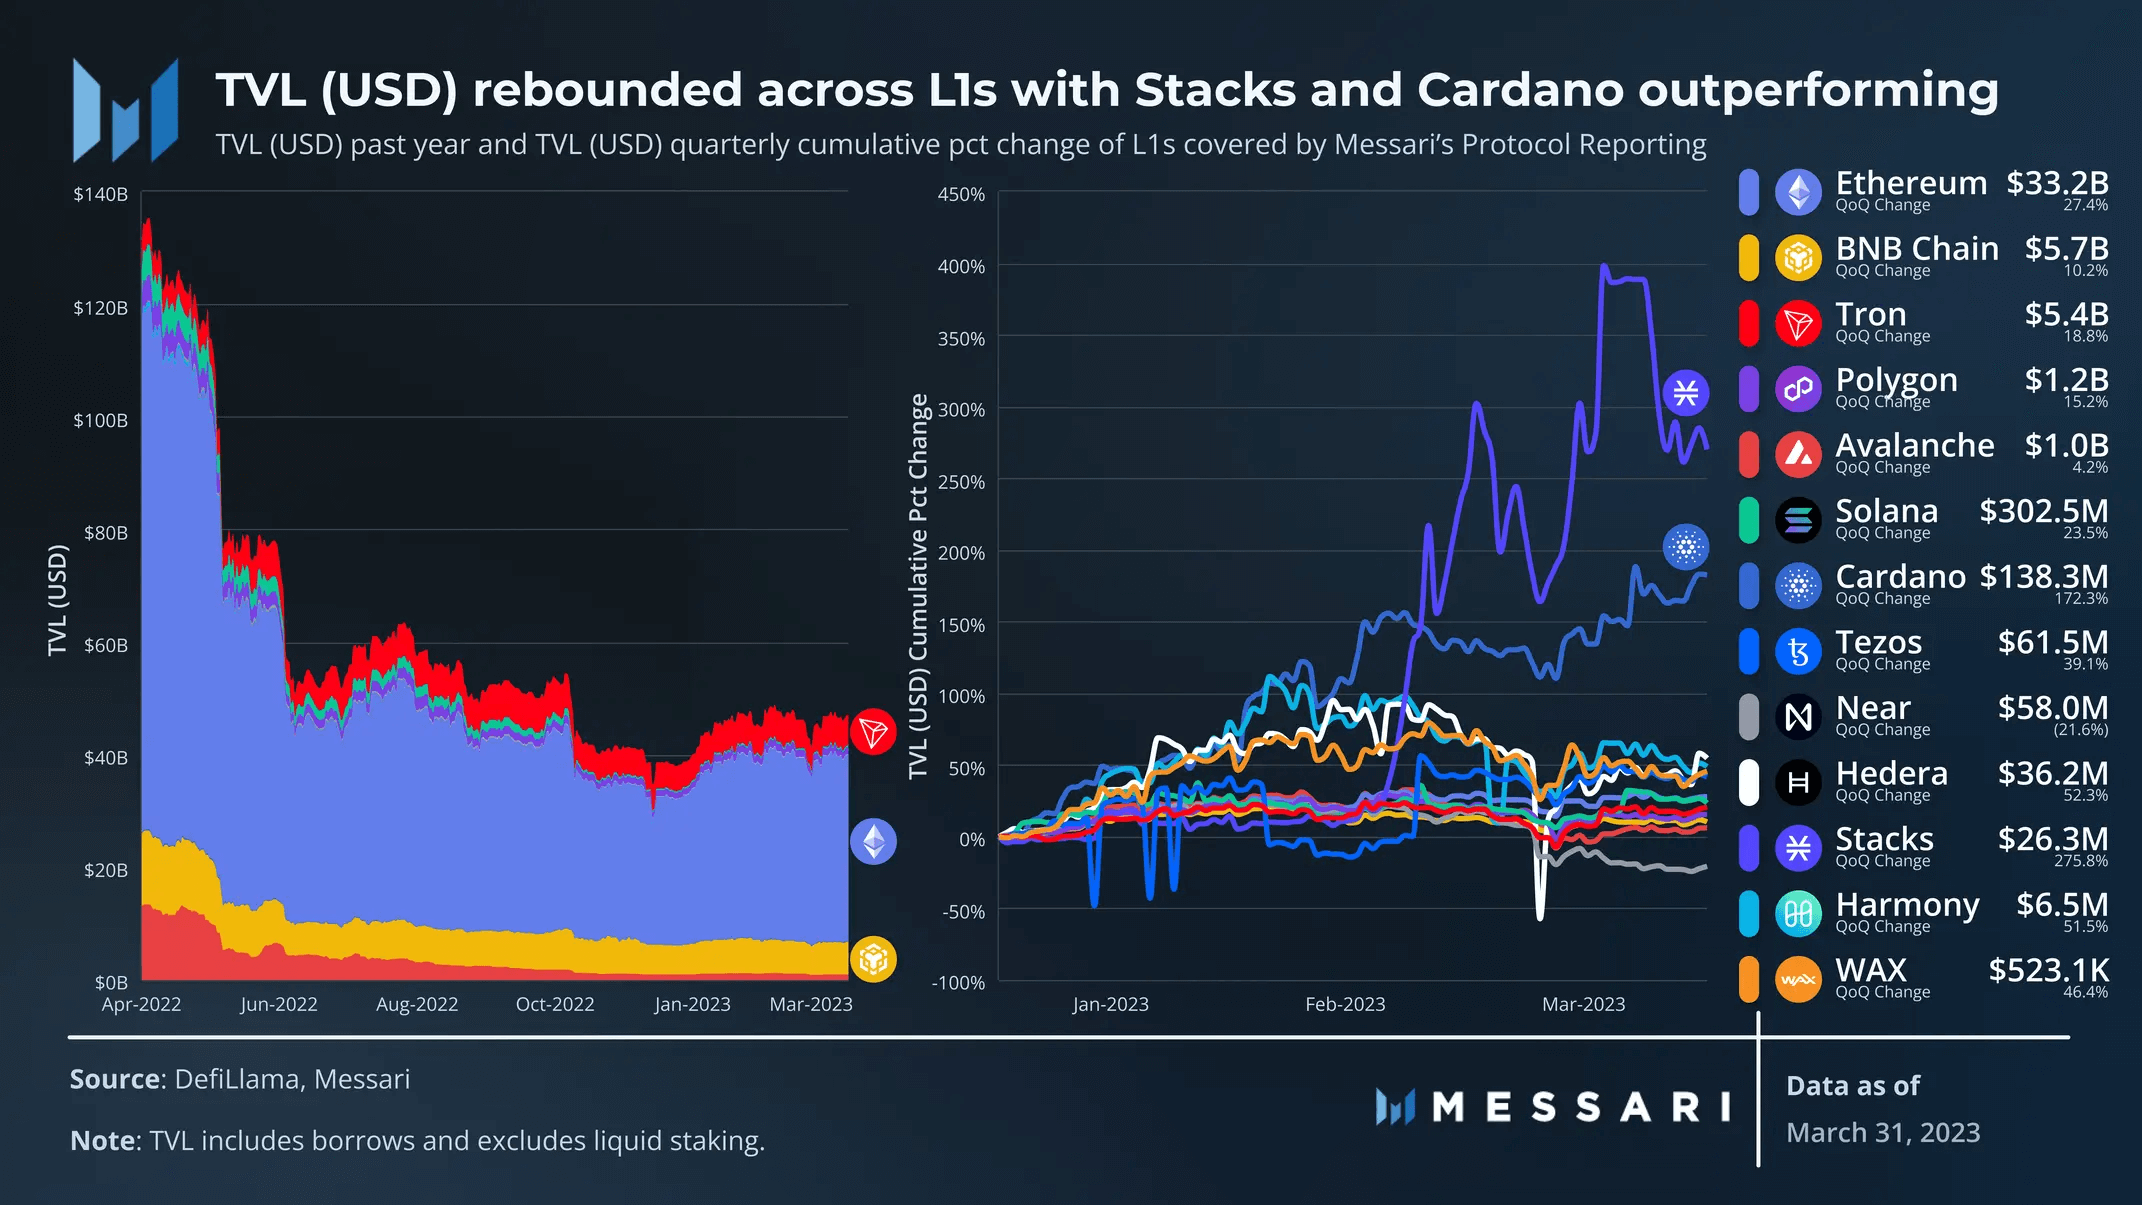
As expected during a market rebound, TVL measured in USD has also grown. The market capitalization of most public chains has changed more than TVL on a month-over-month basis. This relationship potentially suggests that the increase in TVL is more due to price appreciation than net capital inflows.
Nevertheless, Ethereum is still the main participant in TVL, followed by BNB Chain and TRON. Stacks and Cardano outperformed other public chains, rising 276% and 172% respectively. Stacks’ TVL rose sharply from around February 17th to 22nd, consistent with the rise in STX price. Cardano TVL steadily increased throughout the quarter and benefited from the launch of several stablecoins described further below.
NEAR is an exception, with its TVL declining throughout the quarter. The 22% month-over-month drop occurred mainly during the USDC decoupling period.
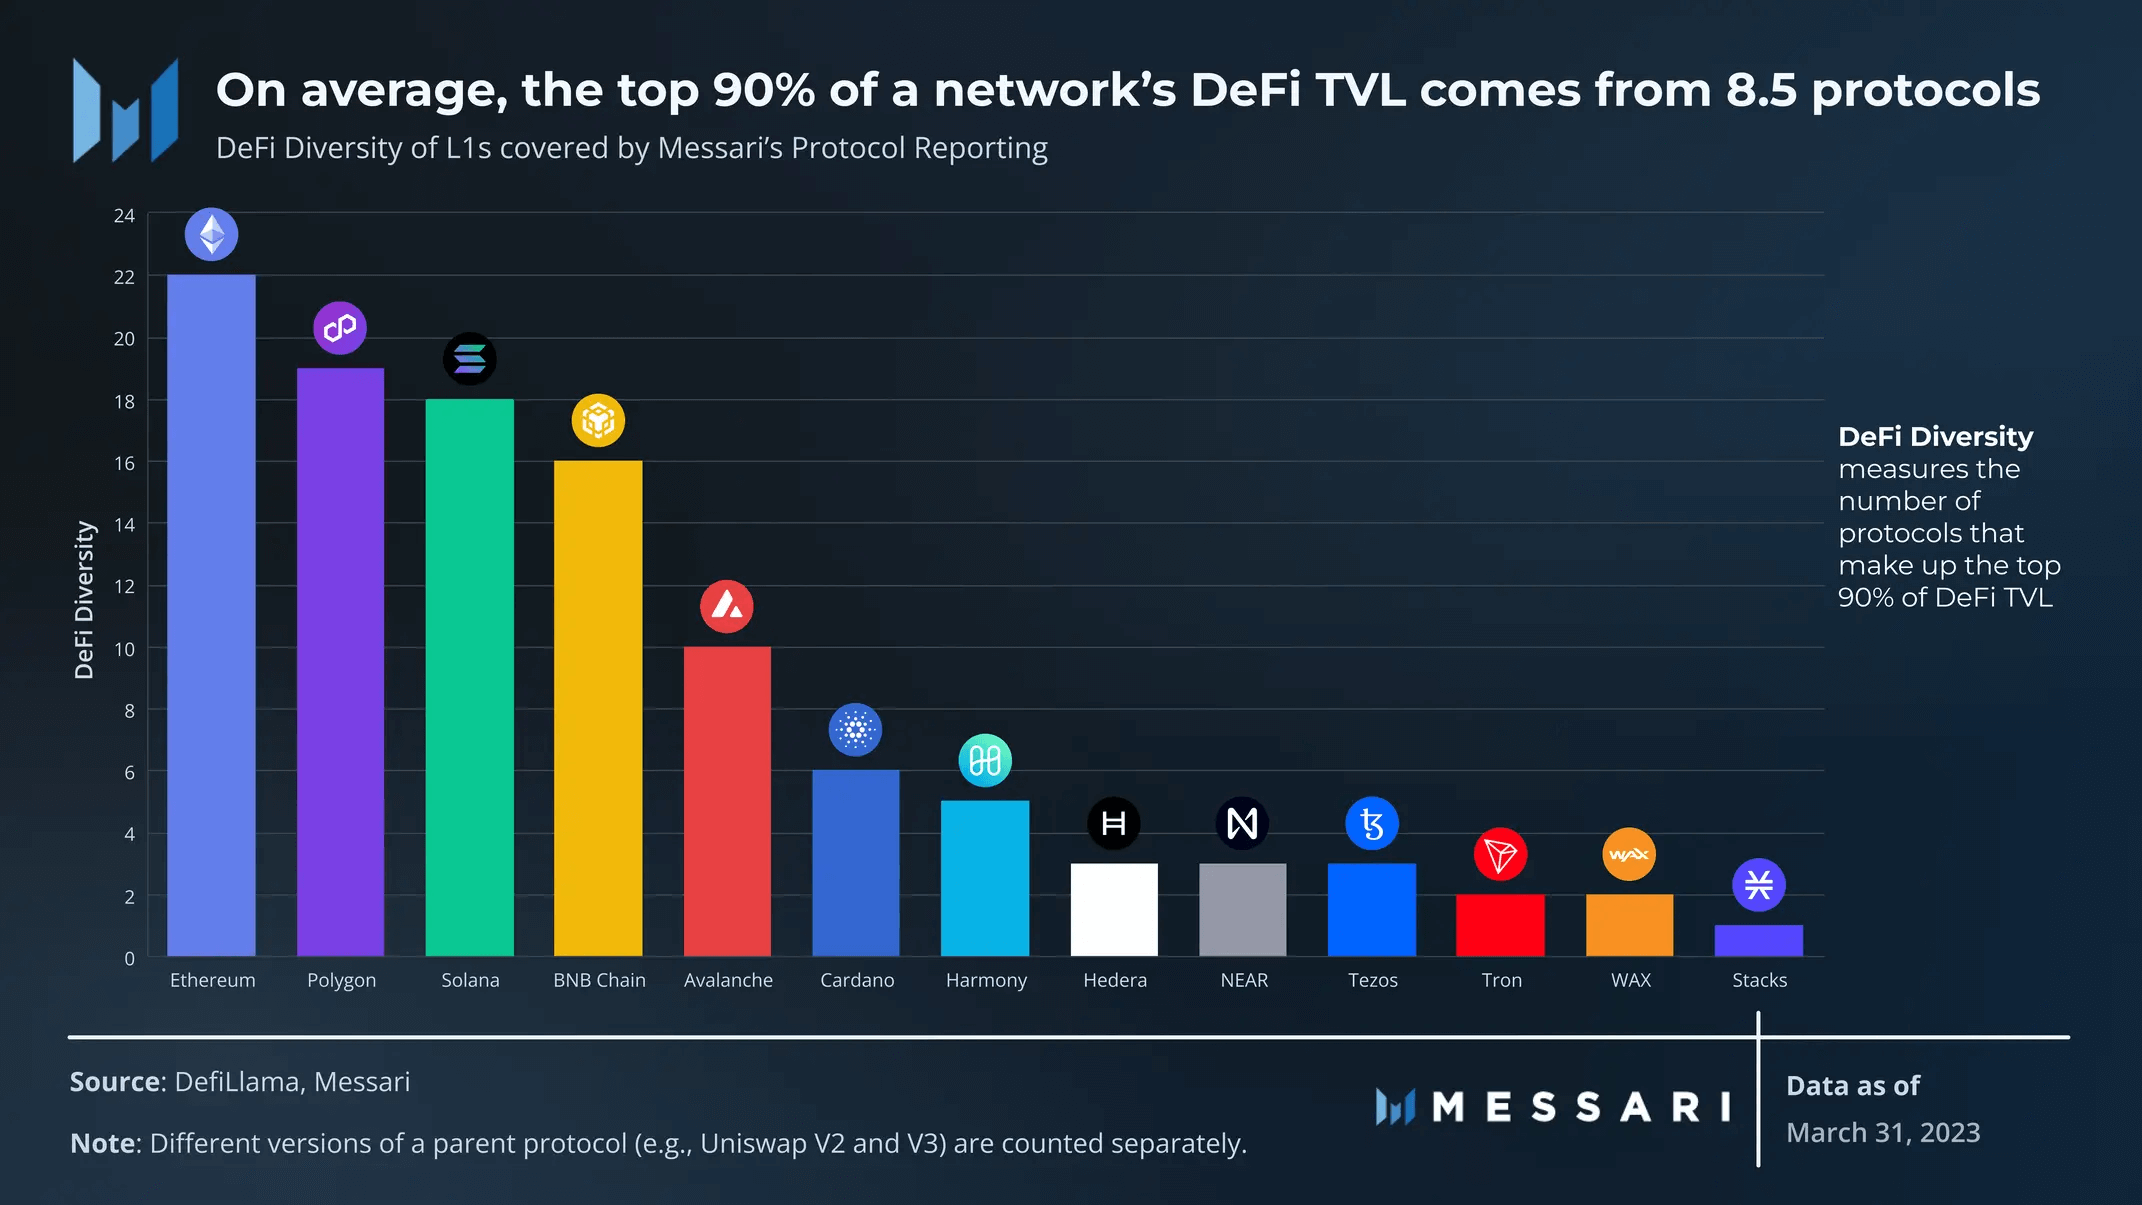
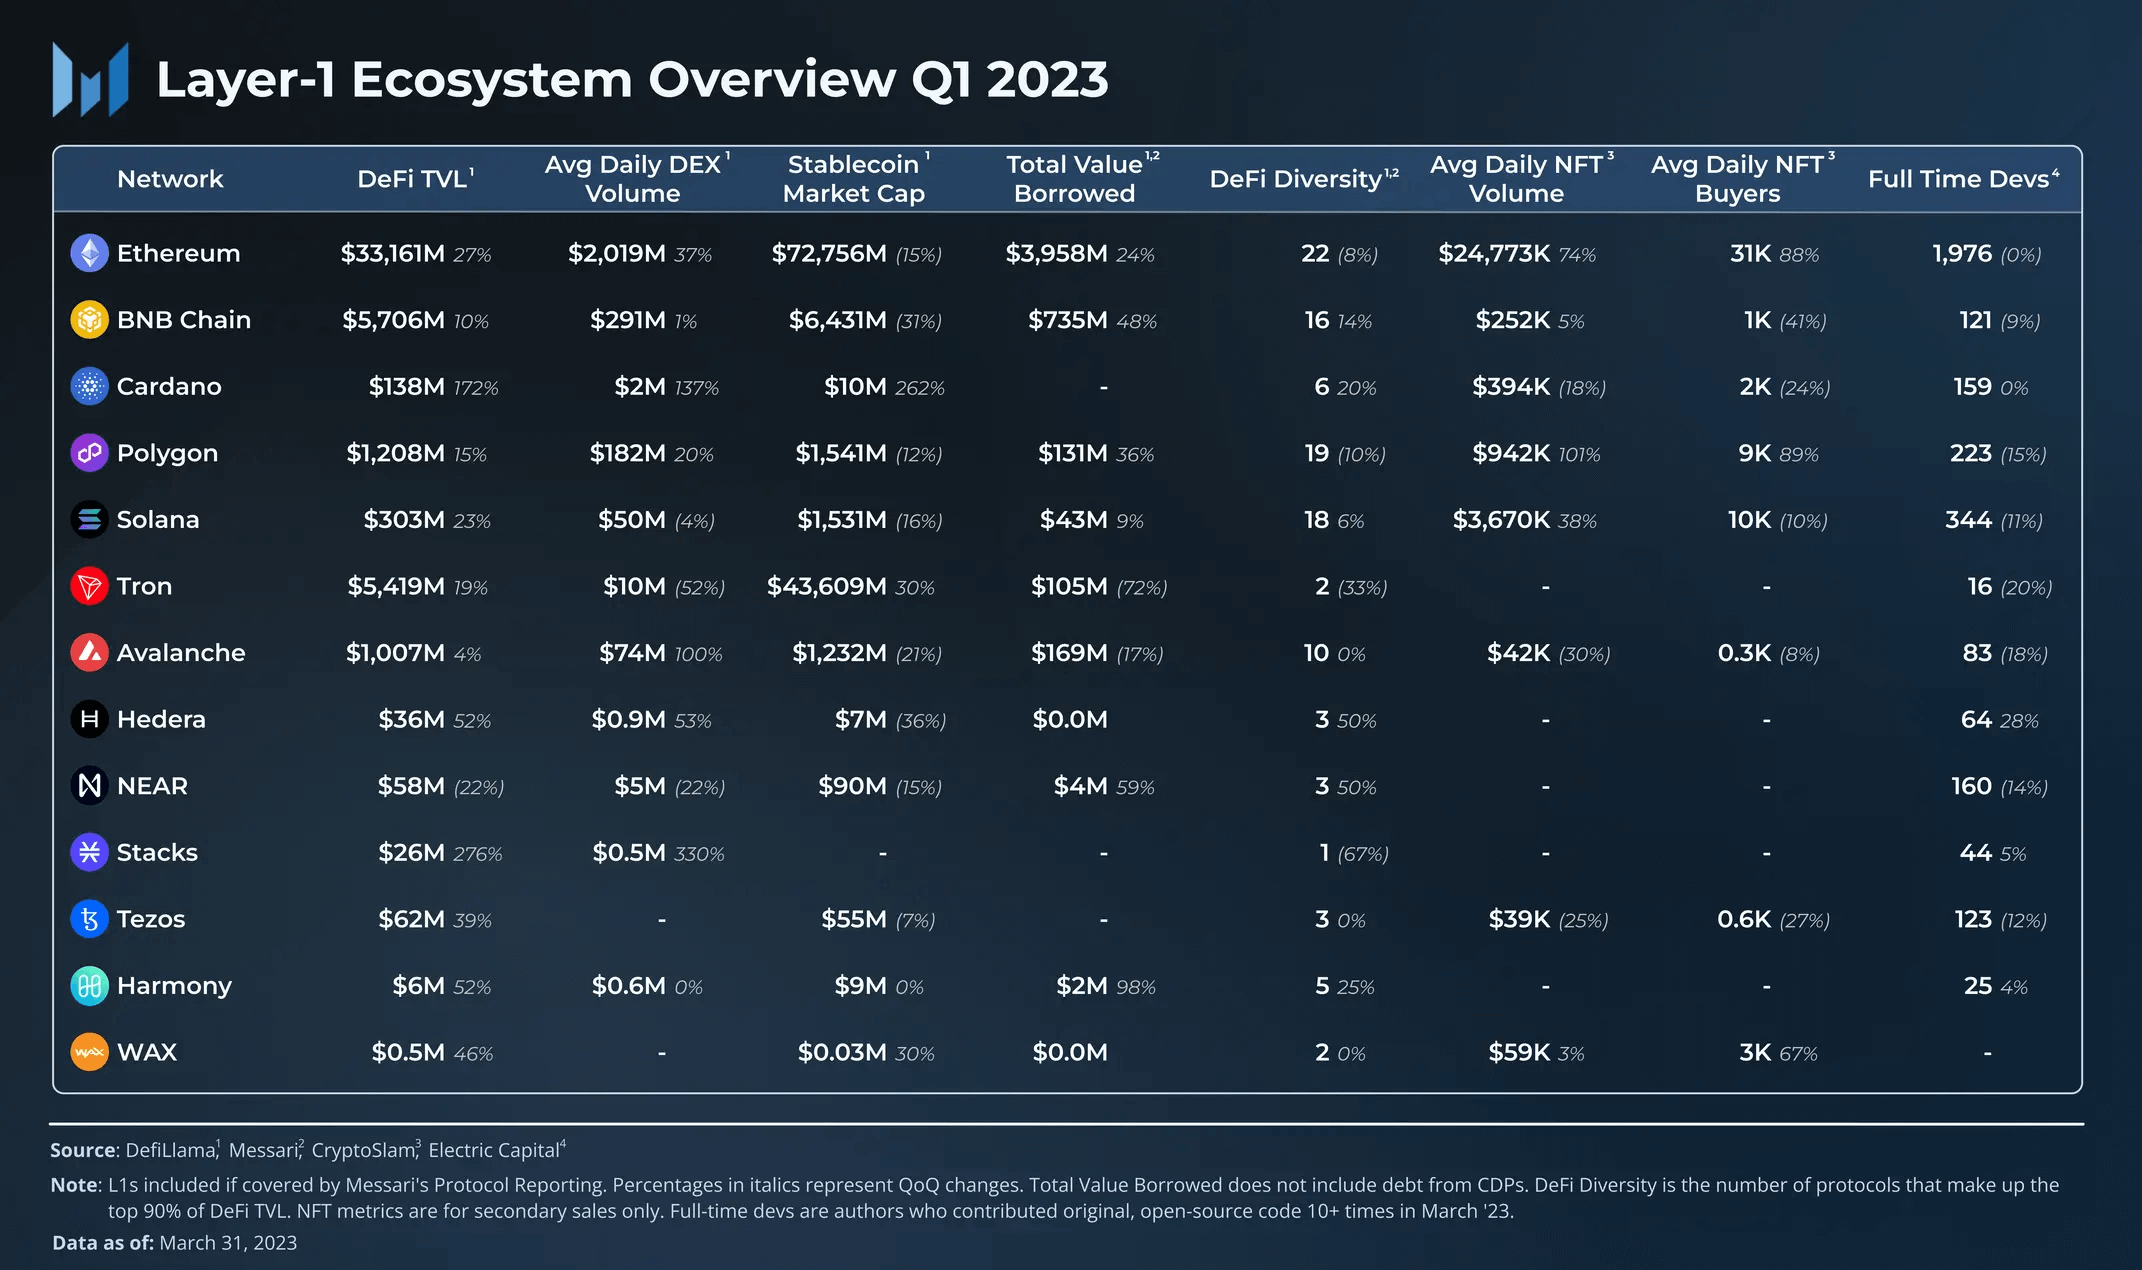
DeFi Diversification scores measure the number of protocols that make up the top 90% of DeFi TVL. Ethereum scores 22 in DeFi Diversification, followed by Polygon (19), Solana (18), and BNB Chain (16). The ranking is roughly similar to the TVL ranking, but TRON is clearly an exception. TRON’s TVL ranks third ($5.4 billion), of which over 70% is in JustLend.
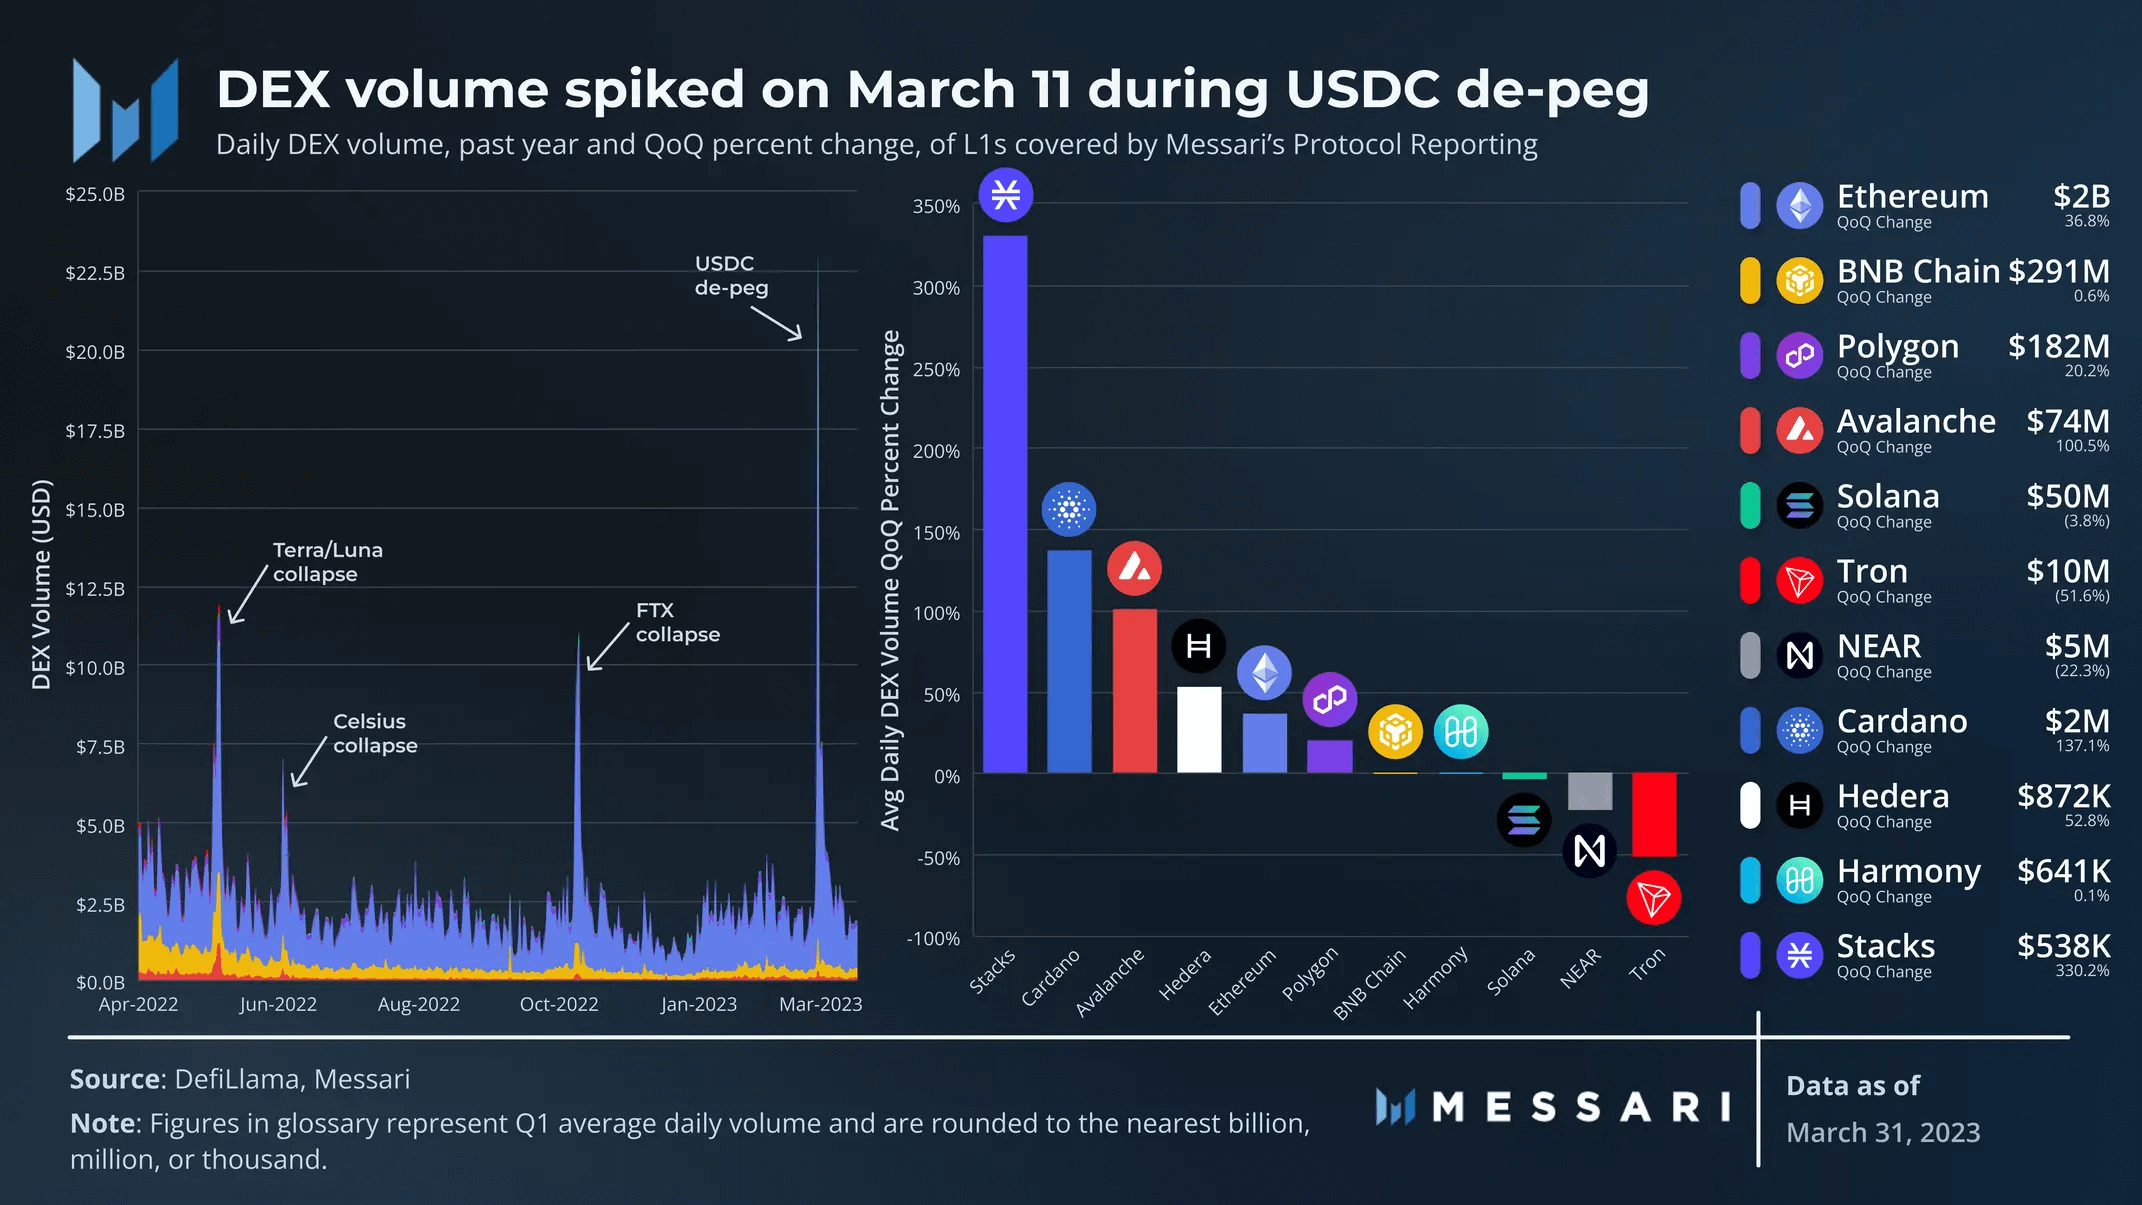
The daily trading volume of most public chains has increased month-over-month. Like TVL, Stacks and Cardano had the largest quarterly increases in month-over-month percentage, at 330% and 101% respectively. On March 11th, during the USDC decoupling period, DEX’s daily trading volume soared thanks to Ethereum’s trading volume exceeding $20 billion. This peak was almost twice the peak during the Terra/Luna, Celsius, and FTX crashes.
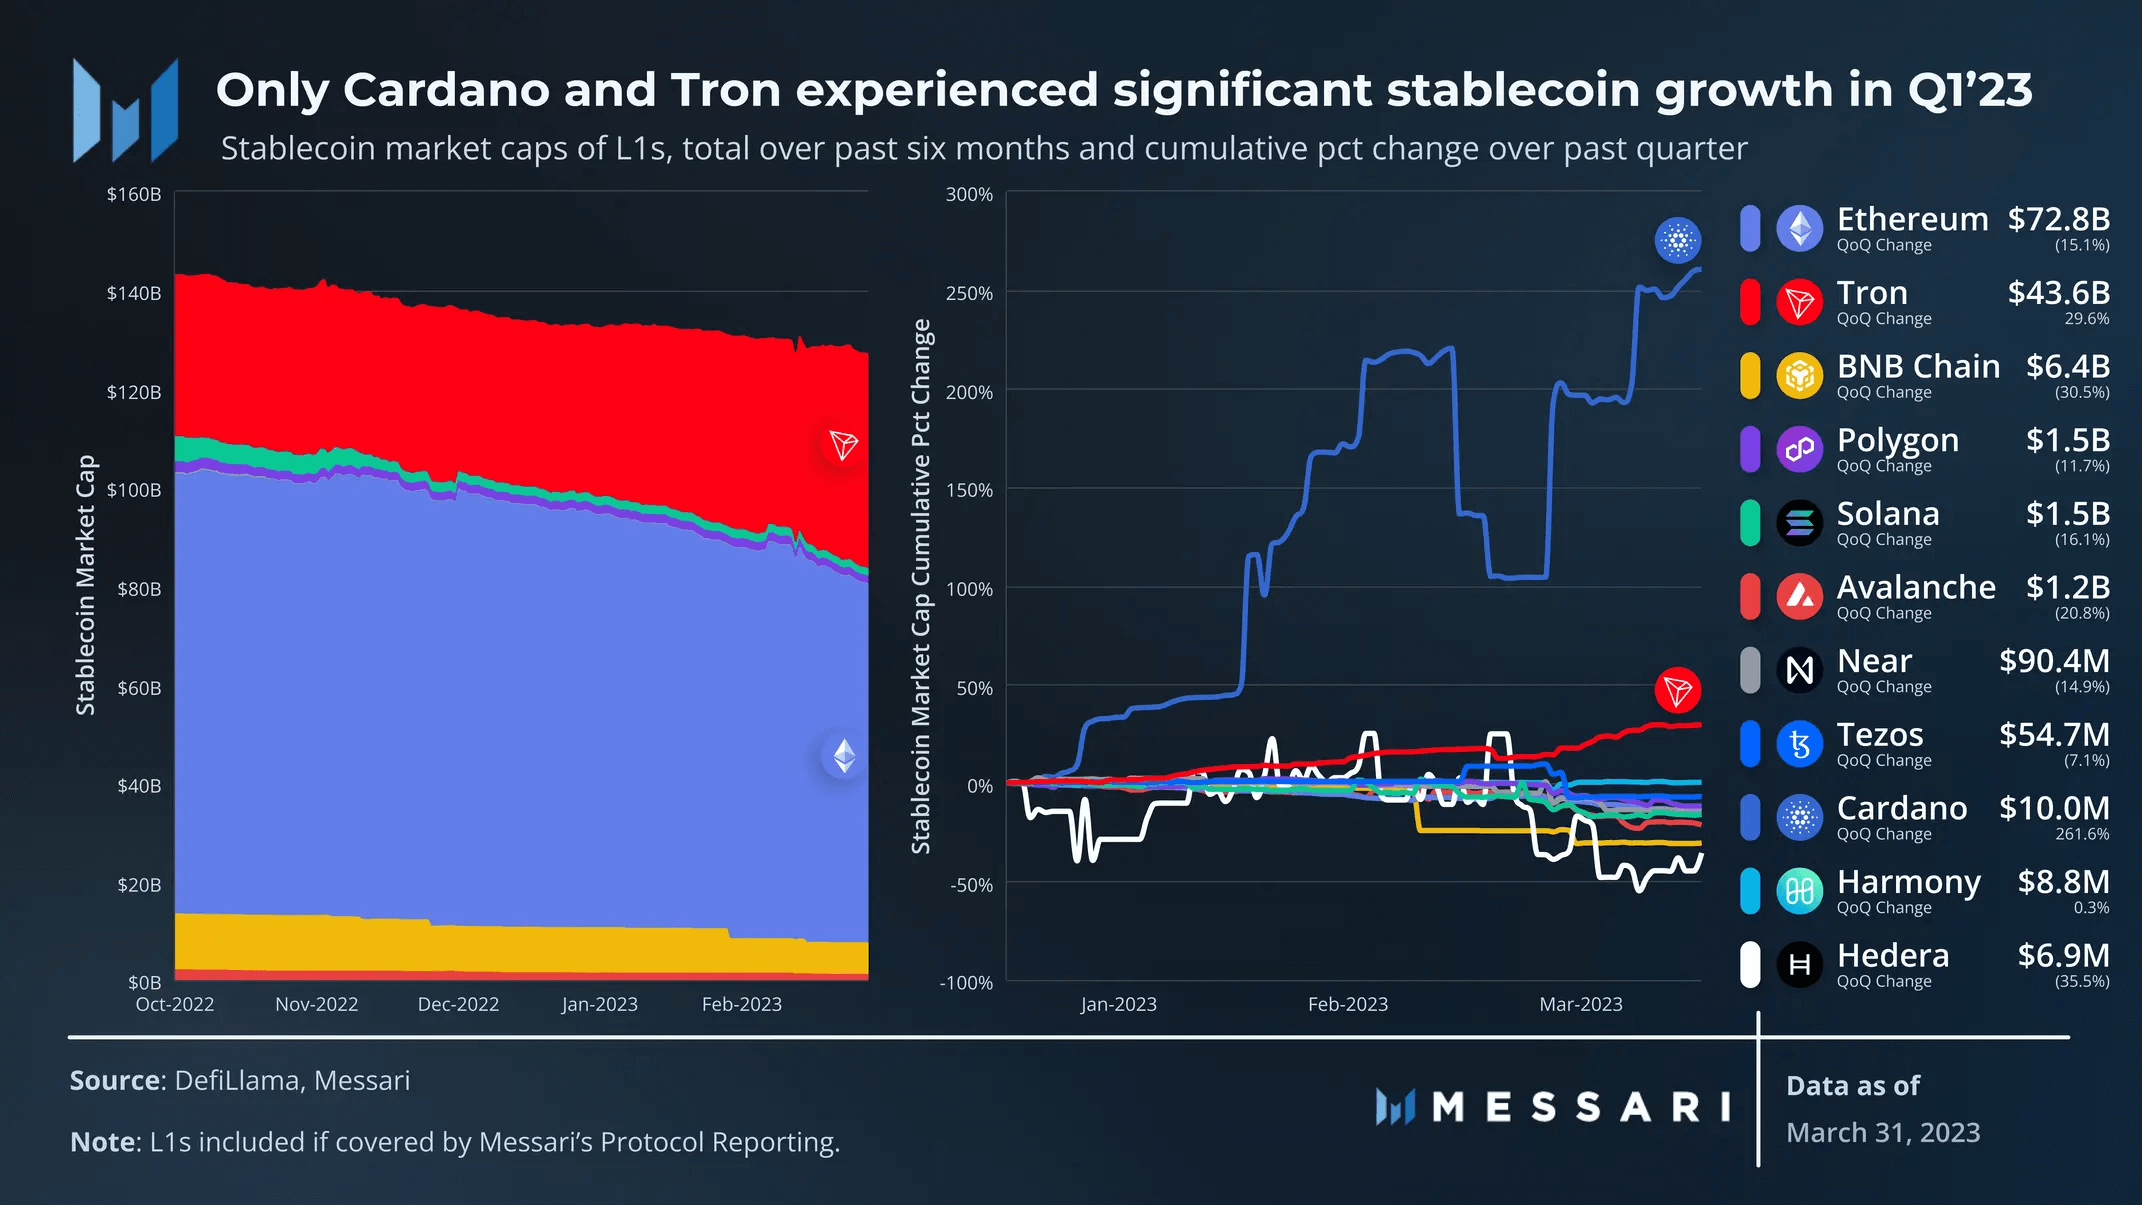
Overall, the market capitalization of stablecoins continued to decline steadily over the past quarter, with several major events related to stablecoins:
In March 2023, a run on Silicon Valley Bank caused USDC to temporarily lose value, dropping to a low of approximately $0.87 during the period from March 10 to March 13. From March 10 to the end of the quarter, USDC’s market cap across all chains decreased by 24%. On February 13, regulators instructed Blockingxos to halt the issuance of BUSD, which was then the third-largest stablecoin behind only USDC and USDT. From February 13 to the end of the quarter, BUSD’s market cap across all chains decreased by 52%. Prior to the USDC de-pegging event, USDC was the leading stablecoin on each blockchain, with native USDC issuances on Ethereum, Polygon, Solana, Avalanche, and Hedera. Similarly, BUSD was the primary stablecoin on the Binance Smart Chain, leading to a 31% decrease in its stablecoin market cap. These events caused some BUSD and USDC holders to convert to USDT, leading to a 17% increase in USDT’s market cap from February 13 to the end of the quarter. TRON was the largest beneficiary of this migration (since one of TRON’s primary use cases is holding and transferring USDT), with its stablecoin market cap increasing by 30% quarter-over-quarter. Only Cardano’s stablecoin market cap increased by 262% quarter-over-quarter. Cardano has no USDC, USDT, or BUSD, so it was not impacted by the aforementioned events. By market cap, Cardano’s top two stablecoins, IUSD and DJED, are set to launch in Q4 2022 and Q1 2023, respectively. Their continued growth is crucial to the Cardano ecosystem.
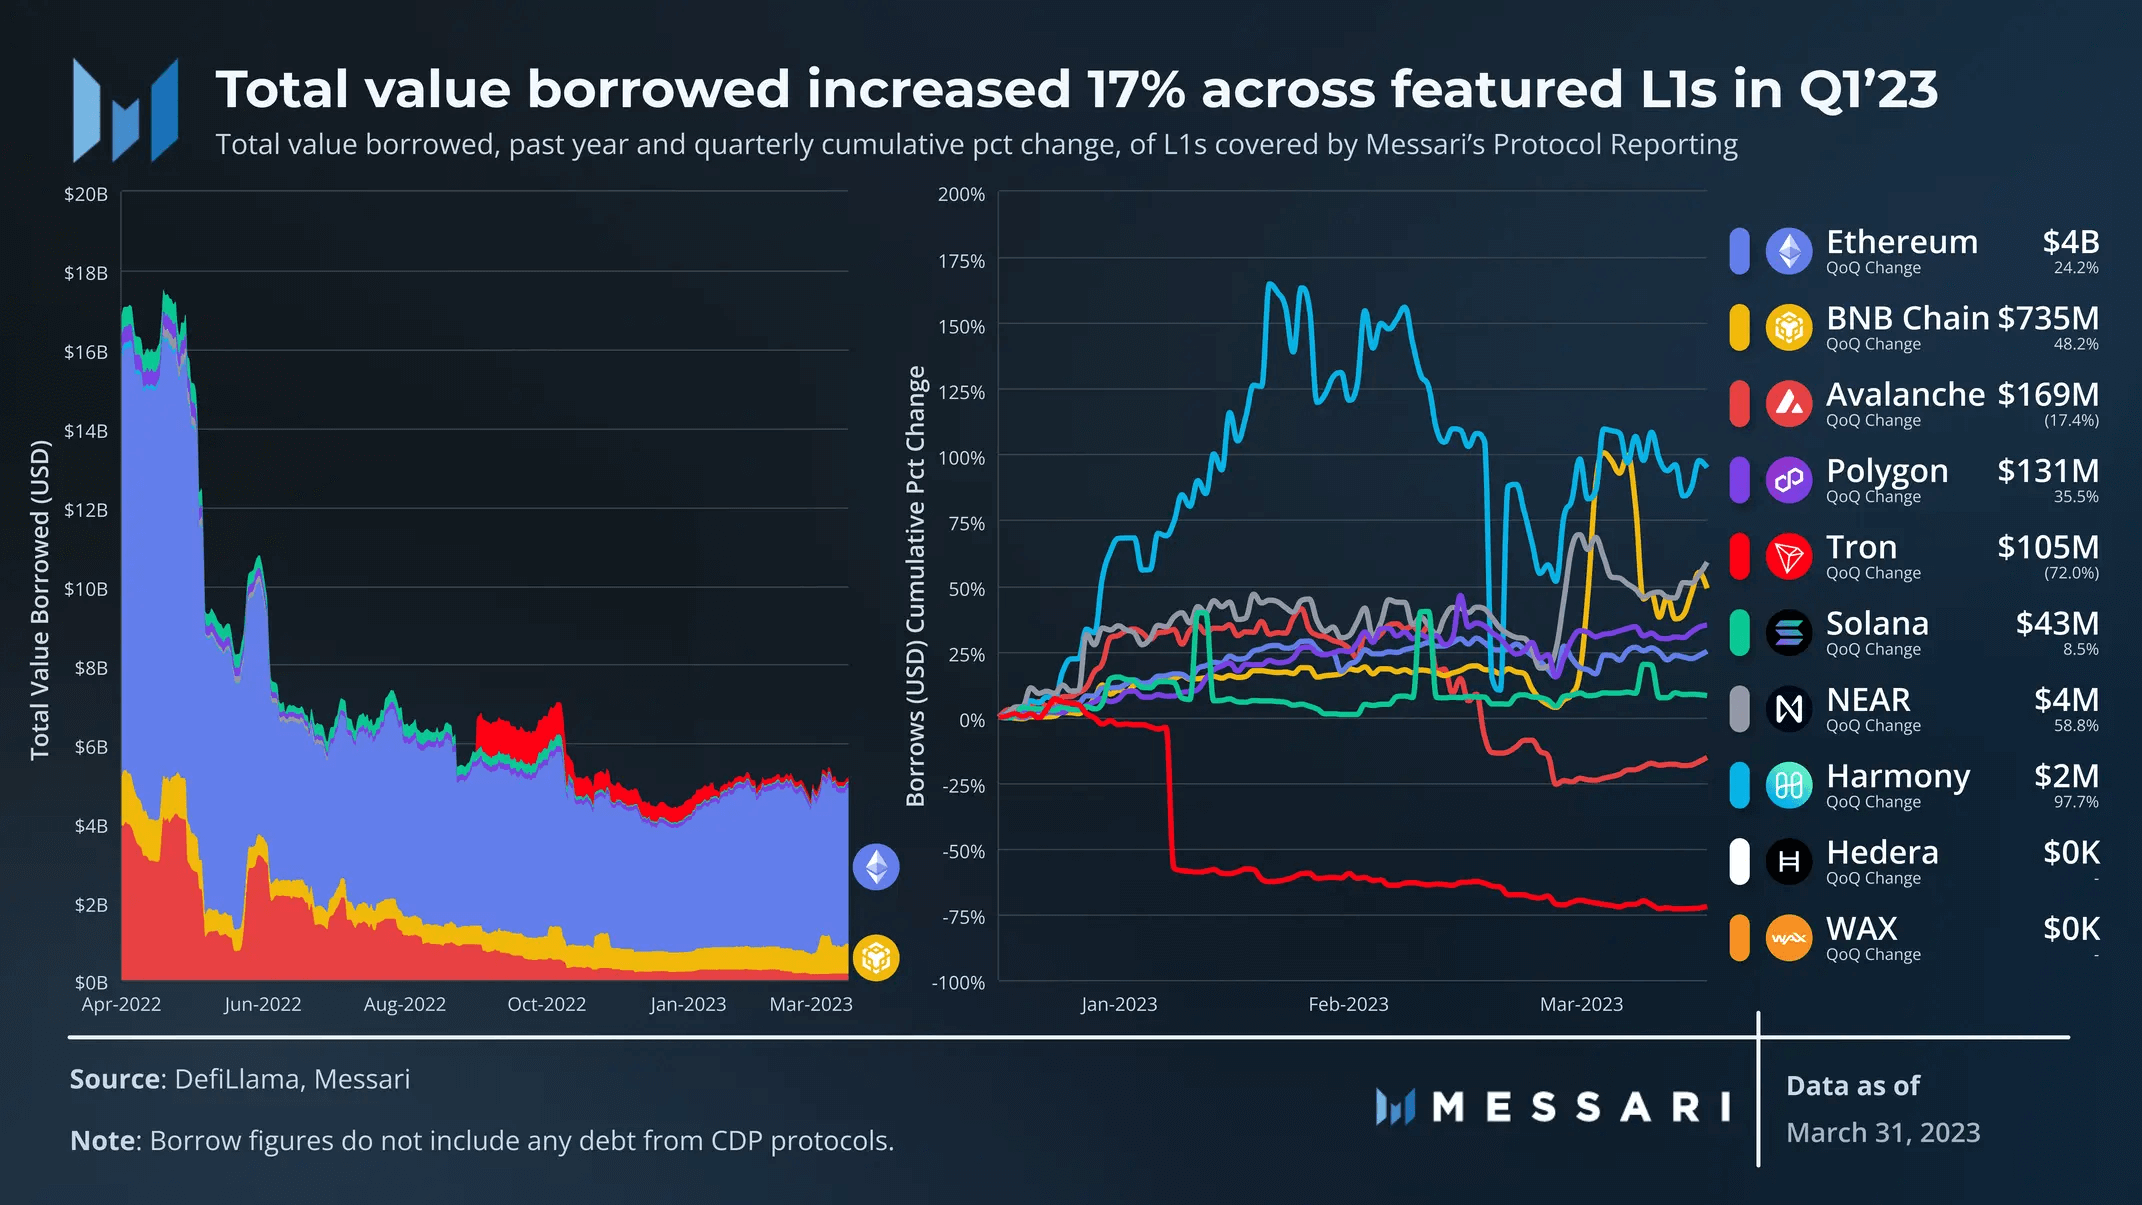
The lending value metric provides additional context for DeFi activity on public chains. While a large amount of lending can lead to more unstable liquidations, lending is typically where users trust to borrow and where protocols make money (from liquidations and lending fees). Note that DeFiLlama’s lending data does not include CDP debt. As a result, Cardano, Stacks, and Tezos have been excluded from this analysis because all or most of their DeFi debt comes from CDP protocols. Across all public chains, the total lending value increased by 17% quarter-over-quarter. Ethereum still dominates with nearly $4 billion, followed by BNB Chain with $735 million. Unlike these metrics, Avalanche leads Polygon, although the gap narrowed over the course of the quarter.
NFTs
Despite high gas fees, Ethereum remains the primary venue for NFT activity. Blur established its dominance in the Ethereum market in Q1 23, gaining a strong foothold through token issuance and a mid-February airdrop. According to hildobby’s Dune dashboard, Blur’s average weekly trade volume share increased from 31% to 59%. Only Polygon surpassed Ethereum in average daily trade volume for the quarter, with a 101% increase.
Ethereum also leads in daily unique NFT buyers, with an 88% increase MoM. In late February, Coinbase launched a commemorative NFT on Ethereum to celebrate its Base. The “Base, Introduced” series was free to mint for a few days and peaked at over 122,000 unique buyers on February 26.
Only Polygon surpassed Ethereum in average daily unique buyers for the quarter, with an 89% increase MoM.
Despite a MoM decrease in this metric, Tezos saw its NFT buyer average increase to over 10,000 people within a week of launching the free McLaren F1 series at the end of the quarter.
Developers
Developer data is always incomplete, but Electric Capital’s developer report sets the gold standard for measuring developer activity. It defines developers as authors who contribute original, open-source code to an ecosystem and full-time developers as those who contribute more than 10 days per month of original, open-source code.
Among 14 chains, full-time developers decreased by 4% MoM. Ethereum only decreased by 0.1% and remains the head ecosystem for developers. Ethereum has 1,976 full-time developers, nearly equal to the sum of all other public chains. Hedera had the largest increase in full-time developers, with a MoM increase of 28% to 64 people.
Related reading: Year-End Public Chain Inventory Series | How Many Directions for Public Chain Innovation
We will continue to update Blocking; if you have any questions or suggestions, please contact us!
Was this article helpful?
93 out of 132 found this helpful
Related articles
- Blockchain Capital: Why did we lead the investment in Worldcoin? We believe it will become the largest gateway to the crypto world.
- Blockchain Capital: Why did we lead the investment in Worldcoin?
- Understanding the Launch Rules of Neutron, the First Consumer Chain in the Cosmos Ecosystem
- Worldcoin has completed a $115 million C round of financing, led by Blockchain Capital.
- How can we determine whether a stablecoin is an official native asset after Multichain’s shutdown exposed asset security issues?
- Summary of Hong Kong Securities and Futures Commission’s Cryptocurrency Consultation: Retail Trading, Temporary Ban on Stablecoins, and Inclusion in Indices are Minimum Standards
- LSD injects a shot in the arm for blockchain. What risks should users pay attention to?